• Cat-intel
  • MedIntelliX
  • Resources
  • About Us
  • Hero Background
    English
    Chinese
    French
    Japanese
    Korean
    German
    Spanish

    Precipitated Silica Market Analysis

    ID: MRFR/CnM/1468-CR
    200 Pages
    Chitranshi Jaiswal
    June 2025

    Precipitated Silica Market Research Report By Process (Dry Process, Wet Process, Pyrogenic (Fumed) Process), By Source (Natural Sources, Synthetic Source, Recycled Sources, Byproduct Sources, Specialty Sources), By Grade (Standard Grade, High Purity Grade, Ultrafine Grade, Food Grade, Industrial Grade), By Application (Additives, Free Flow Agents, Adsorbents, Catalysts, Others), By End-Use (Aut...

    Share:
    Download PDF ×

    We do not share your information with anyone. However, we may send you emails based on your report interest from time to time. You may contact us at any time to opt-out.

    Precipitated Silica Market Infographic
    $ 4,950.0
    $ 5,950.0
    $ 7,250.0

    Market Analysis

    In-depth Analysis of Precipitated Silica Market Industry Landscape

    Precipitated silica is an important part of tire formulas because it improves fuel economy, wet grip, and tire performance generally. One main reason for this need is the growing car industry. A lot of personal care and makeup companies use precipitated silica, which helps the market grow. It is an important part of toothpaste, skin care solutions, and hair care products because it has special properties like being able to absorb water and control the size of particles. Personal grooming is becoming more and more important, which is driving demand in this area. In the precipitated silica market, environmental factors are having an impact, and green and environmentally friendly production methods are becoming more popular. Manufacturers use methods that are good for the earth, cut down on carbon emissions, and look into green energy sources. This change fits in with efforts around the world to encourage preservation and lessen damage to the earth. Food and animal feed are becoming big users of precipitated silica, which helps the market grow. It keeps food from clumping together and improves the flow of powdered products. It helps horse feed absorb water and keep it from sticking. These flexible uses are creating a wide range of demand. In the market for precipitated silica, ongoing research and development projects encourage new ideas, which leads to new types and formulas. The focus is on improving the performance of precipitated silica for a wide range of uses, which will increase its market potential and meet changing buyer needs. Asia-Pacific is becoming a major player in the Precipitated Silica market thanks to its fast development and strong manufacturing sector. In places like China and India, the demand for precipitated silica is rising because end-use businesses are growing. Important raw products and skilled workers are easy to find in this area, which adds to its importance. Some things that affect production and marketing in the Precipitated Silica business are delays in transportation and the supply of raw materials. To avoid unpredictability and make sure they always have a supply of precipitated silica, people in the market need to use strong supply chain techniques, like having a wide range of suppliers and making sure logistics run smoothly.

    Market Summary

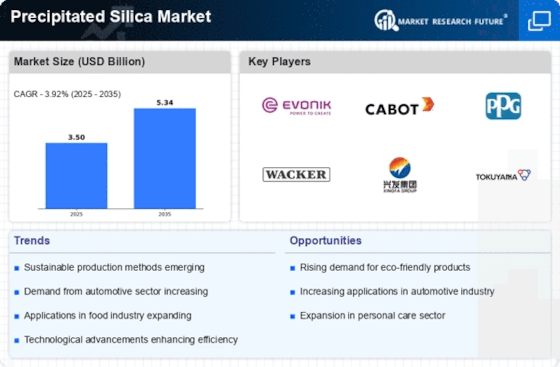
    As per MRFR analysis, the Precipitated Silica Market Size was estimated at 3.5 USD Billion in 2024. The Precipitated Silica industry is projected to grow from 3.637 USD Billion in 2025 to 5.343 USD Billion by 2035, exhibiting a compound annual growth rate (CAGR) of 3.92 during the forecast period 2025 - 2035.

    Key Market Trends & Highlights

    The Precipitated Silica Market is poised for growth driven by sustainability and technological advancements.

    • North America remains the largest market for precipitated silica, driven by robust demand across various industries. The Asia-Pacific region is emerging as the fastest-growing market, fueled by increasing industrialization and consumer demand. The Dry Process segment continues to dominate the market, while the Wet Process segment is experiencing rapid growth due to its efficiency. Rising demand in the automotive sector and expansion in personal care products are key drivers propelling market growth.

    Market Size & Forecast

    2024 Market Size 3.5 (USD Billion)
    2035 Market Size 5.343 (USD Billion)
    CAGR (2025 - 2035) 3.92%
    Largest Regional Market Share in 2024 Asia Pacific

    Major Players

    <p>Evonik Industries (DE), Cabot Corporation (US), PPG Industries (US), Wacker Chemie AG (DE), Hubei Xingfa Chemicals Group Co., Ltd. (CN), Tokuyama Corporation (JP), Solvay S.A. (BE), Orisil (IN), Fujian Zhanhua Chemical Co., Ltd. (CN)</p>

    Market Trends

    The Precipitated Silica Market is currently experiencing a dynamic phase characterized by evolving applications and increasing demand across various industries. This material, known for its unique properties such as high surface area and absorbent capabilities, finds extensive use in rubber, coatings, and personal care products. As industries seek to enhance product performance and sustainability, precipitated silica emerges as a preferred choice, potentially driving innovation and growth. Furthermore, the market appears to be influenced by a growing emphasis on eco-friendly materials, prompting manufacturers to explore sustainable production methods and formulations. In addition to sustainability, the Precipitated Silica Market is witnessing advancements in technology that enhance production efficiency and product quality. Innovations in manufacturing processes may lead to the development of specialized grades of silica tailored for specific applications, thereby expanding market reach. The increasing focus on health and safety regulations also plays a role in shaping market dynamics, as companies strive to comply with stringent standards while meeting consumer expectations. Overall, the Precipitated Silica Market seems poised for continued evolution, driven by a combination of technological advancements and shifting consumer preferences.

    Sustainability Initiatives

    The Precipitated Silica Market is increasingly influenced by sustainability initiatives, as manufacturers seek to reduce environmental impact. This trend involves the adoption of eco-friendly production methods and the development of biodegradable products, aligning with global efforts to promote greener practices.

    Technological Advancements

    Technological advancements are reshaping the Precipitated Silica Market, with innovations in production processes enhancing efficiency and product quality. These developments may lead to the creation of specialized silica grades, catering to diverse industry needs and expanding market opportunities.

    Regulatory Compliance

    Regulatory compliance is becoming a critical factor in the Precipitated Silica Market, as companies navigate stringent health and safety standards. This trend compels manufacturers to prioritize safety in their products, ensuring they meet consumer expectations while adhering to regulations.

    <p>The demand for precipitated silica is anticipated to grow as industries increasingly recognize its multifunctional properties in applications ranging from rubber and tires to food and pharmaceuticals.</p>

    U.S. Geological Survey

    Precipitated Silica Market Market Drivers

    Increasing Regulatory Standards

    The Precipitated Silica Market is also shaped by the rising regulatory standards concerning product safety and environmental impact. Governments and regulatory bodies are implementing stricter guidelines for the use of additives in various industries, including food, cosmetics, and automotive. Compliance with these regulations is essential for manufacturers, prompting them to seek high-quality precipitated silica that meets safety and performance criteria. This trend is likely to drive innovation and investment in the Precipitated Silica Market, as companies strive to enhance their product offerings while adhering to regulatory requirements. The emphasis on safety and sustainability may lead to a more competitive landscape, ultimately benefiting consumers and the industry as a whole.

    Rising Demand in Automotive Sector

    The Precipitated Silica Market is experiencing a notable surge in demand from the automotive sector. This increase is primarily driven by the growing need for lightweight materials that enhance fuel efficiency and reduce emissions. Precipitated silica is utilized in tire manufacturing, where it improves wet traction and rolling resistance. According to recent estimates, the automotive industry accounts for a substantial share of the precipitated silica consumption, with projections indicating a compound annual growth rate of approximately 5% over the next few years. As automotive manufacturers continue to prioritize sustainability and performance, the demand for precipitated silica is likely to rise, further solidifying its role in the Precipitated Silica Market.

    Expansion in Personal Care Products

    The Precipitated Silica Market is witnessing significant growth due to its increasing application in personal care products. Silica is widely used as a thickening agent, anti-caking agent, and absorbent in cosmetics and skincare formulations. The rising consumer awareness regarding personal grooming and hygiene is propelling the demand for high-quality personal care products, which in turn drives the need for precipitated silica. Market data suggests that the personal care segment is expected to grow at a rate of around 4% annually, reflecting the industry's shift towards innovative and effective formulations. This trend indicates a promising future for the Precipitated Silica Market as manufacturers seek to enhance product performance and consumer satisfaction.

    Growth in Food and Beverage Applications

    The Precipitated Silica Market is benefiting from its expanding use in the food and beverage sector. Silica serves as an anti-caking agent and a flow agent in powdered food products, ensuring consistency and quality. The increasing demand for processed and packaged foods is driving the need for effective additives, including precipitated silica. Recent market analysis indicates that the food and beverage segment is projected to grow at a rate of approximately 3.5% per year, highlighting the potential for precipitated silica to play a crucial role in maintaining product integrity. As consumer preferences shift towards convenience and quality, the Precipitated Silica Market is likely to see sustained growth in this application area.

    Technological Innovations in Manufacturing

    Technological advancements in the manufacturing processes of precipitated silica are significantly influencing the Precipitated Silica Market. Innovations such as improved precipitation techniques and enhanced purification methods are leading to higher quality products with better performance characteristics. These advancements not only increase production efficiency but also reduce environmental impact, aligning with the industry's sustainability goals. As manufacturers adopt these technologies, the overall supply chain becomes more robust, potentially lowering costs and increasing accessibility. The ongoing research and development efforts in this field suggest that the Precipitated Silica Market will continue to evolve, driven by the need for superior products and sustainable practices.

    Market Segment Insights

    By Process: Dry Process (Largest) vs. Wet Process (Fastest-Growing)

    <p>In the Precipitated Silica Market, the Dry Process segment holds the largest share, comprising a significant portion of the market due to its efficiency and cost-effectiveness. The Wet Process segment, while smaller, is rapidly gaining traction as manufacturers seek sustainable and environmentally friendly production techniques. The Pyrogenic (Fumed) Process, though a niche player, offers unique properties, catering to specialized applications within the industry. As such, market share distribution reveals a clear hierarchy of dominance and growth potential among these processes.</p>

    <p>Dry Process: Dominant vs. Wet Process: Emerging</p>

    <p>The Dry Process is recognized as the dominant method in precipitated silica production, boasting superior efficiency and lower operational costs, making it a favorable choice for many manufacturers. In contrast, the Wet Process is emerging as a viable alternative, driven by a growing demand for sustainability in industrial practices. Its ability to produce high-purity silica with minimal environmental impact appeals to eco-conscious enterprises. The Pyrogenic (Fumed) Process, while less prevalent, serves specialized industries requiring high-performance silica, demonstrating the diversity in production techniques within the market.</p>

    By Source: Natural Sources (Largest) vs. Synthetic Sources (Fastest-Growing)

    <p>In the Precipitated Silica Market, the distribution of market share among various sources reveals a significant dominance of Natural Sources, which continually appeal to environmentally conscious consumers and industries. This segment has established itself firmly due to its abundant availability and sustainable extraction methods. Conversely, Synthetic Sources are emerging rapidly, reflecting innovative advancements in manufacturing processes that enhance performance characteristics, making them increasingly appealing to high-end applications.</p>

    <p>Natural Sources (Dominant) vs. Synthetic Sources (Emerging)</p>

    <p>Natural Sources of precipitated silica are characterized by their eco-friendliness and sustainability, fulfilling the growing demand for green products. They primarily originate from natural silica deposits and provide unique properties like high purity and low environmental impact. On the other hand, Synthetic Sources are gaining traction as an emerging alternative, driven by technological innovations that allow for tailored properties to meet specific industrial needs. These synthetics benefit from controlled production processes, leading to high consistency and specialized applications, making them attractive for industries requiring precise specifications.</p>

    By Grade: Standard Grade (Largest) vs. High Purity Grade (Fastest-Growing)

    <p>In the Precipitated Silica Market, the Standard Grade holds the largest market share, benefiting from its widespread application in various industries including rubber, coatings, and plastics. Its established demand and versatility make it a prevalent choice across multiple sectors. The High Purity Grade, while not the largest, is quickly gaining traction due to its specialized uses in high-end applications such as electronics and pharmaceuticals, signaling a shift towards more refined silica products.</p>

    <p>Grade: Standard (Dominant) vs. High Purity (Emerging)</p>

    <p>The Standard Grade of precipitated silica is well-established in the market, showcasing a robust influence due to its cost-effectiveness and multifunctionality in applications such as tires and <a href="https://www.marketresearchfuture.com/reports/industrial-coatings-market-2136">industrial coatings</a>. Conversely, the High Purity Grade, characterized by its exceptional cleanliness and lack of contaminants, is observing a rapidly increasing demand within industries requiring stringent quality standards. This grade is emerging as a preferred option in sectors like electronics, where high-performance materials are essential. As industries evolve, the divergence in application potentials reveals that while Standard Grade remains a dominant force, High Purity Grade is carving out its niche with significant growth prospects.</p>

    By Application: Additives (Largest) vs. Free Flow Agents (Fastest-Growing)

    <p>In the Precipitated Silica Market, the application segment is primarily characterized by additives, which hold a significant share due to their widespread use in various industries such as rubber, coatings, and <a href="https://www.marketresearchfuture.com/reports/plastics-market-8347">plastics</a>. Free flow agents follow closely, capturing attention for their rising influence in food and pharmaceuticals, where they serve essential roles in improving flow characteristics and preventing caking. The other application values, such as adsorbents and catalysts, although essential, contribute to a smaller portion of the market, making the landscape competitive yet dominated by additive applications.</p>

    <p>Additives (Dominant) vs. Free Flow Agents (Emerging)</p>

    <p>Additives in the Precipitated Silica Market represent a dominant force, utilized extensively in sectors like rubber and coatings due to their enhanced performance characteristics, such as improved durability and moisture control. On the other hand, free flow agents are emerging rapidly, particularly in the food and pharmaceutical sectors, where they facilitate product stability and enhance processing efficiency. The demand for additives is driven by their proven effectiveness and versatility, while the growth of free flow agents is supported by stringent quality standards and innovations in food technology, making these segments critical for future market development.</p>

    By End-Use: Rubber and Plastics (Largest) vs. Electronics (Fastest-Growing)

    <p>In the Precipitated Silica Market, the 'End-Use' segment showcases a diverse distribution of applications, with Rubber and Plastics leading due to their extensive utilization in tire manufacturing and other automotive components. This segment holds a substantial market share, attributed to the enduring demand from the automotive industry and other sectors reliant on rubber products. Conversely, Electronics, while currently smaller in market share, is emerging rapidly due to the increasing need for high-performance materials in electronic devices, contributing significantly to the segment's growth dynamics.</p>

    <p>Rubber and Plastics: Dominant vs. Electronics: Emerging</p>

    <p>Rubber and Plastics dominate the Precipitated Silica Market as they are integral to the production of tires and various automotive components, providing essential properties such as strength, durability, and flexibility. This segment benefits from consistent demand linked to the automotive industry's growth, as well as other applications in consumer goods. In contrast, the Electronics segment is considered emerging, driven by technological advancements and the rising requirement for high-quality materials in electronic applications. Innovations in this sector are paving the way for higher-performance precipitated silica, which enhances product efficiency and sustainability, thus making it a fast-growing segment with significant market potential.</p>

    Get more detailed insights about Precipitated Silica Market Research Report – Forecast till 2035

    Regional Insights

    North America : Innovation and Demand Surge

    North America is witnessing robust growth in the precipitated silica market, driven by increasing demand in the automotive and consumer goods sectors. The region holds approximately 35% of the global market share, making it the largest market. Regulatory support for sustainable materials and innovations in manufacturing processes are key catalysts for this growth. The rising focus on eco-friendly products is further propelling demand for precipitated silica. The United States and Canada are the leading countries in this region, with major players like Evonik Industries and Cabot Corporation dominating the market. The competitive landscape is characterized by continuous innovation and strategic partnerships among key players. The presence of advanced manufacturing facilities and a strong distribution network enhances market accessibility, ensuring a steady supply of precipitated silica to meet growing demands.

    Europe : Sustainability and Innovation Focus

    Europe is emerging as a significant player in the precipitated silica market, driven by stringent environmental regulations and a strong push for sustainable materials. The region accounts for approximately 30% of the global market share, making it the second-largest market. Regulatory frameworks aimed at reducing carbon footprints and promoting eco-friendly products are key growth drivers. The increasing demand for precipitated silica in the rubber and tire industries is also notable, as manufacturers seek to enhance product performance while adhering to sustainability goals. Germany, France, and the UK are leading countries in this market, with companies like Wacker Chemie AG and Solvay S.A. playing pivotal roles. The competitive landscape is marked by innovation and collaboration among industry players to develop advanced silica solutions. The presence of established manufacturing hubs and research institutions further strengthens the region's market position, fostering continuous advancements in precipitated silica applications.

    Asia-Pacific : Rapid Industrialization and Growth

    Asia-Pacific is rapidly becoming a powerhouse in the precipitated silica market, driven by industrialization and increasing demand from various sectors, including automotive and electronics. The region holds approximately 25% of the global market share, with China and India being the largest contributors. The growing focus on enhancing product quality and performance in manufacturing processes is a significant driver of market growth. Additionally, favorable government policies and investments in infrastructure are expected to further boost demand for precipitated silica in the coming years. China is the leading country in this region, with companies like Hubei Xingfa Chemicals and Fujian Zhanhua Chemical Co., Ltd. dominating the market. The competitive landscape is characterized by a mix of local and international players, with a strong emphasis on innovation and cost-effective production methods. The presence of a large consumer base and increasing industrial activities are key factors driving the growth of the precipitated silica market in Asia-Pacific.

    Middle East and Africa : Emerging Markets and Opportunities

    The Middle East and Africa region is witnessing emerging opportunities in the precipitated silica market, driven by increasing industrial activities and a growing focus on sustainable materials. The region holds approximately 10% of the global market share, with countries like South Africa and the UAE leading the way. The demand for precipitated silica in various applications, including construction and personal care, is on the rise, supported by government initiatives aimed at diversifying economies and promoting local manufacturing. South Africa is a key player in this market, with a growing number of local manufacturers entering the precipitated silica space. The competitive landscape is evolving, with both regional and international companies vying for market share. The presence of abundant natural resources and a young workforce presents significant growth potential for the precipitated silica market in the Middle East and Africa, paving the way for future investments and innovations.

    Key Players and Competitive Insights

    The Precipitated Silica Market is currently characterized by a dynamic competitive landscape, driven by increasing demand across various industries such as rubber, plastics, and personal care. Key players are actively engaging in strategies that emphasize innovation, regional expansion, and sustainability. Notably, Evonik Industries (Germany) has positioned itself as a leader in specialty chemicals, focusing on enhancing its product portfolio through research and development. Similarly, Cabot Corporation (US) is leveraging its technological expertise to optimize its manufacturing processes, thereby improving efficiency and reducing environmental impact. These strategic initiatives collectively contribute to a competitive environment that is increasingly focused on value creation and sustainability.

    In terms of business tactics, companies are localizing manufacturing to better serve regional markets and optimize supply chains. The Precipitated Silica Market appears moderately fragmented, with several key players exerting influence over their respective segments. This fragmentation allows for a diverse range of products and innovations, although it also necessitates that companies remain agile and responsive to market changes. The collective influence of these key players shapes the market structure, fostering a competitive atmosphere that encourages continuous improvement and adaptation.

    In August 2025, Wacker Chemie AG (Germany) announced the expansion of its precipitated silica production facility in the United States. This strategic move is expected to enhance its capacity to meet growing demand in North America, particularly in the automotive and consumer goods sectors. The expansion not only signifies Wacker's commitment to regional growth but also reflects a broader trend of companies investing in local production capabilities to mitigate supply chain disruptions.

    In September 2025, Solvay S.A. (Belgium) unveiled a new line of sustainable precipitated silica products aimed at reducing carbon emissions during production. This initiative aligns with the increasing emphasis on sustainability within the industry and positions Solvay as a forward-thinking player committed to environmental stewardship. By introducing eco-friendly alternatives, Solvay is likely to attract environmentally conscious customers and enhance its competitive edge.

    In October 2025, Tokuyama Corporation (Japan) entered into a strategic partnership with a leading automotive manufacturer to develop specialized silica solutions for tire applications. This collaboration is indicative of the growing trend towards innovation in product development, as companies seek to create tailored solutions that meet specific industry needs. Such partnerships not only enhance product offerings but also strengthen market positioning through shared expertise and resources.

    As of October 2025, the Precipitated Silica Market is witnessing significant trends such as digitalization, sustainability, and the integration of artificial intelligence in production processes. Strategic alliances are increasingly shaping the competitive landscape, enabling companies to pool resources and innovate more effectively. Looking ahead, it is anticipated that competitive differentiation will evolve, with a shift from traditional price-based competition towards a focus on innovation, technological advancement, and supply chain reliability. This evolution underscores the importance of adaptability and forward-thinking strategies in maintaining a competitive edge.

    Key Companies in the Precipitated Silica Market market include

    Industry Developments

    • Q2 2024: Evonik opens new precipitated silica plant in South Carolina to meet growing demand from tire industry Evonik Industries inaugurated a new manufacturing facility for precipitated silica in Charleston, South Carolina, aimed at supplying the North American tire industry with high-performance silica for fuel-efficient tires.
    • Q1 2024: PPG expands precipitated silica production capacity at Lake Charles, Louisiana plant PPG Industries announced the completion of a capacity expansion at its Lake Charles facility, increasing output of precipitated silica to support growth in the automotive and industrial rubber sectors.
    • Q2 2024: Solvay launches new high-dispersibility precipitated silica for energy-efficient tires Solvay introduced a new grade of high-dispersibility precipitated silica designed to enhance rolling resistance and wet grip in next-generation energy-efficient tires.
    • Q3 2024: Denka announces partnership with Japanese automaker for supply of advanced precipitated silica Denka Company Limited entered into a multi-year supply agreement with a major Japanese automotive manufacturer to provide advanced precipitated silica for use in eco-friendly tire production.
    • Q2 2024: Huber Engineered Materials appoints new Vice President for Silica Business Unit Huber Engineered Materials named a new Vice President to lead its Silica Business Unit, focusing on strategic growth and innovation in precipitated silica applications.
    • Q1 2025: Oriental Silicas Corporation opens new research and development center for precipitated silica in Taiwan Oriental Silicas Corporation inaugurated a state-of-the-art R&D center in Taiwan dedicated to developing advanced precipitated silica products for the electronics and personal care industries.
    • Q2 2025: W.R. Grace & Co. secures major contract to supply precipitated silica to leading global toothpaste manufacturer W.R. Grace & Co. announced a multi-year supply agreement with a top global oral care company to provide precipitated silica for use in toothpaste formulations.
    • Q3 2024: PQ Corporation completes upgrade of precipitated silica production line in Kansas PQ Corporation completed a significant upgrade to its Kansas production facility, increasing efficiency and capacity for precipitated silica used in food and industrial applications.
    • Q2 2024: Madhu Silica Pvt. Ltd. announces expansion of precipitated silica exports to Europe Madhu Silica Pvt. Ltd. expanded its export operations, signing new distribution agreements to supply precipitated silica to several European countries for use in rubber and personal care products.
    • Q1 2025: Covia Holdings LLC launches new eco-friendly precipitated silica product line for paints and coatings Covia Holdings LLC introduced a new line of environmentally friendly precipitated silica products targeting the paints and coatings industry, emphasizing sustainability and performance.
    • Q2 2025: Anten Chemical Co. Ltd. announces strategic partnership with South Korean electronics manufacturer Anten Chemical Co. Ltd. entered into a strategic partnership with a major South Korean electronics company to develop and supply high-purity precipitated silica for battery separator applications.
    • Q3 2024: QUECHEN opens new precipitated silica plant in Vietnam to serve Southeast Asian market QUECHEN inaugurated a new manufacturing facility in Vietnam, expanding its footprint in Southeast Asia and increasing supply of precipitated silica for regional tire and industrial customers.


    Future Outlook

    Precipitated Silica Market Future Outlook

    <p>The Precipitated Silica Market is projected to grow at a 3.92% CAGR from 2024 to 2035, driven by increasing demand in automotive and consumer goods sectors.</p>

    New opportunities lie in:

    • <p>Expansion into bio-based silica production methods</p><p>Development of specialized silica for high-performance tires</p><p>Strategic partnerships with manufacturers in emerging markets</p>

    <p>By 2035, the market is expected to achieve robust growth, solidifying its position in various industrial applications.</p>

    Market Segmentation

    Precipitated Silica Market Grade Outlook

    • Standard Grade
    • High Purity Grade
    • Ultrafine Grade
    • Food Grade
    • Industrial Grade

    Precipitated Silica Market Source Outlook

    • Natural Sources
    • Synthetic Sources
    • Recycled Sources
    • Byproduct Sources
    • Specialty Sources

    Precipitated Silica Market End-Use Outlook

    • Automotive
    • Electronics
    • Construction
    • Agriculture
    • Rubber and Plastics
    • Food and Beverage
    • Healthcare and Pharmaceuticals
    • Others

    Precipitated Silica Market Process Outlook

    • Dry Process
    • Wet Process
    • Pyrogenic (Fumed) Process

    Precipitated Silica Market Application Outlook

    • Additives
    • Free Flow Agents
    • Adsorbents
    • Catalysts
    • Others

    Report Scope

    MARKET SIZE 20243.5(USD Billion)
    MARKET SIZE 20253.637(USD Billion)
    MARKET SIZE 20355.343(USD Billion)
    COMPOUND ANNUAL GROWTH RATE (CAGR)3.92% (2024 - 2035)
    REPORT COVERAGERevenue Forecast, Competitive Landscape, Growth Factors, and Trends
    BASE YEAR2024
    Market Forecast Period2025 - 2035
    Historical Data2019 - 2024
    Market Forecast UnitsUSD Billion
    Key Companies ProfiledMarket analysis in progress
    Segments CoveredMarket segmentation analysis in progress
    Key Market OpportunitiesGrowing demand for eco-friendly products drives innovation in the Precipitated Silica Market.
    Key Market DynamicsRising demand for eco-friendly products drives innovation and competition in the precipitated silica market.
    Countries CoveredNorth America, Europe, APAC, South America, MEA

    Market Highlights

    Author

    Chitranshi Jaiswal
    Research Analyst Level I

    She holds an experience of about 6+ years in market research and business consulting, working under the spectrum of information communication technology, telecommunications and semiconductor domains. aarti conceptualizes and implements a scalable business strategy and provides strategic leadership to the clients. her expertise lies in market estimation, competitive intelligence, pipeline analysis, customer assessment, etc.

    Leave a Comment

    Latest Comments

    John Doe
    john@example.com

    This is a great article! Really helped me understand the topic better.

    Posted on July 23, 2025, 10:15 AM
    Jane Smith
    jane@domain.com

    Thanks for sharing this. I’ve bookmarked it for later reference.

    Posted on July 22, 2025, 7:45 PM

    FAQs

    What is the projected market valuation of the Precipitated Silica Market by 2035?

    The Precipitated Silica Market is projected to reach approximately 5.343 USD Billion by 2035.

    What was the market valuation of the Precipitated Silica Market in 2024?

    In 2024, the overall market valuation of the Precipitated Silica Market was 3.5 USD Billion.

    What is the expected CAGR for the Precipitated Silica Market during the forecast period 2025 - 2035?

    The expected CAGR for the Precipitated Silica Market during the forecast period 2025 - 2035 is 3.92%.

    Which companies are considered key players in the Precipitated Silica Market?

    Key players in the Precipitated Silica Market include Evonik Industries, Cabot Corporation, and Wacker Chemie AG.

    What are the main processes used in the production of precipitated silica?

    The main processes for producing precipitated silica include Dry Process, Wet Process, and Pyrogenic (Fumed) Process.

    How does the market for synthetic sources of precipitated silica compare to natural sources?

    In 2024, the market for synthetic sources was valued at 1.4 USD Billion, while natural sources were valued at 0.875 USD Billion.

    What applications are driving the demand for precipitated silica?

    Applications such as rubber and plastics, additives, and adsorbents are driving demand in the Precipitated Silica Market.

    What is the valuation of the automotive segment within the Precipitated Silica Market?

    The automotive segment was valued at 0.7 USD Billion in 2024 and is expected to grow in the coming years.

    What grades of precipitated silica are available in the market?

    Available grades of precipitated silica include Standard Grade, High Purity Grade, and Food Grade, among others.

    1. EXECUTIVE SUMMARY
      1. Market Overview
      2. Key Findings
      3. Market Segmentation
      4. Competitive Landscape
      5. Challenges and Opportunities
      6. Future Outlook
    2. MARKET INTRODUCTION
      1. Definition
      2. Scope of the study
        1. Research Objective
        2. Assumption
        3. Limitations
    3. RESEARCH METHODOLOGY
      1. Overview
      2. Data Mining
      3. Secondary Research
      4. Primary Research
        1. Primary Interviews and Information Gathering Process
        2. Breakdown of Primary Respondents
      5. Forecasting Model
      6. Market Size Estimation
        1. Bottom-Up Approach
        2. Top-Down Approach
      7. Data Triangulation
      8. Validation
    4. MARKET DYNAMICS
      1. Overview
      2. Drivers
      3. Restraints
      4. Opportunities
    5. MARKET FACTOR ANALYSIS
      1. Value chain Analysis
      2. Porter's Five Forces Analysis
        1. Bargaining Power of Suppliers
        2. Bargaining Power of Buyers
        3. Threat of New Entrants
        4. Threat of Substitutes
        5. Intensity of Rivalry
      3. COVID-19 Impact Analysis
        1. Market Impact Analysis
        2. Regional Impact
        3. Opportunity and Threat Analysis
    6. PRECIPITATED SILICA MARKET, BY PROCESS (USD BILLION)
      1. Dry Process
      2. Wet Process
      3. Pyrogenic (Fumed) Process
    7. PRECIPITATED SILICA MARKET, BY SOURCE (USD BILLION)
      1. Natural Sources
      2. Synthetic Source
      3. Recycled Sources
      4. Byproduct Sources
      5. Specialty Sources
    8. PRECIPITATED SILICA MARKET, BY GRADE (USD BILLION)
      1. Standard Grade
      2. High Purity Grade
      3. Ultrafine Grade
      4. Food Grade
      5. Industrial Grade
    9. PRECIPITATED SILICA MARKET, BY APPLICATION (USD BILLION)
      1. Additives
      2. Free Flow Agents
      3. Adsorbents
      4. Catalysts
      5. Others
    10. PRECIPITATED SILICA MARKET, BY END-USE (USD BILLION)
      1. Automotive
      2. Electronics
      3. Construction
      4. Agriculture
      5. Rubber and Plastics
      6. Food and Beverage
      7. Healthcare and Pharmaceuticals
      8. Others
    11. PRECIPITATED SILICA MARKET, BY REGIONAL (USD BILLION)
      1. North America
        1. US
        2. Canada
      2. Europe
        1. Germany
        2. UK
        3. France
        4. Russia
        5. Italy
        6. Spain
        7. Rest of Europe
      3. APAC
        1. China
        2. India
        3. Japan
        4. South Korea
        5. Malaysia
        6. Thailand
        7. Indonesia
        8. Rest of APAC
      4. South America
        1. Brazil
        2. Mexico
        3. Argentina
        4. Rest of South America
      5. MEA
        1. GCC Countries
        2. South Africa
        3. Rest of MEA
    12. COMPETITIVE LANDSCAPE
      1. Overview
      2. Competitive Analysis
      3. Market share Analysis
      4. Major Growth Strategy in the Precipitated Silica Market
      5. Competitive Benchmarking
      6. Leading Players in Terms of Number of Developments in the Precipitated Silica Market
      7. Key developments and growth strategies
        1. New Product Launch/Service Deployment
        2. Merger & Acquisitions
        3. Joint Ventures
      8. Major Players Financial Matrix
        1. Sales and Operating Income
        2. Major Players R&D Expenditure. 2023
    13. COMPANY PROFILES
      1. Hubei Update Science and Technology
        1. Financial Overview
        2. Products Offered
        3. Key Developments
        4. SWOT Analysis
        5. Key Strategies
      2. Huanggang Yinfeng Silicon
        1. Financial Overview
        2. Products Offered
        3. Key Developments
        4. SWOT Analysis
        5. Key Strategies
      3. Fujian Zhangzhou Guanghua Technology
        1. Financial Overview
        2. Products Offered
        3. Key Developments
        4. SWOT Analysis
        5. Key Strategies
      4. Cabot Corporation
        1. Financial Overview
        2. Products Offered
        3. Key Developments
        4. SWOT Analysis
        5. Key Strategies
      5. Intercontinental Technology
        1. Financial Overview
        2. Products Offered
        3. Key Developments
        4. SWOT Analysis
        5. Key Strategies
      6. Nisso Shoji
        1. Financial Overview
        2. Products Offered
        3. Key Developments
        4. SWOT Analysis
        5. Key Strategies
      7. Wacker Chemie
        1. Financial Overview
        2. Products Offered
        3. Key Developments
        4. SWOT Analysis
        5. Key Strategies
      8. Madhu Silica
        1. Financial Overview
        2. Products Offered
        3. Key Developments
        4. SWOT Analysis
        5. Key Strategies
      9. PPG Industries
        1. Financial Overview
        2. Products Offered
        3. Key Developments
        4. SWOT Analysis
        5. Key Strategies
      10. Evonik Industries
        1. Financial Overview
        2. Products Offered
        3. Key Developments
        4. SWOT Analysis
        5. Key Strategies
      11. Fioretto
        1. Financial Overview
        2. Products Offered
        3. Key Developments
        4. SWOT Analysis
        5. Key Strategies
      12. Siye Chemical
        1. Financial Overview
        2. Products Offered
        3. Key Developments
        4. SWOT Analysis
        5. Key Strategies
      13. Orica
        1. Financial Overview
        2. Products Offered
        3. Key Developments
        4. SWOT Analysis
        5. Key Strategies
      14. Solvay
        1. Financial Overview
        2. Products Offered
        3. Key Developments
        4. SWOT Analysis
        5. Key Strategies
    14. APPENDIX
      1. References
      2. Related Reports
    15. LIST OF TABLES
      1. \r\n
    16. LIST OF ASSUMPTIONS
    17. NORTH AMERICA PRECIPITATED SILICA MARKET SIZE ESTIMATES & FORECAST, BY PROCESS, 2019-2035 (USD BILLIONS)
    18. NORTH AMERICA PRECIPITATED SILICA MARKET SIZE ESTIMATES & FORECAST, BY SOURCE, 2019-2035 (USD BILLIONS)
    19. NORTH AMERICA PRECIPITATED SILICA MARKET SIZE ESTIMATES & FORECAST, BY GRADE, 2019-2035 (USD BILLIONS)
    20. NORTH AMERICA PRECIPITATED SILICA MARKET SIZE ESTIMATES & FORECAST, BY APPLICATION, 2019-2035 (USD BILLIONS)
    21. NORTH AMERICA PRECIPITATED SILICA MARKET SIZE ESTIMATES & FORECAST, BY END-USE, 2019-2035 (USD BILLIONS)
    22. NORTH AMERICA PRECIPITATED SILICA MARKET SIZE ESTIMATES & FORECAST, BY REGIONAL, 2019-2035 (USD BILLIONS)
    23. US PRECIPITATED SILICA MARKET SIZE ESTIMATES & FORECAST, BY PROCESS, 2019-2035 (USD BILLIONS)
    24. US PRECIPITATED SILICA MARKET SIZE ESTIMATES & FORECAST, BY SOURCE, 2019-2035 (USD BILLIONS)
    25. US PRECIPITATED SILICA MARKET SIZE ESTIMATES & FORECAST, BY GRADE, 2019-2035 (USD BILLIONS)
    26. US PRECIPITATED SILICA MARKET SIZE ESTIMATES & FORECAST, BY APPLICATION, 2019-2035 (USD BILLIONS)
    27. US PRECIPITATED SILICA MARKET SIZE ESTIMATES & FORECAST, BY END-USE, 2019-2035 (USD BILLIONS)
    28. US PRECIPITATED SILICA MARKET SIZE ESTIMATES & FORECAST, BY REGIONAL, 2019-2035 (USD BILLIONS)
    29. CANADA PRECIPITATED SILICA MARKET SIZE ESTIMATES & FORECAST, BY PROCESS, 2019-2035 (USD BILLIONS)
    30. CANADA PRECIPITATED SILICA MARKET SIZE ESTIMATES & FORECAST, BY SOURCE, 2019-2035 (USD BILLIONS)
    31. CANADA PRECIPITATED SILICA MARKET SIZE ESTIMATES & FORECAST, BY GRADE, 2019-2035 (USD BILLIONS)
    32. CANADA PRECIPITATED SILICA MARKET SIZE ESTIMATES & FORECAST, BY APPLICATION, 2019-2035 (USD BILLIONS)
    33. CANADA PRECIPITATED SILICA MARKET SIZE ESTIMATES & FORECAST, BY END-USE, 2019-2035 (USD BILLIONS)
    34. CANADA PRECIPITATED SILICA MARKET SIZE ESTIMATES & FORECAST, BY REGIONAL, 2019-2035 (USD BILLIONS)
    35. EUROPE PRECIPITATED SILICA MARKET SIZE ESTIMATES & FORECAST, BY PROCESS, 2019-2035 (USD BILLIONS)
    36. EUROPE PRECIPITATED SILICA MARKET SIZE ESTIMATES & FORECAST, BY SOURCE, 2019-2035 (USD BILLIONS)
    37. EUROPE PRECIPITATED SILICA MARKET SIZE ESTIMATES & FORECAST, BY GRADE, 2019-2035 (USD BILLIONS)
    38. EUROPE PRECIPITATED SILICA MARKET SIZE ESTIMATES & FORECAST, BY APPLICATION, 2019-2035 (USD BILLIONS)
    39. EUROPE PRECIPITATED SILICA MARKET SIZE ESTIMATES & FORECAST, BY END-USE, 2019-2035 (USD BILLIONS)
    40. EUROPE PRECIPITATED SILICA MARKET SIZE ESTIMATES & FORECAST, BY REGIONAL, 2019-2035 (USD BILLIONS)
    41. GERMANY PRECIPITATED SILICA MARKET SIZE ESTIMATES & FORECAST, BY PROCESS, 2019-2035 (USD BILLIONS)
    42. GERMANY PRECIPITATED SILICA MARKET SIZE ESTIMATES & FORECAST, BY SOURCE, 2019-2035 (USD BILLIONS)
    43. GERMANY PRECIPITATED SILICA MARKET SIZE ESTIMATES & FORECAST, BY GRADE, 2019-2035 (USD BILLIONS)
    44. GERMANY PRECIPITATED SILICA MARKET SIZE ESTIMATES & FORECAST, BY APPLICATION, 2019-2035 (USD BILLIONS)
    45. GERMANY PRECIPITATED SILICA MARKET SIZE ESTIMATES & FORECAST, BY END-USE, 2019-2035 (USD BILLIONS)
    46. GERMANY PRECIPITATED SILICA MARKET SIZE ESTIMATES & FORECAST, BY REGIONAL, 2019-2035 (USD BILLIONS)
    47. UK PRECIPITATED SILICA MARKET SIZE ESTIMATES & FORECAST, BY PROCESS, 2019-2035 (USD BILLIONS)
    48. UK PRECIPITATED SILICA MARKET SIZE ESTIMATES & FORECAST, BY SOURCE, 2019-2035 (USD BILLIONS)
    49. UK PRECIPITATED SILICA MARKET SIZE ESTIMATES & FORECAST, BY GRADE, 2019-2035 (USD BILLIONS)
    50. UK PRECIPITATED SILICA MARKET SIZE ESTIMATES & FORECAST, BY APPLICATION, 2019-2035 (USD BILLIONS)
    51. UK PRECIPITATED SILICA MARKET SIZE ESTIMATES & FORECAST, BY END-USE, 2019-2035 (USD BILLIONS)
    52. UK PRECIPITATED SILICA MARKET SIZE ESTIMATES & FORECAST, BY REGIONAL, 2019-2035 (USD BILLIONS)
    53. FRANCE PRECIPITATED SILICA MARKET SIZE ESTIMATES & FORECAST, BY PROCESS, 2019-2035 (USD BILLIONS)
    54. FRANCE PRECIPITATED SILICA MARKET SIZE ESTIMATES & FORECAST, BY SOURCE, 2019-2035 (USD BILLIONS)
    55. FRANCE PRECIPITATED SILICA MARKET SIZE ESTIMATES & FORECAST, BY GRADE, 2019-2035 (USD BILLIONS)
    56. FRANCE PRECIPITATED SILICA MARKET SIZE ESTIMATES & FORECAST, BY APPLICATION, 2019-2035 (USD BILLIONS)
    57. FRANCE PRECIPITATED SILICA MARKET SIZE ESTIMATES & FORECAST, BY END-USE, 2019-2035 (USD BILLIONS)
    58. FRANCE PRECIPITATED SILICA MARKET SIZE ESTIMATES & FORECAST, BY REGIONAL, 2019-2035 (USD BILLIONS)
    59. RUSSIA PRECIPITATED SILICA MARKET SIZE ESTIMATES & FORECAST, BY PROCESS, 2019-2035 (USD BILLIONS)
    60. RUSSIA PRECIPITATED SILICA MARKET SIZE ESTIMATES & FORECAST, BY SOURCE, 2019-2035 (USD BILLIONS)
    61. RUSSIA PRECIPITATED SILICA MARKET SIZE ESTIMATES & FORECAST, BY GRADE, 2019-2035 (USD BILLIONS)
    62. RUSSIA PRECIPITATED SILICA MARKET SIZE ESTIMATES & FORECAST, BY APPLICATION, 2019-2035 (USD BILLIONS)
    63. RUSSIA PRECIPITATED SILICA MARKET SIZE ESTIMATES & FORECAST, BY END-USE, 2019-2035 (USD BILLIONS)
    64. RUSSIA PRECIPITATED SILICA MARKET SIZE ESTIMATES & FORECAST, BY REGIONAL, 2019-2035 (USD BILLIONS)
    65. ITALY PRECIPITATED SILICA MARKET SIZE ESTIMATES & FORECAST, BY PROCESS, 2019-2035 (USD BILLIONS)
    66. ITALY PRECIPITATED SILICA MARKET SIZE ESTIMATES & FORECAST, BY SOURCE, 2019-2035 (USD BILLIONS)
    67. ITALY PRECIPITATED SILICA MARKET SIZE ESTIMATES & FORECAST, BY GRADE, 2019-2035 (USD BILLIONS)
    68. ITALY PRECIPITATED SILICA MARKET SIZE ESTIMATES & FORECAST, BY APPLICATION, 2019-2035 (USD BILLIONS)
    69. ITALY PRECIPITATED SILICA MARKET SIZE ESTIMATES & FORECAST, BY END-USE, 2019-2035 (USD BILLIONS)
    70. ITALY PRECIPITATED SILICA MARKET SIZE ESTIMATES & FORECAST, BY REGIONAL, 2019-2035 (USD BILLIONS)
    71. SPAIN PRECIPITATED SILICA MARKET SIZE ESTIMATES & FORECAST, BY PROCESS, 2019-2035 (USD BILLIONS)
    72. SPAIN PRECIPITATED SILICA MARKET SIZE ESTIMATES & FORECAST, BY SOURCE, 2019-2035 (USD BILLIONS)
    73. SPAIN PRECIPITATED SILICA MARKET SIZE ESTIMATES & FORECAST, BY GRADE, 2019-2035 (USD BILLIONS)
    74. SPAIN PRECIPITATED SILICA MARKET SIZE ESTIMATES & FORECAST, BY APPLICATION, 2019-2035 (USD BILLIONS)
    75. SPAIN PRECIPITATED SILICA MARKET SIZE ESTIMATES & FORECAST, BY END-USE, 2019-2035 (USD BILLIONS)
    76. SPAIN PRECIPITATED SILICA MARKET SIZE ESTIMATES & FORECAST, BY REGIONAL, 2019-2035 (USD BILLIONS)
    77. REST OF EUROPE PRECIPITATED SILICA MARKET SIZE ESTIMATES & FORECAST, BY PROCESS, 2019-2035 (USD BILLIONS)
    78. REST OF EUROPE PRECIPITATED SILICA MARKET SIZE ESTIMATES & FORECAST, BY SOURCE, 2019-2035 (USD BILLIONS)
    79. REST OF EUROPE PRECIPITATED SILICA MARKET SIZE ESTIMATES & FORECAST, BY GRADE, 2019-2035 (USD BILLIONS)
    80. REST OF EUROPE PRECIPITATED SILICA MARKET SIZE ESTIMATES & FORECAST, BY APPLICATION, 2019-2035 (USD BILLIONS)
    81. REST OF EUROPE PRECIPITATED SILICA MARKET SIZE ESTIMATES & FORECAST, BY END-USE, 2019-2035 (USD BILLIONS)
    82. REST OF EUROPE PRECIPITATED SILICA MARKET SIZE ESTIMATES & FORECAST, BY REGIONAL, 2019-2035 (USD BILLIONS)
    83. APAC PRECIPITATED SILICA MARKET SIZE ESTIMATES & FORECAST, BY PROCESS, 2019-2035 (USD BILLIONS)
    84. APAC PRECIPITATED SILICA MARKET SIZE ESTIMATES & FORECAST, BY SOURCE, 2019-2035 (USD BILLIONS)
    85. APAC PRECIPITATED SILICA MARKET SIZE ESTIMATES & FORECAST, BY GRADE, 2019-2035 (USD BILLIONS)
    86. APAC PRECIPITATED SILICA MARKET SIZE ESTIMATES & FORECAST, BY APPLICATION, 2019-2035 (USD BILLIONS)
    87. APAC PRECIPITATED SILICA MARKET SIZE ESTIMATES & FORECAST, BY END-USE, 2019-2035 (USD BILLIONS)
    88. APAC PRECIPITATED SILICA MARKET SIZE ESTIMATES & FORECAST, BY REGIONAL, 2019-2035 (USD BILLIONS)
    89. CHINA PRECIPITATED SILICA MARKET SIZE ESTIMATES & FORECAST, BY PROCESS, 2019-2035 (USD BILLIONS)
    90. CHINA PRECIPITATED SILICA MARKET SIZE ESTIMATES & FORECAST, BY SOURCE, 2019-2035 (USD BILLIONS)
    91. CHINA PRECIPITATED SILICA MARKET SIZE ESTIMATES & FORECAST, BY GRADE, 2019-2035 (USD BILLIONS)
    92. CHINA PRECIPITATED SILICA MARKET SIZE ESTIMATES & FORECAST, BY APPLICATION, 2019-2035 (USD BILLIONS)
    93. CHINA PRECIPITATED SILICA MARKET SIZE ESTIMATES & FORECAST, BY END-USE, 2019-2035 (USD BILLIONS)
    94. CHINA PRECIPITATED SILICA MARKET SIZE ESTIMATES & FORECAST, BY REGIONAL, 2019-2035 (USD BILLIONS)
    95. INDIA PRECIPITATED SILICA MARKET SIZE ESTIMATES & FORECAST, BY PROCESS, 2019-2035 (USD BILLIONS)
    96. INDIA PRECIPITATED SILICA MARKET SIZE ESTIMATES & FORECAST, BY SOURCE, 2019-2035 (USD BILLIONS)
    97. INDIA PRECIPITATED SILICA MARKET SIZE ESTIMATES & FORECAST, BY GRADE, 2019-2035 (USD BILLIONS)
    98. INDIA PRECIPITATED SILICA MARKET SIZE ESTIMATES & FORECAST, BY APPLICATION, 2019-2035 (USD BILLIONS)
    99. INDIA PRECIPITATED SILICA MARKET SIZE ESTIMATES & FORECAST, BY END-USE, 2019-2035 (USD BILLIONS)
    100. INDIA PRECIPITATED SILICA MARKET SIZE ESTIMATES & FORECAST, BY REGIONAL, 2019-2035 (USD BILLIONS)
    101. JAPAN PRECIPITATED SILICA MARKET SIZE ESTIMATES & FORECAST, BY PROCESS, 2019-2035 (USD BILLIONS)
    102. JAPAN PRECIPITATED SILICA MARKET SIZE ESTIMATES & FORECAST, BY SOURCE, 2019-2035 (USD BILLIONS)
    103. JAPAN PRECIPITATED SILICA MARKET SIZE ESTIMATES & FORECAST, BY GRADE, 2019-2035 (USD BILLIONS)
    104. JAPAN PRECIPITATED SILICA MARKET SIZE ESTIMATES & FORECAST, BY APPLICATION, 2019-2035 (USD BILLIONS)
    105. JAPAN PRECIPITATED SILICA MARKET SIZE ESTIMATES & FORECAST, BY END-USE, 2019-2035 (USD BILLIONS)
    106. JAPAN PRECIPITATED SILICA MARKET SIZE ESTIMATES & FORECAST, BY REGIONAL, 2019-2035 (USD BILLIONS)
    107. SOUTH KOREA PRECIPITATED SILICA MARKET SIZE ESTIMATES & FORECAST, BY PROCESS, 2019-2035 (USD BILLIONS)
    108. SOUTH KOREA PRECIPITATED SILICA MARKET SIZE ESTIMATES & FORECAST, BY SOURCE, 2019-2035 (USD BILLIONS)
    109. SOUTH KOREA PRECIPITATED SILICA MARKET SIZE ESTIMATES & FORECAST, BY GRADE, 2019-2035 (USD BILLIONS)
    110. SOUTH KOREA PRECIPITATED SILICA MARKET SIZE ESTIMATES & FORECAST, BY APPLICATION, 2019-2035 (USD BILLIONS)
    111. SOUTH KOREA PRECIPITATED SILICA MARKET SIZE ESTIMATES & FORECAST, BY END-USE, 2019-2035 (USD BILLIONS)
    112. SOUTH KOREA PRECIPITATED SILICA MARKET SIZE ESTIMATES & FORECAST, BY REGIONAL, 2019-2035 (USD BILLIONS)
    113. MALAYSIA PRECIPITATED SILICA MARKET SIZE ESTIMATES & FORECAST, BY PROCESS, 2019-2035 (USD BILLIONS)
    114. MALAYSIA PRECIPITATED SILICA MARKET SIZE ESTIMATES & FORECAST, BY SOURCE, 2019-2035 (USD BILLIONS)
    115. MALAYSIA PRECIPITATED SILICA MARKET SIZE ESTIMATES & FORECAST, BY GRADE, 2019-2035 (USD BILLIONS)
    116. MALAYSIA PRECIPITATED SILICA MARKET SIZE ESTIMATES & FORECAST, BY APPLICATION, 2019-2035 (USD BILLIONS)
    117. MALAYSIA PRECIPITATED SILICA MARKET SIZE ESTIMATES & FORECAST, BY END-USE, 2019-2035 (USD BILLIONS)
    118. MALAYSIA PRECIPITATED SILICA MARKET SIZE ESTIMATES & FORECAST, BY REGIONAL, 2019-2035 (USD BILLIONS)
    119. THAILAND PRECIPITATED SILICA MARKET SIZE ESTIMATES & FORECAST, BY PROCESS, 2019-2035 (USD BILLIONS)
    120. THAILAND PRECIPITATED SILICA MARKET SIZE ESTIMATES & FORECAST, BY SOURCE, 2019-2035 (USD BILLIONS)
    121. THAILAND PRECIPITATED SILICA MARKET SIZE ESTIMATES & FORECAST, BY GRADE, 2019-2035 (USD BILLIONS)
    122. THAILAND PRECIPITATED SILICA MARKET SIZE ESTIMATES & FORECAST, BY APPLICATION, 2019-2035 (USD BILLIONS)
    123. THAILAND PRECIPITATED SILICA MARKET SIZE ESTIMATES & FORECAST, BY END-USE, 2019-2035 (USD BILLIONS)
    124. THAILAND PRECIPITATED SILICA MARKET SIZE ESTIMATES & FORECAST, BY REGIONAL, 2019-2035 (USD BILLIONS)
    125. INDONESIA PRECIPITATED SILICA MARKET SIZE ESTIMATES & FORECAST, BY PROCESS, 2019-2035 (USD BILLIONS)
    126. INDONESIA PRECIPITATED SILICA MARKET SIZE ESTIMATES & FORECAST, BY SOURCE, 2019-2035 (USD BILLIONS)
    127. INDONESIA PRECIPITATED SILICA MARKET SIZE ESTIMATES & FORECAST, BY GRADE, 2019-2035 (USD BILLIONS)
    128. INDONESIA PRECIPITATED SILICA MARKET SIZE ESTIMATES & FORECAST, BY APPLICATION, 2019-2035 (USD BILLIONS)
    129. INDONESIA PRECIPITATED SILICA MARKET SIZE ESTIMATES & FORECAST, BY END-USE, 2019-2035 (USD BILLIONS)
    130. INDONESIA PRECIPITATED SILICA MARKET SIZE ESTIMATES & FORECAST, BY REGIONAL, 2019-2035 (USD BILLIONS)
    131. REST OF APAC PRECIPITATED SILICA MARKET SIZE ESTIMATES & FORECAST, BY PROCESS, 2019-2035 (USD BILLIONS)
    132. REST OF APAC PRECIPITATED SILICA MARKET SIZE ESTIMATES & FORECAST, BY SOURCE, 2019-2035 (USD BILLIONS)
    133. REST OF APAC PRECIPITATED SILICA MARKET SIZE ESTIMATES & FORECAST, BY GRADE, 2019-2035 (USD BILLIONS)
    134. REST OF APAC PRECIPITATED SILICA MARKET SIZE ESTIMATES & FORECAST, BY APPLICATION, 2019-2035 (USD BILLIONS)
    135. REST OF APAC PRECIPITATED SILICA MARKET SIZE ESTIMATES & FORECAST, BY END-USE, 2019-2035 (USD BILLIONS)
    136. REST OF APAC PRECIPITATED SILICA MARKET SIZE ESTIMATES & FORECAST, BY REGIONAL, 2019-2035 (USD BILLIONS)
    137. SOUTH AMERICA PRECIPITATED SILICA MARKET SIZE ESTIMATES & FORECAST, BY PROCESS, 2019-2035 (USD BILLIONS)
    138. SOUTH AMERICA PRECIPITATED SILICA MARKET SIZE ESTIMATES & FORECAST, BY SOURCE, 2019-2035 (USD BILLIONS)
    139. SOUTH AMERICA PRECIPITATED SILICA MARKET SIZE ESTIMATES & FORECAST, BY GRADE, 2019-2035 (USD BILLIONS)
    140. SOUTH AMERICA PRECIPITATED SILICA MARKET SIZE ESTIMATES & FORECAST, BY APPLICATION, 2019-2035 (USD BILLIONS)
    141. SOUTH AMERICA PRECIPITATED SILICA MARKET SIZE ESTIMATES & FORECAST, BY END-USE, 2019-2035 (USD BILLIONS)
    142. SOUTH AMERICA PRECIPITATED SILICA MARKET SIZE ESTIMATES & FORECAST, BY REGIONAL, 2019-2035 (USD BILLIONS)
    143. BRAZIL PRECIPITATED SILICA MARKET SIZE ESTIMATES & FORECAST, BY PROCESS, 2019-2035 (USD BILLIONS)
    144. BRAZIL PRECIPITATED SILICA MARKET SIZE ESTIMATES & FORECAST, BY SOURCE, 2019-2035 (USD BILLIONS)
    145. BRAZIL PRECIPITATED SILICA MARKET SIZE ESTIMATES & FORECAST, BY GRADE, 2019-2035 (USD BILLIONS)
    146. BRAZIL PRECIPITATED SILICA MARKET SIZE ESTIMATES & FORECAST, BY APPLICATION, 2019-2035 (USD BILLIONS)
    147. BRAZIL PRECIPITATED SILICA MARKET SIZE ESTIMATES & FORECAST, BY END-USE, 2019-2035 (USD BILLIONS)
    148. BRAZIL PRECIPITATED SILICA MARKET SIZE ESTIMATES & FORECAST, BY REGIONAL, 2019-2035 (USD BILLIONS)
    149. MEXICO PRECIPITATED SILICA MARKET SIZE ESTIMATES & FORECAST, BY PROCESS, 2019-2035 (USD BILLIONS)
    150. MEXICO PRECIPITATED SILICA MARKET SIZE ESTIMATES & FORECAST, BY SOURCE, 2019-2035 (USD BILLIONS)
    151. MEXICO PRECIPITATED SILICA MARKET SIZE ESTIMATES & FORECAST, BY GRADE, 2019-2035 (USD BILLIONS)
    152. MEXICO PRECIPITATED SILICA MARKET SIZE ESTIMATES & FORECAST, BY APPLICATION, 2019-2035 (USD BILLIONS)
    153. MEXICO PRECIPITATED SILICA MARKET SIZE ESTIMATES & FORECAST, BY END-USE, 2019-2035 (USD BILLIONS)
    154. MEXICO PRECIPITATED SILICA MARKET SIZE ESTIMATES & FORECAST, BY REGIONAL, 2019-2035 (USD BILLIONS)
    155. ARGENTINA PRECIPITATED SILICA MARKET SIZE ESTIMATES & FORECAST, BY PROCESS, 2019-2035 (USD BILLIONS)
    156. ARGENTINA PRECIPITATED SILICA MARKET SIZE ESTIMATES & FORECAST, BY SOURCE, 2019-2035 (USD BILLIONS)
    157. ARGENTINA PRECIPITATED SILICA MARKET SIZE ESTIMATES & FORECAST, BY GRADE, 2019-2035 (USD BILLIONS)
    158. ARGENTINA PRECIPITATED SILICA MARKET SIZE ESTIMATES & FORECAST, BY APPLICATION, 2019-2035 (USD BILLIONS)
    159. ARGENTINA PRECIPITATED SILICA MARKET SIZE ESTIMATES & FORECAST, BY END-USE, 2019-2035 (USD BILLIONS)
    160. ARGENTINA PRECIPITATED SILICA MARKET SIZE ESTIMATES & FORECAST, BY REGIONAL, 2019-2035 (USD BILLIONS)
    161. REST OF SOUTH AMERICA PRECIPITATED SILICA MARKET SIZE ESTIMATES & FORECAST, BY PROCESS, 2019-2035 (USD BILLIONS)
    162. REST OF SOUTH AMERICA PRECIPITATED SILICA MARKET SIZE ESTIMATES & FORECAST, BY SOURCE, 2019-2035 (USD BILLIONS)
    163. REST OF SOUTH AMERICA PRECIPITATED SILICA MARKET SIZE ESTIMATES & FORECAST, BY GRADE, 2019-2035 (USD BILLIONS)
    164. REST OF SOUTH AMERICA PRECIPITATED SILICA MARKET SIZE ESTIMATES & FORECAST, BY APPLICATION, 2019-2035 (USD BILLIONS)
    165. REST OF SOUTH AMERICA PRECIPITATED SILICA MARKET SIZE ESTIMATES & FORECAST, BY END-USE, 2019-2035 (USD BILLIONS)
    166. REST OF SOUTH AMERICA PRECIPITATED SILICA MARKET SIZE ESTIMATES & FORECAST, BY REGIONAL, 2019-2035 (USD BILLIONS)
    167. MEA PRECIPITATED SILICA MARKET SIZE ESTIMATES & FORECAST, BY PROCESS, 2019-2035 (USD BILLIONS)
    168. MEA PRECIPITATED SILICA MARKET SIZE ESTIMATES & FORECAST, BY SOURCE, 2019-2035 (USD BILLIONS)
    169. MEA PRECIPITATED SILICA MARKET SIZE ESTIMATES & FORECAST, BY GRADE, 2019-2035 (USD BILLIONS)
    170. MEA PRECIPITATED SILICA MARKET SIZE ESTIMATES & FORECAST, BY APPLICATION, 2019-2035 (USD BILLIONS)
    171. MEA PRECIPITATED SILICA MARKET SIZE ESTIMATES & FORECAST, BY END-USE, 2019-2035 (USD BILLIONS)
    172. MEA PRECIPITATED SILICA MARKET SIZE ESTIMATES & FORECAST, BY REGIONAL, 2019-2035 (USD BILLIONS)
    173. GCC COUNTRIES PRECIPITATED SILICA MARKET SIZE ESTIMATES & FORECAST, BY PROCESS, 2019-2035 (USD BILLIONS)
    174. GCC COUNTRIES PRECIPITATED SILICA MARKET SIZE ESTIMATES & FORECAST, BY SOURCE, 2019-2035 (USD BILLIONS)
    175. GCC COUNTRIES PRECIPITATED SILICA MARKET SIZE ESTIMATES & FORECAST, BY GRADE, 2019-2035 (USD BILLIONS)
    176. GCC COUNTRIES PRECIPITATED SILICA MARKET SIZE ESTIMATES & FORECAST, BY APPLICATION, 2019-2035 (USD BILLIONS)
    177. GCC COUNTRIES PRECIPITATED SILICA MARKET SIZE ESTIMATES & FORECAST, BY END-USE, 2019-2035 (USD BILLIONS)
    178. GCC COUNTRIES PRECIPITATED SILICA MARKET SIZE ESTIMATES & FORECAST, BY REGIONAL, 2019-2035 (USD BILLIONS)
    179. SOUTH AFRICA PRECIPITATED SILICA MARKET SIZE ESTIMATES & FORECAST, BY PROCESS, 2019-2035 (USD BILLIONS)
    180. SOUTH AFRICA PRECIPITATED SILICA MARKET SIZE ESTIMATES & FORECAST, BY SOURCE, 2019-2035 (USD BILLIONS)
    181. SOUTH AFRICA PRECIPITATED SILICA MARKET SIZE ESTIMATES & FORECAST, BY GRADE, 2019-2035 (USD BILLIONS)
    182. SOUTH AFRICA PRECIPITATED SILICA MARKET SIZE ESTIMATES & FORECAST, BY APPLICATION, 2019-2035 (USD BILLIONS)
    183. SOUTH AFRICA PRECIPITATED SILICA MARKET SIZE ESTIMATES & FORECAST, BY END-USE, 2019-2035 (USD BILLIONS)
    184. SOUTH AFRICA PRECIPITATED SILICA MARKET SIZE ESTIMATES & FORECAST, BY REGIONAL, 2019-2035 (USD BILLIONS)
    185. REST OF MEA PRECIPITATED SILICA MARKET SIZE ESTIMATES & FORECAST, BY PROCESS, 2019-2035 (USD BILLIONS)
    186. REST OF MEA PRECIPITATED SILICA MARKET SIZE ESTIMATES & FORECAST, BY SOURCE, 2019-2035 (USD BILLIONS)
    187. REST OF MEA PRECIPITATED SILICA MARKET SIZE ESTIMATES & FORECAST, BY GRADE, 2019-2035 (USD BILLIONS)
    188. REST OF MEA PRECIPITATED SILICA MARKET SIZE ESTIMATES & FORECAST, BY APPLICATION, 2019-2035 (USD BILLIONS)
    189. REST OF MEA PRECIPITATED SILICA MARKET SIZE ESTIMATES & FORECAST, BY END-USE, 2019-2035 (USD BILLIONS)
    190. REST OF MEA PRECIPITATED SILICA MARKET SIZE ESTIMATES & FORECAST, BY REGIONAL, 2019-2035 (USD BILLIONS)
    191. PRODUCT LAUNCH/PRODUCT DEVELOPMENT/APPROVAL
    192. ACQUISITION/PARTNERSHIP
      1. \r\n
    193. LIST OF FIGURES
      1. \r\n
    194. MARKET SYNOPSIS
    195. NORTH AMERICA PRECIPITATED SILICA MARKET ANALYSIS
    196. US PRECIPITATED SILICA MARKET ANALYSIS BY PROCESS
    197. US PRECIPITATED SILICA MARKET ANALYSIS BY SOURCE
    198. US PRECIPITATED SILICA MARKET ANALYSIS BY GRADE
    199. US PRECIPITATED SILICA MARKET ANALYSIS BY APPLICATION
    200. US PRECIPITATED SILICA MARKET ANALYSIS BY END-USE
    201. US PRECIPITATED SILICA MARKET ANALYSIS BY REGIONAL
    202. CANADA PRECIPITATED SILICA MARKET ANALYSIS BY PROCESS
    203. CANADA PRECIPITATED SILICA MARKET ANALYSIS BY SOURCE
    204. CANADA PRECIPITATED SILICA MARKET ANALYSIS BY GRADE
    205. CANADA PRECIPITATED SILICA MARKET ANALYSIS BY APPLICATION
    206. CANADA PRECIPITATED SILICA MARKET ANALYSIS BY END-USE
    207. CANADA PRECIPITATED SILICA MARKET ANALYSIS BY REGIONAL
    208. EUROPE PRECIPITATED SILICA MARKET ANALYSIS
    209. GERMANY PRECIPITATED SILICA MARKET ANALYSIS BY PROCESS
    210. GERMANY PRECIPITATED SILICA MARKET ANALYSIS BY SOURCE
    211. GERMANY PRECIPITATED SILICA MARKET ANALYSIS BY GRADE
    212. GERMANY PRECIPITATED SILICA MARKET ANALYSIS BY APPLICATION
    213. GERMANY PRECIPITATED SILICA MARKET ANALYSIS BY END-USE
    214. GERMANY PRECIPITATED SILICA MARKET ANALYSIS BY REGIONAL
    215. UK PRECIPITATED SILICA MARKET ANALYSIS BY PROCESS
    216. UK PRECIPITATED SILICA MARKET ANALYSIS BY SOURCE
    217. UK PRECIPITATED SILICA MARKET ANALYSIS BY GRADE
    218. UK PRECIPITATED SILICA MARKET ANALYSIS BY APPLICATION
    219. UK PRECIPITATED SILICA MARKET ANALYSIS BY END-USE
    220. UK PRECIPITATED SILICA MARKET ANALYSIS BY REGIONAL
    221. FRANCE PRECIPITATED SILICA MARKET ANALYSIS BY PROCESS
    222. FRANCE PRECIPITATED SILICA MARKET ANALYSIS BY SOURCE
    223. FRANCE PRECIPITATED SILICA MARKET ANALYSIS BY GRADE
    224. FRANCE PRECIPITATED SILICA MARKET ANALYSIS BY APPLICATION
    225. FRANCE PRECIPITATED SILICA MARKET ANALYSIS BY END-USE
    226. FRANCE PRECIPITATED SILICA MARKET ANALYSIS BY REGIONAL
    227. RUSSIA PRECIPITATED SILICA MARKET ANALYSIS BY PROCESS
    228. RUSSIA PRECIPITATED SILICA MARKET ANALYSIS BY SOURCE
    229. RUSSIA PRECIPITATED SILICA MARKET ANALYSIS BY GRADE
    230. RUSSIA PRECIPITATED SILICA MARKET ANALYSIS BY APPLICATION
    231. RUSSIA PRECIPITATED SILICA MARKET ANALYSIS BY END-USE
    232. RUSSIA PRECIPITATED SILICA MARKET ANALYSIS BY REGIONAL
    233. ITALY PRECIPITATED SILICA MARKET ANALYSIS BY PROCESS
    234. ITALY PRECIPITATED SILICA MARKET ANALYSIS BY SOURCE
    235. ITALY PRECIPITATED SILICA MARKET ANALYSIS BY GRADE
    236. ITALY PRECIPITATED SILICA MARKET ANALYSIS BY APPLICATION
    237. ITALY PRECIPITATED SILICA MARKET ANALYSIS BY END-USE
    238. ITALY PRECIPITATED SILICA MARKET ANALYSIS BY REGIONAL
    239. SPAIN PRECIPITATED SILICA MARKET ANALYSIS BY PROCESS
    240. SPAIN PRECIPITATED SILICA MARKET ANALYSIS BY SOURCE
    241. SPAIN PRECIPITATED SILICA MARKET ANALYSIS BY GRADE
    242. SPAIN PRECIPITATED SILICA MARKET ANALYSIS BY APPLICATION
    243. SPAIN PRECIPITATED SILICA MARKET ANALYSIS BY END-USE
    244. SPAIN PRECIPITATED SILICA MARKET ANALYSIS BY REGIONAL
    245. REST OF EUROPE PRECIPITATED SILICA MARKET ANALYSIS BY PROCESS
    246. REST OF EUROPE PRECIPITATED SILICA MARKET ANALYSIS BY SOURCE
    247. REST OF EUROPE PRECIPITATED SILICA MARKET ANALYSIS BY GRADE
    248. REST OF EUROPE PRECIPITATED SILICA MARKET ANALYSIS BY APPLICATION
    249. REST OF EUROPE PRECIPITATED SILICA MARKET ANALYSIS BY END-USE
    250. REST OF EUROPE PRECIPITATED SILICA MARKET ANALYSIS BY REGIONAL
    251. APAC PRECIPITATED SILICA MARKET ANALYSIS
    252. CHINA PRECIPITATED SILICA MARKET ANALYSIS BY PROCESS
    253. CHINA PRECIPITATED SILICA MARKET ANALYSIS BY SOURCE
    254. CHINA PRECIPITATED SILICA MARKET ANALYSIS BY GRADE
    255. CHINA PRECIPITATED SILICA MARKET ANALYSIS BY APPLICATION
    256. CHINA PRECIPITATED SILICA MARKET ANALYSIS BY END-USE
    257. CHINA PRECIPITATED SILICA MARKET ANALYSIS BY REGIONAL
    258. INDIA PRECIPITATED SILICA MARKET ANALYSIS BY PROCESS
    259. INDIA PRECIPITATED SILICA MARKET ANALYSIS BY SOURCE
    260. INDIA PRECIPITATED SILICA MARKET ANALYSIS BY GRADE
    261. INDIA PRECIPITATED SILICA MARKET ANALYSIS BY APPLICATION
    262. INDIA PRECIPITATED SILICA MARKET ANALYSIS BY END-USE
    263. INDIA PRECIPITATED SILICA MARKET ANALYSIS BY REGIONAL
    264. JAPAN PRECIPITATED SILICA MARKET ANALYSIS BY PROCESS
    265. JAPAN PRECIPITATED SILICA MARKET ANALYSIS BY SOURCE
    266. JAPAN PRECIPITATED SILICA MARKET ANALYSIS BY GRADE
    267. JAPAN PRECIPITATED SILICA MARKET ANALYSIS BY APPLICATION
    268. JAPAN PRECIPITATED SILICA MARKET ANALYSIS BY END-USE
    269. JAPAN PRECIPITATED SILICA MARKET ANALYSIS BY REGIONAL
    270. SOUTH KOREA PRECIPITATED SILICA MARKET ANALYSIS BY PROCESS
    271. SOUTH KOREA PRECIPITATED SILICA MARKET ANALYSIS BY SOURCE
    272. SOUTH KOREA PRECIPITATED SILICA MARKET ANALYSIS BY GRADE
    273. SOUTH KOREA PRECIPITATED SILICA MARKET ANALYSIS BY APPLICATION
    274. SOUTH KOREA PRECIPITATED SILICA MARKET ANALYSIS BY END-USE
    275. SOUTH KOREA PRECIPITATED SILICA MARKET ANALYSIS BY REGIONAL
    276. MALAYSIA PRECIPITATED SILICA MARKET ANALYSIS BY PROCESS
    277. MALAYSIA PRECIPITATED SILICA MARKET ANALYSIS BY SOURCE
    278. MALAYSIA PRECIPITATED SILICA MARKET ANALYSIS BY GRADE
    279. MALAYSIA PRECIPITATED SILICA MARKET ANALYSIS BY APPLICATION
    280. MALAYSIA PRECIPITATED SILICA MARKET ANALYSIS BY END-USE
    281. MALAYSIA PRECIPITATED SILICA MARKET ANALYSIS BY REGIONAL
    282. THAILAND PRECIPITATED SILICA MARKET ANALYSIS BY PROCESS
    283. THAILAND PRECIPITATED SILICA MARKET ANALYSIS BY SOURCE
    284. THAILAND PRECIPITATED SILICA MARKET ANALYSIS BY GRADE
    285. THAILAND PRECIPITATED SILICA MARKET ANALYSIS BY APPLICATION
    286. THAILAND PRECIPITATED SILICA MARKET ANALYSIS BY END-USE
    287. THAILAND PRECIPITATED SILICA MARKET ANALYSIS BY REGIONAL
    288. INDONESIA PRECIPITATED SILICA MARKET ANALYSIS BY PROCESS
    289. INDONESIA PRECIPITATED SILICA MARKET ANALYSIS BY SOURCE
    290. INDONESIA PRECIPITATED SILICA MARKET ANALYSIS BY GRADE
    291. INDONESIA PRECIPITATED SILICA MARKET ANALYSIS BY APPLICATION
    292. INDONESIA PRECIPITATED SILICA MARKET ANALYSIS BY END-USE
    293. INDONESIA PRECIPITATED SILICA MARKET ANALYSIS BY REGIONAL
    294. REST OF APAC PRECIPITATED SILICA MARKET ANALYSIS BY PROCESS
    295. REST OF APAC PRECIPITATED SILICA MARKET ANALYSIS BY SOURCE
    296. REST OF APAC PRECIPITATED SILICA MARKET ANALYSIS BY GRADE
    297. REST OF APAC PRECIPITATED SILICA MARKET ANALYSIS BY APPLICATION
    298. REST OF APAC PRECIPITATED SILICA MARKET ANALYSIS BY END-USE
    299. REST OF APAC PRECIPITATED SILICA MARKET ANALYSIS BY REGIONAL
    300. SOUTH AMERICA PRECIPITATED SILICA MARKET ANALYSIS
    301. BRAZIL PRECIPITATED SILICA MARKET ANALYSIS BY PROCESS
    302. BRAZIL PRECIPITATED SILICA MARKET ANALYSIS BY SOURCE
    303. BRAZIL PRECIPITATED SILICA MARKET ANALYSIS BY GRADE
    304. BRAZIL PRECIPITATED SILICA MARKET ANALYSIS BY APPLICATION
    305. BRAZIL PRECIPITATED SILICA MARKET ANALYSIS BY END-USE
    306. BRAZIL PRECIPITATED SILICA MARKET ANALYSIS BY REGIONAL
    307. MEXICO PRECIPITATED SILICA MARKET ANALYSIS BY PROCESS
    308. MEXICO PRECIPITATED SILICA MARKET ANALYSIS BY SOURCE
    309. MEXICO PRECIPITATED SILICA MARKET ANALYSIS BY GRADE
    310. MEXICO PRECIPITATED SILICA MARKET ANALYSIS BY APPLICATION
    311. MEXICO PRECIPITATED SILICA MARKET ANALYSIS BY END-USE
    312. MEXICO PRECIPITATED SILICA MARKET ANALYSIS BY REGIONAL
    313. ARGENTINA PRECIPITATED SILICA MARKET ANALYSIS BY PROCESS
    314. ARGENTINA PRECIPITATED SILICA MARKET ANALYSIS BY SOURCE
    315. ARGENTINA PRECIPITATED SILICA MARKET ANALYSIS BY GRADE
    316. ARGENTINA PRECIPITATED SILICA MARKET ANALYSIS BY APPLICATION
    317. ARGENTINA PRECIPITATED SILICA MARKET ANALYSIS BY END-USE
    318. ARGENTINA PRECIPITATED SILICA MARKET ANALYSIS BY REGIONAL
    319. REST OF SOUTH AMERICA PRECIPITATED SILICA MARKET ANALYSIS BY PROCESS
    320. REST OF SOUTH AMERICA PRECIPITATED SILICA MARKET ANALYSIS BY SOURCE
    321. REST OF SOUTH AMERICA PRECIPITATED SILICA MARKET ANALYSIS BY GRADE
    322. REST OF SOUTH AMERICA PRECIPITATED SILICA MARKET ANALYSIS BY APPLICATION
    323. REST OF SOUTH AMERICA PRECIPITATED SILICA MARKET ANALYSIS BY END-USE
    324. REST OF SOUTH AMERICA PRECIPITATED SILICA MARKET ANALYSIS BY REGIONAL
    325. MEA PRECIPITATED SILICA MARKET ANALYSIS
    326. GCC COUNTRIES PRECIPITATED SILICA MARKET ANALYSIS BY PROCESS
    327. GCC COUNTRIES PRECIPITATED SILICA MARKET ANALYSIS BY SOURCE
    328. GCC COUNTRIES PRECIPITATED SILICA MARKET ANALYSIS BY GRADE
    329. GCC COUNTRIES PRECIPITATED SILICA MARKET ANALYSIS BY APPLICATION
    330. GCC COUNTRIES PRECIPITATED SILICA MARKET ANALYSIS BY END-USE
    331. GCC COUNTRIES PRECIPITATED SILICA MARKET ANALYSIS BY REGIONAL
    332. SOUTH AFRICA PRECIPITATED SILICA MARKET ANALYSIS BY PROCESS
    333. SOUTH AFRICA PRECIPITATED SILICA MARKET ANALYSIS BY SOURCE
    334. SOUTH AFRICA PRECIPITATED SILICA MARKET ANALYSIS BY GRADE
    335. SOUTH AFRICA PRECIPITATED SILICA MARKET ANALYSIS BY APPLICATION
    336. SOUTH AFRICA PRECIPITATED SILICA MARKET ANALYSIS BY END-USE
    337. SOUTH AFRICA PRECIPITATED SILICA MARKET ANALYSIS BY REGIONAL
    338. REST OF MEA PRECIPITATED SILICA MARKET ANALYSIS BY PROCESS
    339. REST OF MEA PRECIPITATED SILICA MARKET ANALYSIS BY SOURCE
    340. REST OF MEA PRECIPITATED SILICA MARKET ANALYSIS BY GRADE
    341. REST OF MEA PRECIPITATED SILICA MARKET ANALYSIS BY APPLICATION
    342. REST OF MEA PRECIPITATED SILICA MARKET ANALYSIS BY END-USE
    343. REST OF MEA PRECIPITATED SILICA MARKET ANALYSIS BY REGIONAL
    344. KEY BUYING CRITERIA OF PRECIPITATED SILICA MARKET
    345. RESEARCH PROCESS OF MRFR
    346. DRO ANALYSIS OF PRECIPITATED SILICA MARKET
    347. DRIVERS IMPACT ANALYSIS: PRECIPITATED SILICA MARKET
    348. RESTRAINTS IMPACT ANALYSIS: PRECIPITATED SILICA MARKET
    349. SUPPLY / VALUE CHAIN: PRECIPITATED SILICA MARKET
    350. PRECIPITATED SILICA MARKET, BY PROCESS, 2025 (% SHARE)
    351. PRECIPITATED SILICA MARKET, BY PROCESS, 2019 TO 2035 (USD Billions)
    352. PRECIPITATED SILICA MARKET, BY SOURCE, 2025 (% SHARE)
    353. PRECIPITATED SILICA MARKET, BY SOURCE, 2019 TO 2035 (USD Billions)
    354. PRECIPITATED SILICA MARKET, BY GRADE, 2025 (% SHARE)
    355. PRECIPITATED SILICA MARKET, BY GRADE, 2019 TO 2035 (USD Billions)
    356. PRECIPITATED SILICA MARKET, BY APPLICATION, 2025 (% SHARE)
    357. PRECIPITATED SILICA MARKET, BY APPLICATION, 2019 TO 2035 (USD Billions)
    358. PRECIPITATED SILICA MARKET, BY END-USE, 2025 (% SHARE)
    359. PRECIPITATED SILICA MARKET, BY END-USE, 2019 TO 2035 (USD Billions)
    360. PRECIPITATED SILICA MARKET, BY REGIONAL, 2025 (% SHARE)
    361. PRECIPITATED SILICA MARKET, BY REGIONAL, 2019 TO 2035 (USD Billions)
    362. BENCHMARKING OF MAJOR COMPETITORS

    Precipitated Silica Market Segmentation


    Precipitated Silica Market By Application (USD Billion, 2019-2035)

    Rubber

    Plastics

    Coatings

    Food and Feed

    Pharmaceuticals


    Precipitated Silica Market By Form (USD Billion, 2019-2035)

    Granulated

    Powder

    Colloidal


    Precipitated Silica Market By End Use (USD Billion, 2019-2035)

    Automotive

    Construction

    Electronics

    Healthcare

    Consumer Goods


    Precipitated Silica Market By Type (USD Billion, 2019-2035)

    Synthetic Silica

    Natural Silica


    Precipitated Silica Market By Regional (USD Billion, 2019-2035)

    North America

    Europe

    South America

    Asia Pacific

    Middle East and Africa


    Precipitated Silica Market Regional Outlook (USD Billion, 2019-2035)


    North America Outlook (USD Billion, 2019-2035)

    North America Precipitated Silica Market by Application Type

    Rubber

    Plastics

    Coatings

    Food and Feed

    Pharmaceuticals

    North America Precipitated Silica Market by Form Type

    Granulated

    Powder

    Colloidal

    North America Precipitated Silica Market by End Use Type

    Automotive

    Construction

    Electronics

    Healthcare

    Consumer Goods

    North America Precipitated Silica Market by Type

    Synthetic Silica

    Natural Silica

    North America Precipitated Silica Market by Regional Type

    US

    Canada

    US Outlook (USD Billion, 2019-2035)

    US Precipitated Silica Market by Application Type

    Rubber

    Plastics

    Coatings

    Food and Feed

    Pharmaceuticals

    US Precipitated Silica Market by Form Type

    Granulated

    Powder

    Colloidal

    US Precipitated Silica Market by End Use Type

    Automotive

    Construction

    Electronics

    Healthcare

    Consumer Goods

    US Precipitated Silica Market by Type

    Synthetic Silica

    Natural Silica

    CANADA Outlook (USD Billion, 2019-2035)

    CANADA Precipitated Silica Market by Application Type

    Rubber

    Plastics

    Coatings

    Food and Feed

    Pharmaceuticals

    CANADA Precipitated Silica Market by Form Type

    Granulated

    Powder

    Colloidal

    CANADA Precipitated Silica Market by End Use Type

    Automotive

    Construction

    Electronics

    Healthcare

    Consumer Goods

    CANADA Precipitated Silica Market by Type

    Synthetic Silica

    Natural Silica

    Europe Outlook (USD Billion, 2019-2035)

    Europe Precipitated Silica Market by Application Type

    Rubber

    Plastics

    Coatings

    Food and Feed

    Pharmaceuticals

    Europe Precipitated Silica Market by Form Type

    Granulated

    Powder

    Colloidal

    Europe Precipitated Silica Market by End Use Type

    Automotive

    Construction

    Electronics

    Healthcare

    Consumer Goods

    Europe Precipitated Silica Market by Type

    Synthetic Silica

    Natural Silica

    Europe Precipitated Silica Market by Regional Type

    Germany

    UK

    France

    Russia

    Italy

    Spain

    Rest of Europe

    GERMANY Outlook (USD Billion, 2019-2035)

    GERMANY Precipitated Silica Market by Application Type

    Rubber

    Plastics

    Coatings

    Food and Feed

    Pharmaceuticals

    GERMANY Precipitated Silica Market by Form Type

    Granulated

    Powder

    Colloidal

    GERMANY Precipitated Silica Market by End Use Type

    Automotive

    Construction

    Electronics

    Healthcare

    Consumer Goods

    GERMANY Precipitated Silica Market by Type

    Synthetic Silica

    Natural Silica

    UK Outlook (USD Billion, 2019-2035)

    UK Precipitated Silica Market by Application Type

    Rubber

    Plastics

    Coatings

    Food and Feed

    Pharmaceuticals

    UK Precipitated Silica Market by Form Type

    Granulated

    Powder

    Colloidal

    UK Precipitated Silica Market by End Use Type

    Automotive

    Construction

    Electronics

    Healthcare

    Consumer Goods

    UK Precipitated Silica Market by Type

    Synthetic Silica

    Natural Silica

    FRANCE Outlook (USD Billion, 2019-2035)

    FRANCE Precipitated Silica Market by Application Type

    Rubber

    Plastics

    Coatings

    Food and Feed

    Pharmaceuticals

    FRANCE Precipitated Silica Market by Form Type

    Granulated

    Powder

    Colloidal

    FRANCE Precipitated Silica Market by End Use Type

    Automotive

    Construction

    Electronics

    Healthcare

    Consumer Goods

    FRANCE Precipitated Silica Market by Type

    Synthetic Silica

    Natural Silica

    RUSSIA Outlook (USD Billion, 2019-2035)

    RUSSIA Precipitated Silica Market by Application Type

    Rubber

    Plastics

    Coatings

    Food and Feed

    Pharmaceuticals

    RUSSIA Precipitated Silica Market by Form Type

    Granulated

    Powder

    Colloidal

    RUSSIA Precipitated Silica Market by End Use Type

    Automotive

    Construction

    Electronics

    Healthcare

    Consumer Goods

    RUSSIA Precipitated Silica Market by Type

    Synthetic Silica

    Natural Silica

    ITALY Outlook (USD Billion, 2019-2035)

    ITALY Precipitated Silica Market by Application Type

    Rubber

    Plastics

    Coatings

    Food and Feed

    Pharmaceuticals

    ITALY Precipitated Silica Market by Form Type

    Granulated

    Powder

    Colloidal

    ITALY Precipitated Silica Market by End Use Type

    Automotive

    Construction

    Electronics

    Healthcare

    Consumer Goods

    ITALY Precipitated Silica Market by Type

    Synthetic Silica

    Natural Silica

    SPAIN Outlook (USD Billion, 2019-2035)

    SPAIN Precipitated Silica Market by Application Type

    Rubber

    Plastics

    Coatings

    Food and Feed

    Pharmaceuticals

    SPAIN Precipitated Silica Market by Form Type

    Granulated

    Powder

    Colloidal

    SPAIN Precipitated Silica Market by End Use Type

    Automotive

    Construction

    Electronics

    Healthcare

    Consumer Goods

    SPAIN Precipitated Silica Market by Type

    Synthetic Silica

    Natural Silica

    REST OF EUROPE Outlook (USD Billion, 2019-2035)

    REST OF EUROPE Precipitated Silica Market by Application Type

    Rubber

    Plastics

    Coatings

    Food and Feed

    Pharmaceuticals

    REST OF EUROPE Precipitated Silica Market by Form Type

    Granulated

    Powder

    Colloidal

    REST OF EUROPE Precipitated Silica Market by End Use Type

    Automotive

    Construction

    Electronics

    Healthcare

    Consumer Goods

    REST OF EUROPE Precipitated Silica Market by Type

    Synthetic Silica

    Natural Silica

    APAC Outlook (USD Billion, 2019-2035)

    APAC Precipitated Silica Market by Application Type

    Rubber

    Plastics

    Coatings

    Food and Feed

    Pharmaceuticals

    APAC Precipitated Silica Market by Form Type

    Granulated

    Powder

    Colloidal

    APAC Precipitated Silica Market by End Use Type

    Automotive

    Construction

    Electronics

    Healthcare

    Consumer Goods

    APAC Precipitated Silica Market by Type

    Synthetic Silica

    Natural Silica

    APAC Precipitated Silica Market by Regional Type

    China

    India

    Japan

    South Korea

    Malaysia

    Thailand

    Indonesia

    Rest of APAC

    CHINA Outlook (USD Billion, 2019-2035)

    CHINA Precipitated Silica Market by Application Type

    Rubber

    Plastics

    Coatings

    Food and Feed

    Pharmaceuticals

    CHINA Precipitated Silica Market by Form Type

    Granulated

    Powder

    Colloidal

    CHINA Precipitated Silica Market by End Use Type

    Automotive

    Construction

    Electronics

    Healthcare

    Consumer Goods

    CHINA Precipitated Silica Market by Type

    Synthetic Silica

    Natural Silica

    INDIA Outlook (USD Billion, 2019-2035)

    INDIA Precipitated Silica Market by Application Type

    Rubber

    Plastics

    Coatings

    Food and Feed

    Pharmaceuticals

    INDIA Precipitated Silica Market by Form Type

    Granulated

    Powder

    Colloidal

    INDIA Precipitated Silica Market by End Use Type

    Automotive

    Construction

    Electronics

    Healthcare

    Consumer Goods

    INDIA Precipitated Silica Market by Type

    Synthetic Silica

    Natural Silica

    JAPAN Outlook (USD Billion, 2019-2035)

    JAPAN Precipitated Silica Market by Application Type

    Rubber

    Plastics

    Coatings

    Food and Feed

    Pharmaceuticals

    JAPAN Precipitated Silica Market by Form Type

    Granulated

    Powder

    Colloidal

    JAPAN Precipitated Silica Market by End Use Type

    Automotive

    Construction

    Electronics

    Healthcare

    Consumer Goods

    JAPAN Precipitated Silica Market by Type

    Synthetic Silica

    Natural Silica

    SOUTH KOREA Outlook (USD Billion, 2019-2035)

    SOUTH KOREA Precipitated Silica Market by Application Type

    Rubber

    Plastics

    Coatings

    Food and Feed

    Pharmaceuticals

    SOUTH KOREA Precipitated Silica Market by Form Type

    Granulated

    Powder

    Colloidal

    SOUTH KOREA Precipitated Silica Market by End Use Type

    Automotive

    Construction

    Electronics

    Healthcare

    Consumer Goods

    SOUTH KOREA Precipitated Silica Market by Type

    Synthetic Silica

    Natural Silica

    MALAYSIA Outlook (USD Billion, 2019-2035)

    MALAYSIA Precipitated Silica Market by Application Type

    Rubber

    Plastics

    Coatings

    Food and Feed

    Pharmaceuticals

    MALAYSIA Precipitated Silica Market by Form Type

    Granulated

    Powder

    Colloidal

    MALAYSIA Precipitated Silica Market by End Use Type

    Automotive

    Construction

    Electronics

    Healthcare

    Consumer Goods

    MALAYSIA Precipitated Silica Market by Type

    Synthetic Silica

    Natural Silica

    THAILAND Outlook (USD Billion, 2019-2035)

    THAILAND Precipitated Silica Market by Application Type

    Rubber

    Plastics

    Coatings

    Food and Feed

    Pharmaceuticals

    THAILAND Precipitated Silica Market by Form Type

    Granulated

    Powder

    Colloidal

    THAILAND Precipitated Silica Market by End Use Type

    Automotive

    Construction

    Electronics

    Healthcare

    Consumer Goods

    THAILAND Precipitated Silica Market by Type

    Synthetic Silica

    Natural Silica

    INDONESIA Outlook (USD Billion, 2019-2035)

    INDONESIA Precipitated Silica Market by Application Type

    Rubber

    Plastics

    Coatings

    Food and Feed

    Pharmaceuticals

    INDONESIA Precipitated Silica Market by Form Type

    Granulated

    Powder

    Colloidal

    INDONESIA Precipitated Silica Market by End Use Type

    Automotive

    Construction

    Electronics

    Healthcare

    Consumer Goods

    INDONESIA Precipitated Silica Market by Type

    Synthetic Silica

    Natural Silica

    REST OF APAC Outlook (USD Billion, 2019-2035)

    REST OF APAC Precipitated Silica Market by Application Type

    Rubber

    Plastics

    Coatings

    Food and Feed

    Pharmaceuticals

    REST OF APAC Precipitated Silica Market by Form Type

    Granulated

    Powder

    Colloidal

    REST OF APAC Precipitated Silica Market by End Use Type

    Automotive

    Construction

    Electronics

    Healthcare

    Consumer Goods

    REST OF APAC Precipitated Silica Market by Type

    Synthetic Silica

    Natural Silica

    South America Outlook (USD Billion, 2019-2035)

    South America Precipitated Silica Market by Application Type

    Rubber

    Plastics

    Coatings

    Food and Feed

    Pharmaceuticals

    South America Precipitated Silica Market by Form Type

    Granulated

    Powder

    Colloidal

    South America Precipitated Silica Market by End Use Type

    Automotive

    Construction

    Electronics

    Healthcare

    Consumer Goods

    South America Precipitated Silica Market by Type

    Synthetic Silica

    Natural Silica

    South America Precipitated Silica Market by Regional Type

    Brazil

    Mexico

    Argentina

    Rest of South America

    BRAZIL Outlook (USD Billion, 2019-2035)

    BRAZIL Precipitated Silica Market by Application Type

    Rubber

    Plastics

    Coatings

    Food and Feed

    Pharmaceuticals

    BRAZIL Precipitated Silica Market by Form Type

    Granulated

    Powder

    Colloidal

    BRAZIL Precipitated Silica Market by End Use Type

    Automotive

    Construction

    Electronics

    Healthcare

    Consumer Goods

    BRAZIL Precipitated Silica Market by Type

    Synthetic Silica

    Natural Silica

    MEXICO Outlook (USD Billion, 2019-2035)

    MEXICO Precipitated Silica Market by Application Type

    Rubber

    Plastics

    Coatings

    Food and Feed

    Pharmaceuticals

    MEXICO Precipitated Silica Market by Form Type

    Granulated

    Powder

    Colloidal

    MEXICO Precipitated Silica Market by End Use Type

    Automotive

    Construction

    Electronics

    Healthcare

    Consumer Goods

    MEXICO Precipitated Silica Market by Type

    Synthetic Silica

    Natural Silica

    ARGENTINA Outlook (USD Billion, 2019-2035)

    ARGENTINA Precipitated Silica Market by Application Type

    Rubber

    Plastics

    Coatings

    Food and Feed

    Pharmaceuticals

    ARGENTINA Precipitated Silica Market by Form Type

    Granulated

    Powder

    Colloidal

    ARGENTINA Precipitated Silica Market by End Use Type

    Automotive

    Construction

    Electronics

    Healthcare

    Consumer Goods

    ARGENTINA Precipitated Silica Market by Type

    Synthetic Silica

    Natural Silica

    REST OF SOUTH AMERICA Outlook (USD Billion, 2019-2035)

    REST OF SOUTH AMERICA Precipitated Silica Market by Application Type

    Rubber

    Plastics

    Coatings

    Food and Feed

    Pharmaceuticals

    REST OF SOUTH AMERICA Precipitated Silica Market by Form Type

    Granulated

    Powder

    Colloidal

    REST OF SOUTH AMERICA Precipitated Silica Market by End Use Type

    Automotive

    Construction

    Electronics

    Healthcare

    Consumer Goods

    REST OF SOUTH AMERICA Precipitated Silica Market by Type

    Synthetic Silica

    Natural Silica

    MEA Outlook (USD Billion, 2019-2035)

    MEA Precipitated Silica Market by Application Type

    Rubber

    Plastics

    Coatings

    Food and Feed

    Pharmaceuticals

    MEA Precipitated Silica Market by Form Type

    Granulated

    Powder

    Colloidal

    MEA Precipitated Silica Market by End Use Type

    Automotive

    Construction

    Electronics

    Healthcare

    Consumer Goods

    MEA Precipitated Silica Market by Type

    Synthetic Silica

    Natural Silica

    MEA Precipitated Silica Market by Regional Type

    GCC Countries

    South Africa

    Rest of MEA

    GCC COUNTRIES Outlook (USD Billion, 2019-2035)

    GCC COUNTRIES Precipitated Silica Market by Application Type

    Rubber

    Plastics

    Coatings

    Food and Feed

    Pharmaceuticals

    GCC COUNTRIES Precipitated Silica Market by Form Type

    Granulated

    Powder

    Colloidal

    GCC COUNTRIES Precipitated Silica Market by End Use Type

    Automotive

    Construction

    Electronics

    Healthcare

    Consumer Goods

    GCC COUNTRIES Precipitated Silica Market by Type

    Synthetic Silica

    Natural Silica

    SOUTH AFRICA Outlook (USD Billion, 2019-2035)

    SOUTH AFRICA Precipitated Silica Market by Application Type

    Rubber

    Plastics

    Coatings

    Food and Feed

    Pharmaceuticals

    SOUTH AFRICA Precipitated Silica Market by Form Type

    Granulated

    Powder

    Colloidal

    SOUTH AFRICA Precipitated Silica Market by End Use Type

    Automotive

    Construction

    Electronics

    Healthcare

    Consumer Goods

    SOUTH AFRICA Precipitated Silica Market by Type

    Synthetic Silica

    Natural Silica

    REST OF MEA Outlook (USD Billion, 2019-2035)

    REST OF MEA Precipitated Silica Market by Application Type

    Rubber

    Plastics

    Coatings

    Food and Feed

    Pharmaceuticals

    REST OF MEA Precipitated Silica Market by Form Type

    Granulated

    Powder

    Colloidal

    REST OF MEA Precipitated Silica Market by End Use Type

    Automotive

    Construction

    Electronics

    Healthcare

    Consumer Goods

    REST OF MEA Precipitated Silica Market by Type

    Synthetic Silica

    Natural Silica


    Infographic

    Free Sample Request

    Kindly complete the form below to receive a free sample of this Report

    Get Free Sample

    Customer Strories

    “I am very pleased with how market segments have been defined in a relevant way for my purposes (such as "Portable Freezers & refrigerators" and "last-mile"). In general the report is well structured. Thanks very much for your efforts.”

    Victoria Milne

    Founder
    Case Study
    Chemicals and Materials