ID: MRFR/ICT/6912-HCR | February 2021 | Region: Global | 100 pages
Market Synopsis
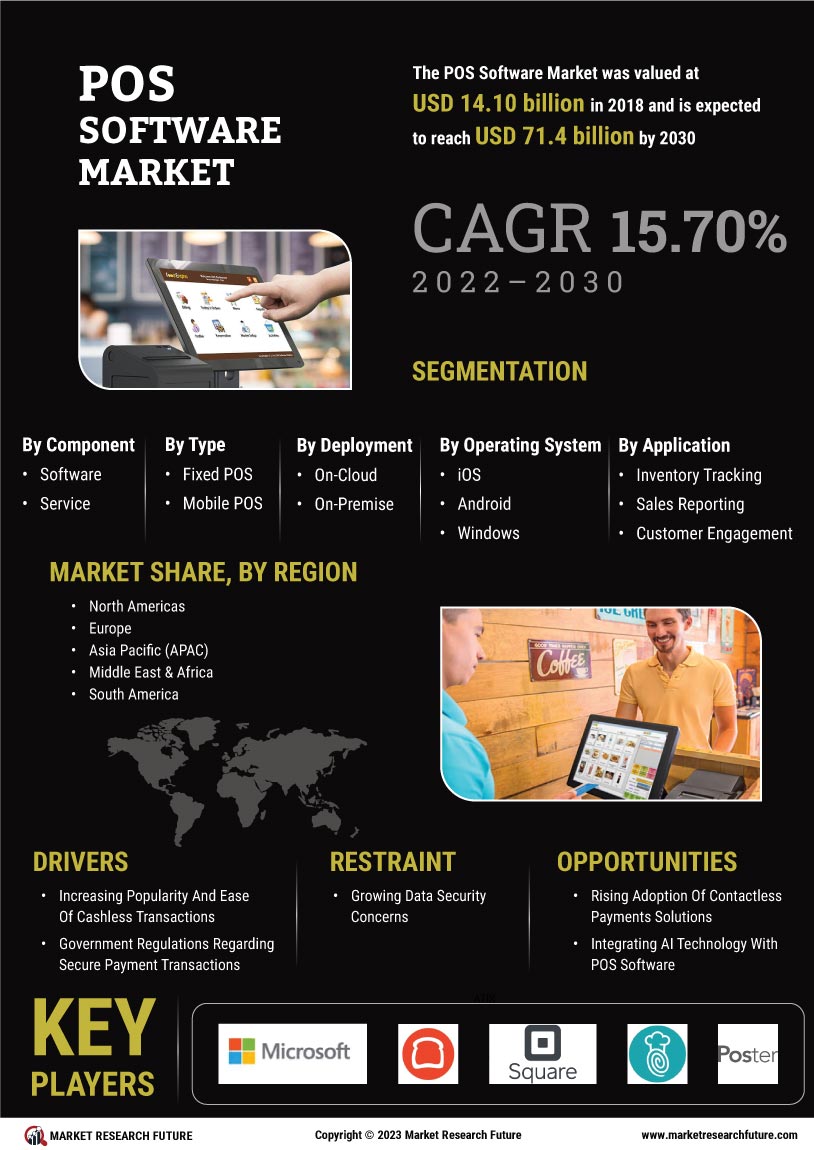
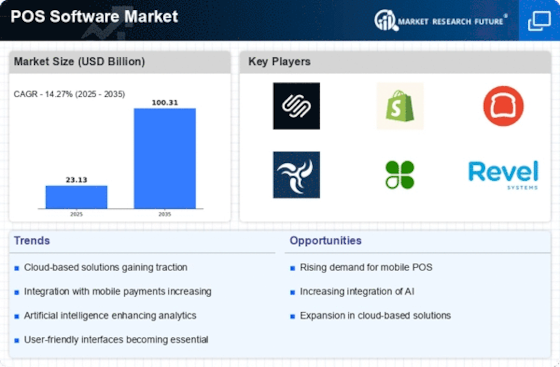
The Global POS Software Market was valued at USD 14.10 billion in 2018 and is expected to reach USD 34.77 billion by 2025 growing at a CAGR of 14.27% during the forecast period, 2019–2025.
POS software or point-of-sale software is a solution used in combination with POS hardware terminals such as cash registers, credit and debit card processing equipment, special terminals, displays, optical scanners, and magnetic card readers. The POS software system is capable of analyzing the inventories, sales reports, and other parameters and offering a graphical and pictorial representation to facilitate business insights. This helps the vendors to simplify its business operations, increase employee productivity, operational efficiency, and customer satisfaction.
Increasing adoption of smartphones, tablets, and other smart handheld devices, changing payment options which include the growing use of debit cards, credit cards, and other digital payment wallets, and government support fueling the development of high-speed networks such as 3G, 4G, and 5G are some of the major factors driving the growth of POS software market. Rising demand among retailers, restaurants, hotels, resorts, groceries/supermarkets, and cafes to manage entire business operations such as sales, inventories, customer loyalty, and marketing from a single platform have created a significant demand for POS systems. POS software with payment gateways help businesses to improve customer engagement, customer satisfaction ratio, and the overall customer experience.
The market is expected to offer growth opportunities owing to the rising adoption of contactless payment solutions and integrating AI technology with the software. However, growing data security concerns are a major restraining factor for the market. Emerging technologies such as IoT and machine learning have a significant impact on the POS software market. AI integrated POS software, mobile POS system, personalized shopping experience, and cloud-based POS software are some of the recent trends prevailing in the POS software market.
Key Players:
The prominent players active in the global market of POS software are Microsoft Corporation (US), Toast Inc. (US), Square Inc. (US), TouchBistro Inc. (Canada), Poster POS (Ukraine), Vend (New Zealand), Miva, Inc. (US), Lightspeed (Canada), Shopify (Canada), Salesforce.com, Inc. (US), Intuit (US), Bindo POS (US), Erply (US), GOFRUGAL (Dubai), Toshiba Corporation (Japan), PAX Global Technology Limited (Hong Kong), Panasonic Corporation (Japan), Intel Corporation (US), and HP Inc. (US).
Global POS Software Market, 2018–2025 (USD Billion)
Source: Company websites, Annual Reports, Secondary research, Press Releases, Paid Database, Expert interviews, White papers, Journals, Case Studies, MRFR Analysis
Segmentation
The global POS software market has been segmented on the basis of component, type, deployment, operating system, application, end-user, and region.
By component, the market has been segmented into software and services.
By type, the market has been segmented into fixed POS and mobile POS.
By deployment, the market has been segmented into on-cloud and on-premise.
By operating system, the market has been segmented into iOS, Android, and Windows.
By application, the market has been segmented into inventory tracking, sales reporting, purchasing management, customer engagement, and others.
By end-user, the market has been categorized into BFSI, retail, media & entertainment, transportation, hospitality, and others.
By region, the market has been segmented into North America, Europe, Asia-Pacific, the Middle East and Africa, and South America.
Regional Analysis
Market Research Future (MRFR) has covered the following countries in the regional analysis of POS software market: the US, Canada, and Mexico in North America. Germany, the UK, France, Spain, Norway, Benelux, and Italy in Europe. China, Japan, India, South Korea, Australia, Malaysia, Indonesia, and the Philippines in Asia-Pacific. Saudi Arabia, Israel, Turkey, and South Africa in the Middle East & Africa; and Brazil, Peru, Chile, and Argentina in South America.
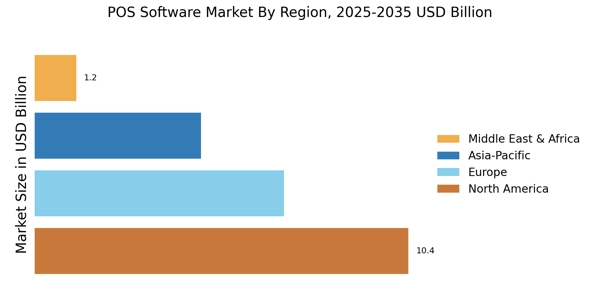
North America currently dominates the global POS software market. The region is an early adopter of new technologies and hub to a number of POS software providers. The US, among all the countries in the region, accounts for the largest market share owing to highly skilled expertise and research and development capabilities, aiming at developing AI sourcing tools for enhancing the quality of hiring process, which has propelled the market growth of POS software in the country. Europe follows North America; it is expected to have a considerable market share in the global POS software market. Growth in the hospitality sector across Europe which increases the demand for POS software for restaurants, resorts, and other end users is driving the market growth in the region.
Asia-Pacific is projected to be the fastest-growing region during the forecast period. Growing retail and e-commerce sectors and government initiatives supporting digital payments are increasing the demand for POS software for small businesses. Furthermore, increasing adoption of cloud-based point of sale software has accelerated the demand for POS software systems in the region. The global POS software market in the Middle East & Africa and South America is also expected to grow at a considerable rate during the forecast period due to the rising penetration of smart devices which increases the demand for pos software for pc.
Intended Audience
Frequently Asked Questions (FAQ) :
Microsoft Corporation (US), Toast Inc. (US), Square Inc. (US), TouchBistro Inc. (Canada) have been the active members investing in the market growth.
North America, Europe, Asia-Pacific, the Middle East and Africa, and South America are the regions to score well in the market share.
The CAGR of the market is calculated to be 14.27%.
The valuation of the market in the future will be USD 34.77 billion by 2025
The rising demand from the retailers, restaurants, hotels, resorts, groceries or supermarkets, and cafes to manage business operations such as sales, inventories, customer loyalty, and marketing from a single platform has created high demand for POS systems.
Table of Contents
1 Executive Summary
2 Scope of the Report
2.1 Market Definition
2.2 Scope of the Study
2.2.1 Research Objectives
2.2.2 Assumptions & Limitations
2.3 Markets Structure
3 Market Research Methodology
3.1 Research Process
3.2 Secondary Research
3.3 Primary Research
3.4 Forecast Model
4 Market Landscape
4.1 Porter’s Five Forces Analysis
4.1.1 Threat of New Entrants
4.1.2 Bargaining power of buyers
4.1.3 Threat of substitutes
4.1.4 Intensity of Rivalry
4.1.5 Bargaining Power of Suppliers
4.2 Value Chain/Supply Chain of the Global POS Software Market
5 Market Dynamics of the Global POS Software Market
5.1 Market Drivers
5.1.1 Increasing Popularity and Ease of Cashless Transactions
5.1.2 Government Regulations Regarding Secure Payment Transactions
5.2 Market Restraints
5.2.1 Growing Data Security Concerns
5.3 Market Opportunities
5.3.1 Rising Adoption of Contactless Payments Solutions
5.3.2 Integrating AI Technology with POS software
6 Market Trends
6.1 Introduction
6.2 Impact Analysis of Emerging Technologies
6.2.1 Impact Analysis of IoT
6.2.1 Impact Analysis of Machine Learning
6.3 Best Practices and Use Cases
7. Global POS Software Market, by Component
7.1 Introduction
7.2 Software
7.2.1 Market Estimates & Forecast, 2019–2025
7.2.2 Market Estimates & Forecast, by Region, 2019–2025
7.3 Service
7.3.1 Market Estimates & Forecast, 2019–2025
7.3.2 Market Estimates & Forecast, by Region, 2019–2025
8. Global POS Software Market, by Type
8.1 Introduction
8.2 Fixed POS
8.2.1 Market Estimates & Forecast, 2019–2025
8.3 Mobile POS
8.3.1 Market Estimates & Forecast, 2019–2025
8.3.2 Market Estimates & Forecast, by Region, 2019–2025
9. Global POS Software Market, by Deployment
9.1 Introduction
9.2 On-Cloud
9.2.1 Market Estimates & Forecast, 2019–2025
9.3 On-Premise
9.3.1 Market Estimates & Forecast, 2019–2025
9.3.2 Market Estimates & Forecast, by Region, 2019–2025
10. Global POS Software Market, by Operating System
10.1 Introduction
10.2 iOS
10.2.1 Market Estimates & Forecast, 2019–2025
10.3 Android
10.3.1 Market Estimates & Forecast, 2019–2025
10.3.2 Market Estimates & Forecast, by Region, 2019–2025
10.4 Windows
10.4.1 Market Estimates & Forecast, 2019–2025
10.4.2 Market Estimates & Forecast, by Region, 2019–2025
11. Global POS Software Market, by Application
11.1 Introduction
11.2 Inventory Tracking
11.2.1 Market Estimates & Forecast, 2019–2025
11.2.2 Market Estimates & Forecast, by Region, 2019–2025
11.3 Sales Reporting
11.3.1 Market Estimates & Forecast, 2019–2025
11.3.2 Market Estimates & Forecast, by Region, 2019–2025
11.4 Purchasing Management
11.4.1 Market Estimates & Forecast, 2019–2025
11.4.2 Market Estimates & Forecast, by Region, 2019–2025
11.5 Customer Engagement
11.5.1 Market Estimates & Forecast, 2019–2025
11.5.2 Market Estimates & Forecast, by Region, 2019–2025
11.6 Others
11.6.1 Market Estimates & Forecast, 2019–2025
11.6.2 Market Estimates & Forecast, by Region, 2019–2025
12. Global POS Software Market, by End-User
12.1 Introduction
12.2 BFSI
12.2.1 Market Estimates & Forecast, 2019–2025
12.2.2 Market Estimates & Forecast, by Region, 2019–2025
12.3 Retail
12.3.1 Market Estimates & Forecast, 2019–2025
12.3.2 Market Estimates & Forecast, by Region, 2019–2025
12.4 Media & Entertainment
12.4.1 Market Estimates & Forecast, 2019–2025
12.4.2 Market Estimates & Forecast, by Region, 2019–2025
12.5 Transportation
12.5.1 Market Estimates & Forecast, 2019–2025
12.5.2 Market Estimates & Forecast, by Region, 2019–2025
12.6 Hospitality
12.6.1 Market Estimates & Forecast, 2019–2025
12.6.2 Market Estimates & Forecast, by Region, 2019–2025
12.7 Others
12.7.1 Market Estimates & Forecast, 2019–2025
12.7.2 Market Estimates & Forecast, by Region, 2019–2025
13. Global POS Software Market, by Region
13.1 Introduction
13.2 North America
13.2.1 Market Estimates & Forecast, by Country, 2019–2025
13.2.2 Market Estimates & Forecast, by Component, 2019–2025
13.2.3 Market Estimates & Forecast, by Type, 2019–2025
13.2.4 Market Estimates & Forecast, by Deployment, 2019–2025
13.2.5 Market Estimates & Forecast, by Application, 2019–2025
13.2.6 Market Estimates & Forecast, by End-User, 2019–2025
13.2.7 US
13.2.7.1 Market Estimates & Forecast, by Component, 2019–2025
13.2.7.2 Market Estimates & Forecast, by Type, 2019–2025
13.2.7.3 Market Estimates & Forecast, by Deployment, 2019–2025
13.2.7.4 Market Estimates & Forecast, by Application, 2019–2025
13.2.7.5 Market Estimates & Forecast, by End-User, 2019–2025
13.2.8 Mexico
13.2.8.1 Market Estimates & Forecast, by Component, 2019–2025
13.2.8.2 Market Estimates & Forecast, by Type, 2019–2025
13.2.8.3 Market Estimates & Forecast, by Deployment, 2019–2025
13.2.8.4 Market Estimates & Forecast, by Application, 2019–2025
13.2.8.5 Market Estimates & Forecast, by End-User, 2019–2025
13.2.9 Canada
13.2.9.1 Market Estimates & Forecast, by Component, 2019–2025
13.2.9.2 Market Estimates & Forecast, by Type, 2019–2025
13.2.9.3 Market Estimates & Forecast, by Deployment, 2019–2025
13.2.9.4 Market Estimates & Forecast, by Application, 2019–2025
13.2.9.5 Market Estimates & Forecast, by End-User, 2019–2025
13.3 Europe
13.3.1 Market Estimates & Forecast, by Country, 2019–2025
13.3.2 Market Estimates & Forecast, by Component, 2019–2025
13.3.3 Market Estimates & Forecast, by Type, 2019–2025
13.3.4 Market Estimates & Forecast, by Deployment, 2019–2025
13.3.5 Market Estimates & Forecast, by Application, 2019–2025
13.3.6 Market Estimates & Forecast, by End-User, 2019–2025
13.3.7 Germany
13.3.7.1 Market Estimates & Forecast, by Component, 2019–2025
13.3.7.2 Market Estimates & Forecast, by Type, 2019–2025
13.3.7.3 Market Estimates & Forecast, by Deployment, 2019–2025
13.3.7.4 Market Estimates & Forecast, by Application, 2019–2025
13.3.7.5 Market Estimates & Forecast, by End-User, 2019–2025
13.3.8 France
13.3.8.1 Market Estimates & Forecast, by Component, 2019–2025
13.3.8.2 Market Estimates & Forecast, by Type, 2019–2025
13.3.8.3 Market Estimates & Forecast, by Deployment, 2019–2025
13.3.8.4 Market Estimates & Forecast, by Application, 2019–2025
13.3.8.5 Market Estimates & Forecast, by End-User, 2019–2025
13.3.9 UK
13.3.9.1 Market Estimates & Forecast, by Component, 2019–2025
13.3.9.2 Market Estimates & Forecast, by Type, 2019–2025
13.3.9.3 Market Estimates & Forecast, by Deployment, 2019–2025
13.3.9.4 Market Estimates & Forecast, by Application, 2019–2025
13.3.9.5 Market Estimates & Forecast, by End-User, 2019–2025
13.3.10 Italy
13.3.10.1 Market Estimates & Forecast, by Component, 2019–2025
13.3.10.2 Market Estimates & Forecast, by Type, 2019–2025
13.3.10.3 Market Estimates & Forecast, by Deployment, 2019–2025
13.3.10.4 Market Estimates & Forecast, by Application, 2019–2025
13.3.10.5 Market Estimates & Forecast, by End-User, 2019–2025
13.3.11 Spain
13.3.11.1 Market Estimates & Forecast, by Component, 2019–2025
13.3.11.2 Market Estimates & Forecast, by Type, 2019–2025
13.3.11.3 Market Estimates & Forecast, by Deployment, 2019–2025
13.3.11.4 Market Estimates & Forecast, by Application, 2019–2025
13.3.11.5 Market Estimates & Forecast, by End-User, 2019–2025
13.3.12 Benelux
13.3.12.1 Market Estimates & Forecast, by Component, 2019–2025
13.3.12.2 Market Estimates & Forecast, by Type, 2019–2025
13.3.12.3 Market Estimates & Forecast, by Deployment, 2019–2025
13.3.12.4 Market Estimates & Forecast, by Application, 2019–2025
13.3.12.5 Market Estimates & Forecast, by End-User, 2019–2025
13.3.13 Norway
13.3.13.1 Market Estimates & Forecast, by Component, 2019–2025
13.3.13.2 Market Estimates & Forecast, by Type, 2019–2025
13.3.13.3 Market Estimates & Forecast, by Deployment, 2019–2025
13.3.13.4 Market Estimates & Forecast, by Application, 2019–2025
13.3.13.5 Market Estimates & Forecast, by End-User, 2019–2025
13.3.14 Rest of Europe
13.3.14.1 Market Estimates & Forecast, by Component, 2019–2025
13.3.14.2 Market Estimates & Forecast, by Type, 2019–2025
13.3.14.3 Market Estimates & Forecast, by Deployment, 2019–2025
13.3.14.4 Market Estimates & Forecast, by Application, 2019–2025
13.3.14.5 Market Estimates & Forecast, by End-User, 2019–2025
13.4 Asia-Pacific
13.4.1 Market Estimates & Forecast, by Country, 2019–2025
13.4.2 Market Estimates & Forecast, by Component, 2019–2025
13.4.3 Market Estimates & Forecast, by Type, 2019–2025
13.4.4 Market Estimates & Forecast, by Deployment, 2019–2025
13.4.5 Market Estimates & Forecast, by Application, 2019–2025
13.4.6 Market Estimates & Forecast, by End-User, 2019–2025
13.4.7 China
13.4.7.1 Market Estimates & Forecast, by Component, 2019–2025
13.4.7.2 Market Estimates & Forecast, by Type, 2019–2025
13.4.7.3 Market Estimates & Forecast, by Deployment, 2019–2025
13.4.7.4 Market Estimates & Forecast, by Application, 2019–2025
13.4.7.5 Market Estimates & Forecast, by End-User, 2019–2025
13.4.8 India
13.4.8.1 Market Estimates & Forecast, by Component, 2019–2025
13.4.8.2 Market Estimates & Forecast, by Type, 2019–2025
13.4.8.3 Market Estimates & Forecast, by Deployment, 2019–2025
13.4.8.4 Market Estimates & Forecast, by Application, 2019–2025
13.4.8.5 Market Estimates & Forecast, by End-User, 2019–2025
13.4.9 Japan
13.4.9.1 Market Estimates & Forecast, by Component, 2019–2025
13.4.9.2 Market Estimates & Forecast, by Type, 2019–2025
13.4.9.3 Market Estimates & Forecast, by Deployment, 2019–2025
13.4.9.4 Market Estimates & Forecast, by Application, 2019–2025
13.4.9.5 Market Estimates & Forecast, by End-User, 2019–2025
13.4.10 South Korea
13.4.10.1 Market Estimates & Forecast, by Component, 2019–2025
13.4.10.2 Market Estimates & Forecast, by Type, 2019–2025
13.4.10.3 Market Estimates & Forecast, by Deployment, 2019–2025
13.4.10.4 Market Estimates & Forecast, by Application, 2019–2025
13.4.10.5 Market Estimates & Forecast, by End-User, 2019–2025
13.4.11 Australia
13.4.11.1 Market Estimates & Forecast, by Component, 2019–2025
13.4.11.2 Market Estimates & Forecast, by Type, 2019–2025
13.4.11.3 Market Estimates & Forecast, by Deployment, 2019–2025
13.4.11.4 Market Estimates & Forecast, by Application, 2019–2025
13.4.11.5 Market Estimates & Forecast, by End-User, 2019–2025
13.4.12 Malaysia
13.4.12.1 Market Estimates & Forecast, by Component, 2019–2025
13.4.12.2 Market Estimates & Forecast, by Type, 2019–2025
13.4.12.3 Market Estimates & Forecast, by Deployment, 2019–2025
13.4.12.4 Market Estimates & Forecast, by Application, 2019–2025
13.4.12.5 Market Estimates & Forecast, by End-User, 2019–2025
13.4.13 Indonesia
13.4.13.1 Market Estimates & Forecast, by Component, 2019–2025
13.4.13.2 Market Estimates & Forecast, by Type, 2019–2025
13.4.13.3 Market Estimates & Forecast, by Deployment, 2019–2025
13.4.13.4 Market Estimates & Forecast, by Application, 2019–2025
13.4.13.5 Market Estimates & Forecast, by End-User, 2019–2025
13.4.14 Philippines
13.4.14.1 Market Estimates & Forecast, by Component, 2019–2025
13.4.14.2 Market Estimates & Forecast, by Type, 2019–2025
13.4.14.3 Market Estimates & Forecast, by Deployment, 2019–2025
13.4.14.4 Market Estimates & Forecast, by Application, 2019–2025
13.4.14.5 Market Estimates & Forecast, by End-User, 2019–2025
13.4.15 Rest of Asia-Pacific
13.4.15.1 Market Estimates & Forecast, by Component, 2019–2025
13.4.15.2 Market Estimates & Forecast, by Type, 2019–2025
13.4.15.3 Market Estimates & Forecast, by Deployment, 2019–2025
13.4.15.4 Market Estimates & Forecast, by Application, 2019–2025
13.4.15.5 Market Estimates & Forecast, by End-User, 2019–2025
13.5 Middle East & Africa
13.5.1 Market Estimates & Forecast, by Country, 2019–2025
13.5.2 Market Estimates & Forecast, by Component, 2019–2025
13.5.3 Market Estimates & Forecast, by Type, 2019–2025
13.5.4 Market Estimates & Forecast, by Deployment, 2019–2025
13.5.5 Market Estimates & Forecast, by Application, 2019–2025
13.5.6 Market Estimates & Forecast, by End-User, 2019–2025
13.5.7 Saudi Arabia
13.5.7.1 Market Estimates & Forecast, by Component, 2019–2025
13.5.7.2 Market Estimates & Forecast, by Type, 2019–2025
13.5.7.3 Market Estimates & Forecast, by Deployment, 2019–2025
13.5.7.4 Market Estimates & Forecast, by Application, 2019–2025
13.5.7.5 Market Estimates & Forecast, by End-User, 2019–2025
13.5.8 Israel
13.5.8.1 Market Estimates & Forecast, by Component, 2019–2025
13.5.8.2 Market Estimates & Forecast, by Type, 2019–2025
13.5.8.3 Market Estimates & Forecast, by Deployment, 2019–2025
13.5.8.4 Market Estimates & Forecast, by Application, 2019–2025
13.5.8.5 Market Estimates & Forecast, by End-User, 2019–2025
13.5.9 Turkey
13.5.9.1 Market Estimates & Forecast, by Component, 2019–2025
13.5.9.2 Market Estimates & Forecast, by Type, 2019–2025
13.5.9.3 Market Estimates & Forecast, by Deployment, 2019–2025
13.5.9.4 Market Estimates & Forecast, by Application, 2019–2025
13.5.9.5 Market Estimates & Forecast, by End-User, 2019–2025
13.5.10 South Africa
13.5.10.1 Market Estimates & Forecast, by Component, 2019–2025
13.5.10.2 Market Estimates & Forecast, by Type, 2019–2025
13.5.10.3 Market Estimates & Forecast, by Deployment, 2019–2025
13.5.10.4 Market Estimates & Forecast, by Application, 2019–2025
13.5.10.5 Market Estimates & Forecast, by End-User, 2019–2025
13.5.11 Rest of Middle East and Africa
13.5.11.1 Market Estimates & Forecast, by Component, 2019–2025
13.5.11.2 Market Estimates & Forecast, by Type, 2019–2025
13.5.11.3 Market Estimates & Forecast, by Deployment, 2019–2025
13.5.11.4 Market Estimates & Forecast, by Application, 2019–2025
13.5.11.5 Market Estimates & Forecast, by End-User, 2019–2025
13.6 South America
13.6.1 Market Estimates & Forecast, by Country, 2019–2025
13.6.2 Market Estimates & Forecast, by Component, 2019–2025
13.6.3 Market Estimates & Forecast, by Type, 2019–2025
13.6.4 Market Estimates & Forecast, by Deployment, 2019–2025
13.6.5 Market Estimates & Forecast, by Application, 2019–2025
13.6.6 Market Estimates & Forecast, by End-User, 2019–2025
13.6.7 Brazil
13.6.7.1 Market Estimates & Forecast, by Component, 2019–2025
13.6.7.2 Market Estimates & Forecast, by Type, 2019–2025
13.6.7.3 Market Estimates & Forecast, by Deployment, 2019–2025
13.6.7.4 Market Estimates & Forecast, by Application, 2019–2025
13.6.7.5 Market Estimates & Forecast, by End-User, 2019–2025
13.6.8 Peru
13.6.8.1 Market Estimates & Forecast, by Component, 2019–2025
13.6.8.2 Market Estimates & Forecast, by Type, 2019–2025
13.6.8.3 Market Estimates & Forecast, by Deployment, 2019–2025
13.6.8.4 Market Estimates & Forecast, by Application, 2019–2025
13.6.8.5 Market Estimates & Forecast, by End-User, 2019–2025
13.6.9 Chile
13.6.9.1 Market Estimates & Forecast, by Component, 2019–2025
13.6.9.2 Market Estimates & Forecast, by Type, 2019–2025
13.6.9.3 Market Estimates & Forecast, by Deployment, 2019–2025
13.6.9.4 Market Estimates & Forecast, by Application, 2019–2025
13.6.9.5 Market Estimates & Forecast, by End-User, 2019–2025
13.6.10 Argentina
13.6.10.1 Market Estimates & Forecast, by Component, 2019–2025
13.6.10.2 Market Estimates & Forecast, by Type, 2019–2025
13.6.10.3 Market Estimates & Forecast, by Deployment, 2019–2025
13.6.10.4 Market Estimates & Forecast, by Application, 2019–2025
13.6.10.5 Market Estimates & Forecast, by End-User, 2019–2025
13.6.11 Rest of South America
13.6.11.1 Market Estimates & Forecast, by Component, 2019–2025
13.6.11.2 Market Estimates & Forecast, by Type, 2019–2025
13.6.11.3 Market Estimates & Forecast, by Deployment, 2019–2025
13.6.11.4 Market Estimates & Forecast, by Application, 2019–2025
13.6.11.5 Market Estimates & Forecast, by End-User, 2019–2025
14. Company Profiles
14.1 Microsoft Corporation
14.1.1 Company Overview
14.1.2 Product/Business Segment Overview
14.1.3 Financial Updates
14.1.4 Key Developments
14.1.5 SWOT Analysis
14.1.6 Key Strategies
14.2 Toast Inc
14.2.1 Company Overview
14.2.2 Product/Business Segment Overview
14.2.3 Financial Updates
14.2.4 Key Developments
14.2.5 SWOT Analysis
14.2.6 Key Strategies
14.3 Square Inc
14.3.1 Company Overview
14.3.2 Product/Business Segment Overview
14.3.3 Financial Updates
14.3.4 Key Developments
14.3.5 SWOT Analysis
14.3.6 Key Strategies
14.4 TouchBistro Inc
14.4.1 Company Overview
14.4.2 Product/Business Segment Overview
14.4.3 Financial Updates
14.4.4 Key Developments
14.4.5 SWOT Analysis
14.4.6 Key Strategies
14.5 Poster POS
14.5.1 Company Overview
14.5.2 Product/Business Segment Overview
14.5.3 Financial Updates
14.5.4 Key Developments
14.5.5 SWOT Analysis
14.5.6 Key Strategies
14.6 Vend
14.6.1 Company Overview
14.6.2 Product/Business Segment Overview
14.6.3 Financial Updates
14.6.4 Key Developments
14.6.5 SWOT Analysis
14.6.6 Key Strategies
14.7 Miva, Inc
14.7.1 Company Overview
14.7.2 Product/Business Segment Overview
14.7.3 Financial Updates
14.7.4 Key Developments
14.7.5 SWOT Analysis
14.7.6 Key Strategies
14.8 Lightspeed
14.8.1 Company Overview
14.8.2 Product/Business Segment Overview
14.8.3 Financial Updates
14.8.4 Key Developments
14.8.5 SWOT Analysis
14.8.6 Key Strategies
14.9 Shopify
14.9.1 Company Overview
14.9.2 Product/Business Segment Overview
14.9.3 Financial Updates
14.9.4 Key Developments
14.9.5 SWOT Analysis
14.9.6 Key Strategies
14.10 Salesforce.com, Inc
14.10.1 Company Overview
14.10.2 Product/Business Segment Overview
14.10.3 Financial Updates
14.10.4 Key Developments
14.10.5 SWOT Analysis
14.10.6 Key Strategies
14.11 Intuit
14.11.1 Company Overview
14.11.2 Product/Business Segment Overview
14.11.3 Financial Updates
14.11.4 Key Developments
14.11.5 SWOT Analysis
14.11.6 Key Strategies
14.12 Bindo POS
14.12.1 Company Overview
14.12.2 Product/Business Segment Overview
14.12.3 Financial Updates
14.12.4 Key Developments
14.12.5 SWOT Analysis
14.12.6 Key Strategies
14.13 Erply
14.13.1 Company Overview
14.13.2 Product/Business Segment Overview
14.13.3 Financial Updates
14.13.4 Key Developments
14.13.5 SWOT Analysis
14.13.6 Key Strategies
14.14 GOFRUGAL
14.14.1 Company Overview
14.14.2 Product/Business Segment Overview
14.14.3 Financial Updates
14.14.4 Key Developments
14.14.5 SWOT Analysis
14.14.6 Key Strategies
14.15 Toshiba Corporation
14.15.1 Company Overview
14.15.2 Product/Business Segment Overview
14.15.3 Financial Updates
14.15.4 Key Developments
14.15.5 SWOT Analysis
14.15.6 Key Strategies
14.16 PAX Global Technology Limited
14.16.1 Company Overview
14.16.2 Product/Business Segment Overview
14.16.3 Financial Updates
14.16.4 Key Developments
14.16.5 SWOT Analysis
14.16.6 Key Strategies
14.17 Panasonic Corporation
14.17.1 Company Overview
14.17.2 Product/Business Segment Overview
14.17.3 Financial Updates
14.17.4 Key Developments
14.17.5 SWOT Analysis
14.17.6 Key Strategies
14.18 HP Inc
14.18.1 Company Overview
14.18.2 Product/Business Segment Overview
14.18.3 Financial Updates
14.18.4 Key Developments
14.18.5 SWOT Analysis
14.18.6 Key Strategies
14.19 Intel Corporation
14.19.1 Company Overview
14.19.2 Product/Business Segment Overview
14.19.3 Financial Updates
14.19.4 Key Developments
14.19.5 SWOT Analysis
14.19.6 Key Strategies
15 Conclusion
LIST OF TABLES
Table1 Global POS Software Market, by Country, 2019–2025
Table2 North America: POS Software Market, by Country, 2019–2025
Table3 Europe: POS Software Market. by Country, 2019–2025
Table4 Asia-Pacific: POS Software Market by Country, 2019–2025
Table5 North America: POS Software Market, by Country
Table6 North America: POS Software Market, by Component
Table7 North America: POS Software Market, by Type
Table8 North America: POS Software Market, by Deployment
Table9 North America: POS Software Market, by Operating System
Table10 North America: POS Software Market, by Application
Table11 North America: POS Software Market, by End-User
Table12 Europe: POS Software Market, by Country
Table13 Europe: POS Software Market, by Component
Table14 Europe: POS Software Market, by Type
Table15 Europe: POS Software Market, by Deployment
Table16 Europe: POS Software Market, by Operating System
Table17 Europe: POS Software Market, by Application
Table18 Europe: POS Software Market, by End-User
Table19 Asia-Pacific: POS Software Market, by Country
Table20 Asia-Pacific: POS Software Market, by Component
Table21 Asia-Pacific: POS Software Market, by Type
Table22 Asia-Pacific: POS Software Market, by Deployment
Table23 Asia-Pacific: POS Software Market, by Operating System
Table24 Asia-Pacific: POS Software Market, by Application
Table25 Asia-Pacific: POS Software Market, by End-User
Table26 Middle East & Africa: POS Software Market, by Country
Table27 Middle East & Africa: POS Software Market, by Component
Table28 Middle East & Africa: POS Software Market, by Type
Table29 Middle East & Africa: POS Software Market, by Deployment
Table30 Middle East & Africa: POS Software Market, by Operating System
Table31 Middle East & Africa: POS Software Market, by Application
Table32 Middle East & Africa: POS Software Market, by End-User
Table33 South America: POS Software Market, by Country
Table34 South America: POS Software Market, by Component
Table35 South America: POS Software Market, by Type
Table36 South America: POS Software Market, by Deployment
Table37 South America: POS Software Market, by Operating System
Table38 South America: POS Software Market, by Application
Table39 South America: POS Software Market, by End-User
LIST OF FIGURES
FIGURE 1 Global POS Software Market Segmentation
FIGURE 2 Forecast Methodology
FIGURE 3 Porter’s Five Forces Analysis of the Global POS Software Market
FIGURE 4 Value Chain of Global POS Software Market
FIGURE 5 Share of the POS Software Market in 2018, by country (in %)
FIGURE 6 Global POS Software Market, 2019–2025
FIGURE 7 Global POS Software Market Size, by Component, 2019–2025
FIGURE 8 Share of the Global POS Software Market, by Component, (in %)
FIGURE 9 Global POS Software Market Size, by Type, 2019–2025
FIGURE 10 Share of the Global POS Software Market, by Type, (in %)
FIGURE 11 Global POS Software Market Size, by Deployment, 2019–2025
FIGURE 12 Share of the Global POS Software Market, by Deployment, (in %)
FIGURE 13 Global POS Software Market Size, by Operating System, 2019–2025
FIGURE 14 Share of the Global POS Software Market, by Operating System, (in %)
FIGURE 15 Global POS Software Market Size, by Application, 2019–2025
FIGURE 16 Share of the Global POS Software Market, by Application, (in %)
FIGURE 17 Global POS Software Market Size, by End-User, 2019–2025
FIGURE 18 Share of the Global POS Software Market, by End-User, (in %)