Segmentation Quick Reference
| Dimension | Sub-Segments | Dominant Segment | Fastest Growing Segment |
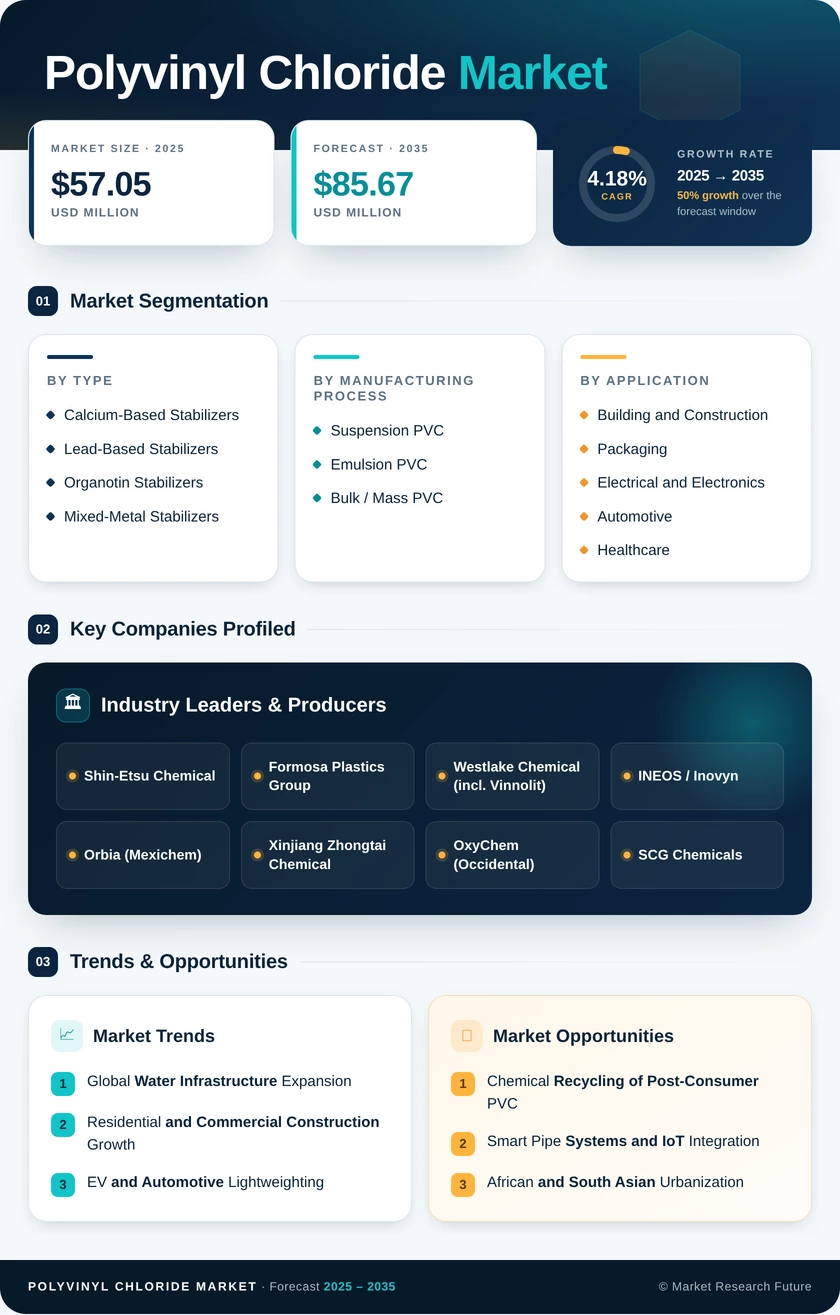
| Product Type | Rigid PVC, Flexible PVC, Chlorinated PVC (CPVC) | Rigid PVC (65.8% share, 2025) | Chlorinated PVC (4.90% CAGR) |
| Manufacturing Process | Suspension PVC, Emulsion PVC, Bulk / Mass PVC | Suspension PVC (79.5% share, 2025) | Emulsion PVC (4.72% CAGR) |
| Stabilizer Type | Calcium-Based, Lead-Based, Organotin, Mixed-Metal | Calcium-Based (51.0% share, 2025) | Organotin (5.42% CAGR) |
| Application | Pipes & Fittings, Profiles & Tubes, Bottles & Packaging, Films & Sheets, Wires & Cables | Pipes & Fittings (52.8% share, 2025) | Profiles & Tubes (4.15% CAGR) |
| End-User Industry | Building & Construction, Packaging, Electrical & Electronics, Automotive, Healthcare | Building & Construction (74.2% share, 2025) | Automotive (4.50% CAGR) |
| Region | Asia-Pacific, North America, Europe, South America, Middle East & Africa | Asia-Pacific (63.5% share, 2025) | Asia-Pacific (4.53% CAGR) |
Market Segmentation Overview
By Product Type
| Sub-Segment | Key Trend |
| Rigid PVC | Continued dominance in pipe extrusion and window profile systems, driven by durability and cost advantages |
| Flexible PVC | Gradual shift toward non-phthalate plasticizers reshaping formulation economics for cable and medical applications |
| Chlorinated PVC (CPVC) | Rising adoption in hot-water plumbing and industrial corrosion-resistant piping, particularly in APAC |
Rigid PVC remains the volumetric anchor of the global market, while CPVC is carving out specialty growth driven by higher heat-deflection performance that standard PVC cannot match in pressurized hot-water systems.
By Manufacturing Process
| Sub-Segment | Key Trend |
| Suspension PVC | Dominant general-purpose process with broad particle-size flexibility for extrusion and calendering |
| Emulsion PVC | Growing paste-grade demand from automotive coatings, artificial leather, and rotational molding |
| Bulk / Mass PVC | Niche transparent-grade applications for bottles and specialty rigid packaging |
Suspension polymerization's scale economics keep it unchallenged for commodity resin production, but emulsion PVC's higher value-add per ton makes it attractive for margin-conscious producers diversifying their portfolios.
By Stabilizer Type
| Sub-Segment | Key Trend |
| Calcium-Based Stabilizers | Regulatory-driven adoption as the lead-free standard across Europe and increasingly in APAC |
| Lead-Based Stabilizers | Declining globally under regulatory phase-outs; legacy use persists in select developing markets |
| Organotin Stabilizers | Fastest growth fueled by demand for optically clear rigid packaging and food-contact bottles |
| Mixed-Metal Stabilizers | Cost-effective mid-tier option for general-purpose compounding in price-sensitive markets |
The stabilizer landscape is undergoing a generational shift as calcium-zinc systems replace lead across virtually all major producing regions, supported by both regulation and buyer procurement standards.
By Application
| Sub-Segment | Key Trend |
| Pipes and Fittings | Backbone of municipal water and sewerage infrastructure globally |
| Profiles and Tubes | Strong renovation demand for window frames and cable conduit in Europe and North America |
| Bottles and Packaging | Polyvinyl Chloride Market blister and medical packaging maintain steady demand |
| Films and Sheets | Agricultural mulch films and commercial signage drive regional demand spikes |
| Wires and Cables | EV wire-harness insulation creating new growth vectors |
Pipes and fittings will continue absorbing the largest share of PVC output through 2035, but wire and cable applications are gaining momentum as electrification trends intensify across transportation and renewable energy.
By End-User Industry
| Sub-Segment | Key Trend |
| Building and Construction | Dominant end-user consuming nearly three-quarters of global PVC output |
| Packaging | Stable pharmaceutical and food-contact packaging demand |
| Electrical and Electronics | Cable insulation and conduit systems for expanding grid infrastructure |
| Automotive | Fastest-growing end-user driven by EV lightweighting and interior-trim substitution |
| Healthcare | Phthalate-free medical tubing and blood-bag procurement standards reshaping supplier qualification |
Building and construction's overwhelming share makes PVC market dynamics highly correlated with global construction cycles, while automotive's rapid growth rate signals meaningful diversification potential over the forecast period.