ID: MRFR/Pharma/4834-HCR | | Region: Global | 100 pages
Market Scenario
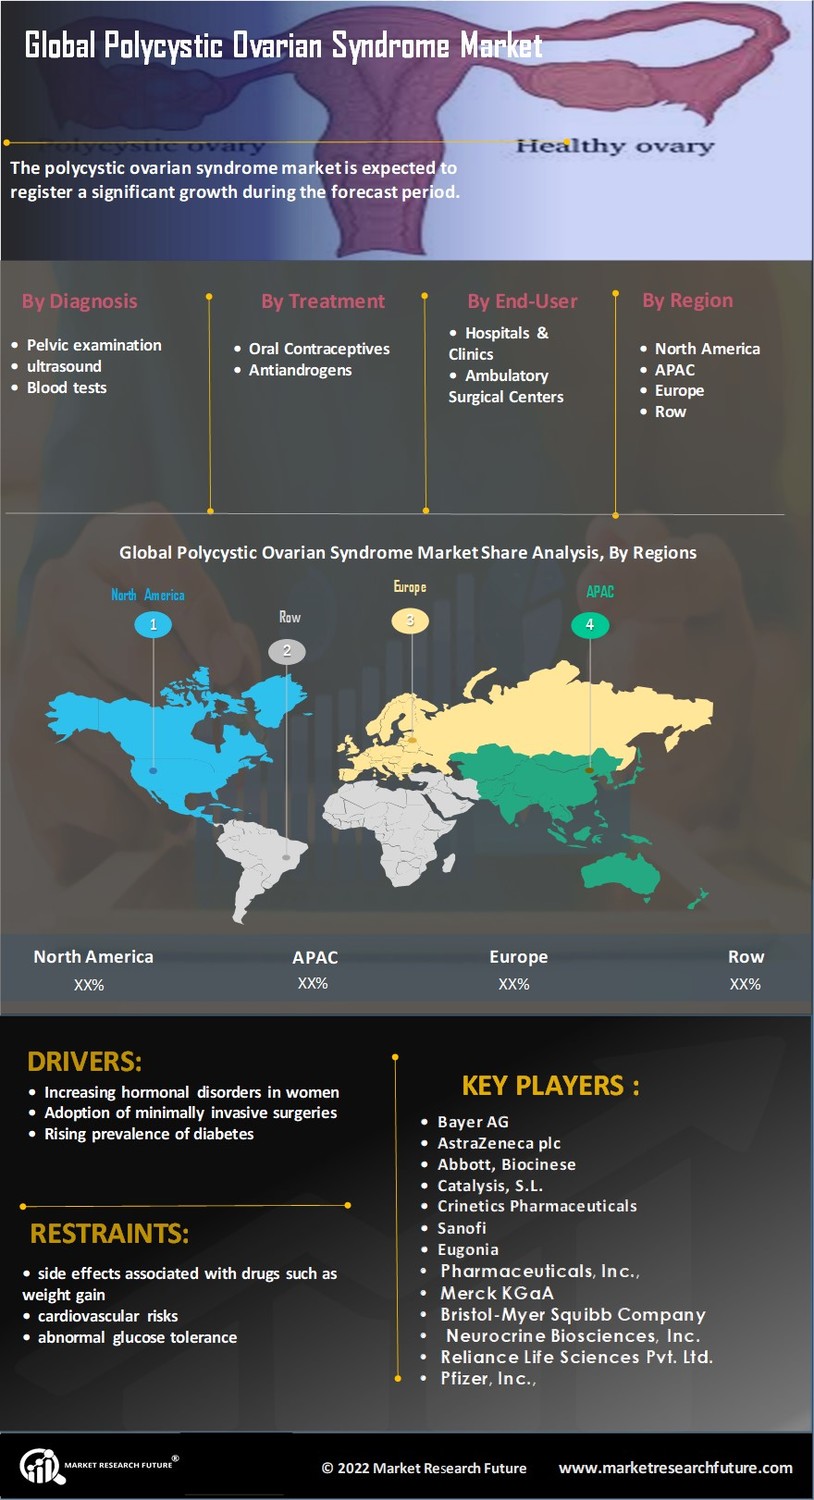
Polycystic Ovary Syndrome (PCOS) is a medical condition where the women of reproductive age suffer from hormonal disorders. This is due to an increase in levels of male hormones in the body which leads to an irregular menstrual cycle. Women experience symptoms such as irregular menstrual cycle, increase in facial hair growth, acne, thinning hair or hair loss on the scalp, weight gain, darkening of skin and others. Polycystic Ovary Syndrome (PCOS) is caused due to high levels of androgens, excess insulin, low-grade inflammation, cysts in the ovaries, and genetic disorders.
The polycystic ovarian syndrome market is expected to witness tremendous growth owing to the rising prevalence of polycystic ovarian syndrome. According to the Centers for Disease Control and Prevention, approximately 5 million women of reproductive age suffer from the polycystic ovarian syndrome.
Other key factors such as the growing obesity among women, rising prevalence of diabetes, increasing hormonal disorders in women, change in sedentary lifestyle, socioeconomic factors, growing consumption of unhealthy diet, and others are contributing towards the growth of the market. Diabetes is another risk factor that leads to the development of the polycystic ovarian syndrome. Such factors contribute to polycystic ovarian syndrome among women.
However, factors such as side effects associated with drugs such as weight gain, cardiovascular risks, increase insulin resistance, abnormal glucose tolerance, and thromboembolic events are expected to restrict the market growth during the forecast period.
Segmentation
The global polycystic ovarian syndrome market is segmented on the basis of diagnosis, treatment, and end-user. The polycystic ovarian syndrome market, by diagnosis, is categorized into the pelvic examination, transvaginal ultrasound, and blood tests. Blood tests are further sub-segmented into hormone levels, glucose tolerance and cholesterol and triglyceride levels. On the basis of treatment, the market is segmented into oral contraceptives, antiandrogens, insulin-sensitizing agents, antidepressant, anti-obesity, and surgery. The surgery category includes ovarian wedge resection and laparoscopic ovarian drilling. On the basis of end-user, the market is segmented into hospitals and clinics, ambulatory surgical centers, diagnostic centers, gynecology centers, feminist health centers, and others.
On the basis of region, the global polycystic ovarian syndrome market is segmented into the Americas, Europe, Asia-Pacific, and the Middle East and Africa. The Americas is sub-segmented into North America and South America. The North American region is further segmented into the US and Canada. The European region is divided into two, namely, Western Europe and Eastern Europe. Western Europe is further classified into Germany, Italy, France, the UK, Spain, and the rest of Western Europe. The Asia-Pacific region is sub-segmented into Japan, China, India, Australia, the Republic of Korea, and the rest of Asia-Pacific. The Middle Eastern and African region is sub-segmented into the United Arab Emirates, Saudi Arabia, Oman, Kuwait, Qatar, and the rest of the Middle East and Africa.
Key players
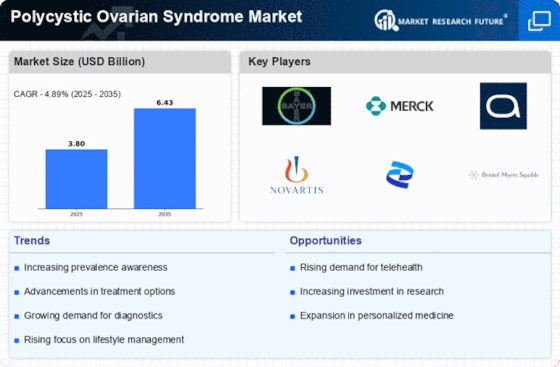
Some of the key players in the global polycystic ovarian syndrome market are Bayer AG, AstraZeneca plc, Abbott, Biocinese, Catalysis, S.L., Crinetics Pharmaceuticals, Inc., Sanofi, Eugonia, EffRx, Inc., Ferring Pharmaceuticals, Inc., Merck KGaA, Bristol-Myer Squibb Company, Neurocrine Biosciences, Inc., Reliance Life Sciences Pvt. Ltd. Pfizer, Inc., Novartis AG, and Shire Plc.
Regional Market Summary
Global Polycystic Ovarian Syndrome Market Share (%), by Region, 2017
Sources: Center for Disease Control and Prevention, Office on Women's Health, Office of the Assistant Secretary for Health, US Department of Health and Human Services.
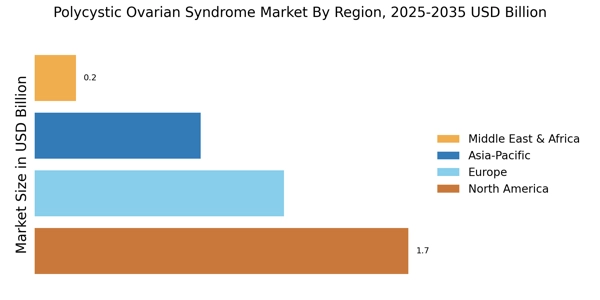
The polycystic ovarian syndrome market is dominated by North America owing to the rising obesity. According to the Institute for Health Metrics and Evaluation (IHME), 60% of women were obese or overweight in 2013. Other factors such as increasing healthcare expenditure, increasing technological advancements, and adoption of minimally invasive surgeries drive the market growth in this region.
It is estimated that Europe was the second largest in the global polycystic ovarian syndrome market owing to the increasing prevalence of diabetes, obesity, and increasing research activities in the health industry in this region. According to the German Federal Ministry of Health in 2014 and 2015, 7.0% of women of age 18 and more suffered from diabetes in Germany. Thus, the increasing prevalence of diabetes in this region influences the growth of this market in this region.
Asia-Pacific was projected to be the fastest growing region for the global polycystic ovarian syndrome market in 2017. The market is expected to witness growth owing to the rising prevalence of diabetes in women, changing lifestyle, and growing obesity within the female population. This provides favorable backgrounds for the market to grow.
The Middle East and Africa holds the least share in the global polycystic ovarian syndrome market due to the presence of stringent government policies and poor economies. However, the market is expected to witness growth due to the rising healthcare expenditure, growing private sector in the healthcare domain, and insurance coverage in the Middle East.
Market Segmentation and Key Market Players
Global Polycystic Ovarian Syndrome Market, by Diagnosis
Global Polycystic Ovarian Syndrome Market, by Treatment
Global Polycystic Ovarian Syndrome Market, by End-User
Global Polycystic Ovarian Syndrome Market, by Region
Intended Audience
Frequently Asked Questions (FAQ) :
North America is expected to lead the Polycystic Ovarian Syndrome Market.
Increasing prevalence of diabetes and rising hormonal disorders among women is adding market growth.
Certain side effects may limit market growth.
Different end use industries of Polycystic Ovarian Syndrome Market include feminist health centers, gynecology centers, hospitals and clinics, and others.
Different strategies used by industry players to create a dominance in the Polycystic Ovarian Syndrome Market include mergers, collaborations, strategic alliances, and product launches.
TABLE OF CONTENT
CHAPTER 1. REPORT PROLOGUE
CHAPTER 2. MARKET INTRODUCTION
2.1 DEFINITION
2.2 SCOPE OF THE STUDY
2.2.1 RESEARCH OBJECTIVE
2.2.2 ASSUMPTIONS
2.2.3 LIMITATIONS
CHAPTER 3. RESEARCH METHODOLOGY
3.1 INTRODUCTION
3.2 PRIMARY RESEARCH
3.3 SECONDARY RESEARCH
3.4 MARKET SIZE ESTIMATION
CHAPTER 4. MARKET DYNAMICS
4.1 DRIVERS
4.2 RESTRAINTS
4.3 OPPORTUNITIES
4.4 CHALLENGES
4.5 MACROECONOMIC INDICATORS
4.6 TECHNOLOGY TRENDS & ASSESSMENT
CHAPTER 5. MARKET FACTOR ANALYSIS
5.1 PORTER’S FIVE FORCES ANALYSIS
5.1.1 BARGAINING POWER OF SUPPLIERS
5.1.2 BARGAINING POWER OF BUYERS
5.1.3 THREAT OF NEW ENTRANTS
5.1.4 THREAT OF SUBSTITUTES
5.1.5 INTENSITY OF RIVALRY
5.2 VALUE CHAIN ANALYSIS
5.3 INVESTMENT FEASIBILITY ANALYSIS
5.4 PRICING ANALYSIS
CHAPTER 6. GLOBAL POLYCYSTIC OVARIAN SYNDROME MARKET, BY DIAGNOSIS
6.1 INTRODUCTION
6.2 PELVIC EXAMINATION
6.3 TRANSVAGINAL ULTRASOUND
6.4 BLOOD TESTS
6.4.1 HORMONE LEVELS
6.4.2 GLUCOSE TOLERANCE
6.4.3 CHOLESTEROL AND TRIGLYCERIDE LEVELS
7. GLOBAL POLYCYSTIC OVARIAN SYNDROME MARKET, BY TREATMENT
7.1 INTRODUCTION
7.2 ORAL CONTRACEPTIVES
7.3 ANTIANDROGENS
7.4 INSULIN SENSITIZING AGENT
7.5 ANTIDEPRESSANT
7.6 ANTI-OBESITY
7.7 SURGERY
7.7.1 OVARIAN WEDGE RESECTION
7.7.2 LAPAROSCOPIC OVARIAN DRILLING
CHAPTER 8. GLOBAL POLYCYSTIC OVARIAN SYNDROME MARKET, BY END-USER
8.1 INTRODUCTION
8.2 HOSPITALS & CLINICS
8.3 AMBULATORY SURGICAL CENTERS
8.4 DIAGNOSTIC CENTERS
8.5 GYNECOLOGY CENTERS
8.6 FEMINIST HEALTH CENTERS
CHAPTER 9. GLOBAL POLYCYSTIC OVARIAN SYNDROME MARKET, BY REGION
9.1 INTRODUCTION
9.2 AMERICA
9.2.1 NORTH AMERICA
9.2.1.1 US
9.2.1.2 CANADA
9.2.2 SOUTH AMERICA
9.3 EUROPE
9.3.1 WESTERN EUROPE
9.3.1.1 GERMANY
9.3.1.2 FRANCE
9.3.1.3 ITALY
9.3.1.4 SPAIN
9.3.1.5 UK
9.3.1.6 REST OF WESTERN EUROPE
9.3.2 EASTERN EUROPE
9.4 ASIA-PACIFIC
9.4.1 JAPAN
9.4.2 CHINA
9.4.3 INDIA
9.4.4 AUSTRALIA
9.4.5 REPUBLIC OF KOREA
9.4.6 REST OF ASIA-PACIFIC
9.5 MIDDLE EAST & AFRICA
9.5.1 UNITED ARAB EMIRATES
9.5.2 SAUDI ARABIA
9.5.3 OMAN
9.5.4 KUWAIT
9.5.5 QATAR
9.5.6 REST OF THE MIDDLE EAST & AFRICA
CHAPTER 10. COMPANY LANDSCAPE
10.1 INTRODUCTION
10.2 MARKET SHARE ANALYSIS
10.3 KEY DEVELOPMENT & STRATEGIES
10.3.1 KEY DEVELOPMENTS
CHAPTER 11 COMPANY PROFILES
11.1 BAYER AG
11.1.1 COMPANY OVERVIEW
11.1.2 TYPE OVERVIEW
11.1.3 FINANCIALS
11.2.4 KEY DEVELOPMENTS
11.1.5 SWOT ANALYSIS
11.2 ASTRAZENECA PLC
11.2.1 COMPANY OVERVIEW
11.2.2 TYPE OVERVIEW
11.2.3 FINANCIAL OVERVIEW
11.2.4 KEY DEVELOPMENTS
11.2.5 SWOT ANALYSIS
11.3 ABBOTT
11.3.1 COMPANY OVERVIEW
11.3.2 TYPE OVERVIEW
11.3.3 FINANCIAL OVERVIEW
11.3.4 KEY DEVELOPMENT
11.3.5 SWOT ANALYSIS
11.4 BIOCINESE
11.4.1 COMPANY OVERVIEW
11.4.2 TYPE/BUSINESS SEGMENT OVERVIEW
11.4.3 FINANCIAL OVERVIEW
11.4.4 KEY DEVELOPMENT
11.4.5 SWOT ANALYSIS
11.5 CATALYSIS
11.5.1 COMPANY OVERVIEW
11.5.2 TYPE OVERVIEW
11.5.3 FINANCIAL OVERVIEW
11.5.4 KEY DEVELOPMENTS
11.5.5 SWOT ANALYSIS
11.6 CRINETICS PHARMACEUTICALS, INC
11.6.1 COMPANY OVERVIEW
11.6.2 TYPE OVERVIEW
11.6.3 FINANCIAL OVERVIEW
11.6.4 KEY DEVELOPMENTS
11.6.5 SWOT ANALYSIS
11.7 SANOFI.
11.7.1 OVERVIEW
11.7.2 TYPE OVERVIEW
11.7.3 FINANCIALS
11.7.4 KEY DEVELOPMENTS
11.7.5 SWOT ANALYSIS
11.8 EUGONIA
11.8.1 OVERVIEW
11.8.2 TYPE OVERVIEW
11.8.3 FINANCIALS
11.8.4 KEY DEVELOPMENTS
11.8.5 SWOT ANALYSIS
11.9 EFFRX, INC.
11.9.1 OVERVIEW
11.9.2 TYPE OVERVIEW
11.9.3 FINANCIALS
11.9.4 KEY DEVELOPMENTS
11.9.5 SWOT ANALYSIS
11.10 FERRING PHARMACEUTICALS, INC
11.10.1 OVERVIEW
11.10.2 TYPE OVERVIEW
11.10.3 FINANCIALS
11.10.4 KEY DEVELOPMENTS
11.10.5 SWOT ANALYSIS
11.11 MERCK KGAA
11.11.1 OVERVIEW
11.11.2 TYPE OVERVIEW
11.11.3 FINANCIALS
11.11.4 KEY DEVELOPMENTS
11.11.5 SWOT ANALYSIS
11.12 BRISTOL-MYER SQUIBB COMPANY
11.12.1 OVERVIEW
11.12.2 TYPE OVERVIEW
11.12.3 FINANCIALS
11.12.4 KEY DEVELOPMENTS
11.12.5 SWOT ANALYSIS
11.13 NEUROCRINE BIOSCIENCES
11.13.1 OVERVIEW
11.13.2 TYPE OVERVIEW
11.13.3 FINANCIALS
11.13.4 KEY DEVELOPMENTS
11.13.5 SWOT ANALYSIS
11.14 RELIANCE LIFE SCIENCES PVT. LTD
11.14.1 OVERVIEW
11.14.2 TYPE OVERVIEW
11.14.3 FINANCIALS
11.14.4 KEY DEVELOPMENTS
11.14.5 SWOT ANALYSIS
11.15 PFIZER, INC
11.14.1 OVERVIEW
11.14.2 TYPE OVERVIEW
11.14.3 FINANCIALS
11.14.4 KEY DEVELOPMENTS
11.14.5 SWOT ANALYSIS
11.15 OTHERS
CHAPTER 12 APPENDIX
LIST OF TABLES
TABLE 1 POLYCYSTIC OVARIAN SYNDROME MARKET INDUSTRY SYNOPSIS, 2020–2027
TABLE 2 GLOBAL POLYCYSTIC OVARIAN SYNDROME MARKET ESTIMATES & FORECAST, 2020–2027, (USD MILLION)
TABLE 3 GLOBAL POLYCYSTIC OVARIAN SYNDROME MARKET, BY REGION, 2020–2027, (USD MILLION)
TABLE 4 GLOBAL POLYCYSTIC OVARIAN SYNDROME MARKET, BY DIAGNOSIS, 2020–2027, (USD MILLION)
TABLE 5 GLOBAL POLYCYSTIC OVARIAN SYNDROME MARKET, BY TREATMENT, 2020–2027, (USD MILLION)
TABLE 6 GLOBAL POLYCYSTIC OVARIAN SYNDROME MARKET, BY END-USER, 2020–2027, (USD MILLION)
TABLE 7 NORTH AMERICA POLYCYSTIC OVARIAN SYNDROME MARKET, BY DIAGNOSIS, 2020–2027, (USD MILLION)
TABLE 8 NORTH AMERICA POLYCYSTIC OVARIAN SYNDROME MARKET, BY TREATMENT, 2020–2027, (USD MILLION)
TABLE 9 NORTH AMERICA POLYCYSTIC OVARIAN SYNDROME MARKET, BY END-USER, 2020–2027, (USD MILLION)
TABLE 10 US POLYCYSTIC OVARIAN SYNDROME MARKET, BY DIAGNOSIS, 2020–2027, (USD MILLION)
TABLE 11 US POLYCYSTIC OVARIAN SYNDROME MARKET, BY TREATMENT, 2020–2027, (USD MILLION)
TABLE 12 US POLYCYSTIC OVARIAN SYNDROME MARKET, BY END-USER, 2020–2027, (USD MILLION)
TABLE 13 CANADA POLYCYSTIC OVARIAN SYNDROME MARKET, BY DIAGNOSIS, 2020–2027, (USD MILLION)
TABLE 14 CANADA POLYCYSTIC OVARIAN SYNDROME MARKET, BY TREATMENT, 2020–2027, (USD MILLION)
TABLE 15 CANADA POLYCYSTIC OVARIAN SYNDROME MARKET, BY END-USER, 2020–2027, (USD MILLION)
TABLE 16 SOUTH AMERICA POLYCYSTIC OVARIAN SYNDROME MARKET, BY DIAGNOSIS, 2020–2027, (USD MILLION)
TABLE 17 SOUTH AMERICA POLYCYSTIC OVARIAN SYNDROME MARKET, BY TREATMENT, 2020–2027, (USD MILLION)
TABLE 18 SOUTH AMERICA POLYCYSTIC OVARIAN SYNDROME MARKET, BY END-USER, 2020–2027, (USD MILLION)
TABLE 19 EUROPE POLYCYSTIC OVARIAN SYNDROME MARKET, DIAGNOSIS, 2020–2027, (USD MILLION)
TABLE 20 EUROPE POLYCYSTIC OVARIAN SYNDROME MARKET, BY TREATMENT, 2020–2027, (USD MILLION)
TABLE 21 EUROPE POLYCYSTIC OVARIAN SYNDROME MARKET, BY END-USER, 2020–2027, (USD MILLION)
TABLE 22 WESTERN EUROPE POLYCYSTIC OVARIAN SYNDROME MARKET, BY DIAGNOSIS, 2020–2027, (USD MILLION)
TABLE 23 WESTERN EUROPE POLYCYSTIC OVARIAN SYNDROME MARKET, BY TREATMENT, 2020–2027, (USD MILLION)
TABLE 24 WESTERN EUROPE POLYCYSTIC OVARIAN SYNDROME MARKET, BY END-USER, 2020–2027, (USD MILLION)
TABLE 25 EASTERN EUROPE POLYCYSTIC OVARIAN SYNDROME MARKET, BY DIAGNOSIS, 2020–2027, (USD MILLION)
TABLE26 EASTERN EUROPE POLYCYSTIC OVARIAN SYNDROME MARKET, BY TREATMENT, 2020–2027, (USD MILLION)
TABLE 27 EASTERN EUROPE POLYCYSTIC OVARIAN SYNDROME MARKET, BY END-USER, 2020–2027, (USD MILLION)
TABLE 28 ASIA-PACIFIC POLYCYSTIC OVARIAN SYNDROME MARKET, BY DIAGNOSIS, 2020–2027, (USD MILLION)
TABLE 29 ASIA-PACIFIC POLYCYSTIC OVARIAN SYNDROME MARKET, BY TREATMENT, 2020–2027, (USD MILLION)
TABLE 30 ASIA-PACIFIC POLYCYSTIC OVARIAN SYNDROME MARKET, BY END-USER, 2020–2027, (USD MILLION)
TABLE 31 MIDDLE EAST & AFRICA POLYCYSTIC OVARIAN SYNDROME MARKET, BY DIAGNOSIS, 2020–2027, (USD MILLION)
TABLE 32 MIDDLE EAST & AFRICA POLYCYSTIC OVARIAN SYNDROME MARKET, BY TREATMENT, 2020–2027, (USD MILLION)
TABLE 33 MIDDLE EAST & AFRICA POLYCYSTIC OVARIAN SYNDROME MARKET, BY END-USER, 2020–2027, (USD MILLION)
LIST OF FIGURES
FIGURE 1 RESEARCH PROCESS
FIGURE 2 SEGMENTATION FOR GLOBAL POLYCYSTIC OVARIAN SYNDROME MARKET
FIGURE 3 MARKET DYNAMICS FOR GLOBAL POLYCYSTIC OVARIAN SYNDROME MARKET
FIGURE 4 GLOBAL POLYCYSTIC OVARIAN SYNDROME MARKET SHARE, BY DIAGNOSIS 2020
FIGURE 5 GLOBAL POLYCYSTIC OVARIAN SYNDROME MARKET SHARE, BY TREATMENT 2020
FIGURE 6 GLOBAL POLYCYSTIC OVARIAN SYNDROME MARKET SHARE, BY END-USER, 2020
FIGURE 7 GLOBAL POLYCYSTIC OVARIAN SYNDROME MARKET SHARE, BY REGION, 2020
FIGURE 8 NORTH AMERICA POLYCYSTIC OVARIAN SYNDROME MARKET SHARE, BY COUNTRY, 2020
FIGURE 9 EUROPE POLYCYSTIC OVARIAN SYNDROME MARKET SHARE, BY COUNTRY, 2020
FIGURE 10 ASIA-PACIFIC POLYCYSTIC OVARIAN SYNDROME MARKET SHARE, BY COUNTRY, 2020
FIGURE 11 MIDDLE EAST & AFRICA POLYCYSTIC OVARIAN SYNDROME MARKET SHARE, BY COUNTRY, 2020
FIGURE 12 GLOBAL POLYCYSTIC OVARIAN SYNDROME MARKET: COMPANY SHARE ANALYSIS, 2020 (%)
FIGURE 13 BAYER AG: KEY FINANCIALS
FIGURE 14 BAYER AG: SEGMENTAL REVENUE
FIGURE 15 BAYER AG: GEOGRAPHICAL REVENUE
FIGURE 16 ASTRAZENECA PLC: KEY FINANCIALS
FIGURE 17 ASTRAZENECA PLC: SEGMENTAL REVENUE
FIGURE 18 ASTRAZENECA PLC: GEOGRAPHICAL REVENUE
FIGURE 19 ABBOTT: KEY FINANCIALS
FIGURE 20 ABBOTT: SEGMENTAL REVENUE
FIGURE 21 ABBOTT: GEOGRAPHICAL REVENUE
FIGURE 22 BIOCINESE: KEY FINANCIALS
FIGURE 23 BIOCINESE: SEGMENTAL REVENUE
FIGURE 24 BIOCINESE: GEOGRAPHICAL REVENUE
FIGURE 25 CRINETICS PHARMACEUTICALS, INC: KEY FINANCIALS
FIGURE 26 CRINETICS PHARMACEUTICALS, INC: SEGMENTAL REVENUE
FIGURE 27 CRINETICS PHARMACEUTICALS, INC: GEOGRAPHICAL REVENUE
FIGURE 28 CATALYSIS: KEY FINANCIALS
FIGURE 29 CATALYSIS: SEGMENTAL REVENUE
FIGURE 30 CATALYSIS: GEOGRAPHICAL REVENUE
FIGURE 31 SANOFI: KEY FINANCIALS
FIGURE 32 SANOFI: SEGMENTAL REVENUE
FIGURE 33 SANOFI: GEOGRAPHICAL REVENUE
FIGURE 34 EUGONIA: KEY FINANCIALS
FIGURE 35 EUGONIA: SEGMENTAL REVENUE
FIGURE 36 EUGONIA: GEOGRAPHICAL REVENUE
FIGURE 37 EFFRX, INC.: KEY FINANCIALS
FIGURE 38 EFFRX, INC.: SEGMENTAL REVENUE
FIGURE 39 EFFRX, INC.: GEOGRAPHICAL REVENUE
FIGURE 40 FERRING PHARMACEUTICALS, INC: KEY FINANCIALS
FIGURE 41 FERRING PHARMACEUTICALS, INC: SEGMENTAL REVENUE
FIGURE 42 FERRING PHARMACEUTICALS, INC: GEOGRAPHICAL REVENUE
FIGURE 46 BRISTOL-MYER SQUIBB COMPANY: KEY FINANCIALS
FIGURE 47 BRISTOL-MYER SQUIBB COMPANY: SEGMENTAL REVENUE
FIGURE 48 BRISTOL-MYER SQUIBB COMPANY: GEOGRAPHICAL REVENUE
FIGURE 49 NEUROCRINE BIOSCIENCES: KEY FINANCIALS
FIGURE 50 NEUROCRINE BIOSCIENCES: SEGMENTAL REVENUE
FIGURE 51 NEUROCRINE BIOSCIENCES: GEOGRAPHICAL REVENUE
FIGURE 52 C.R. BARD: KEY FINANCIALS
FIGURE 53 C.R. BARD: SEGMENTAL REVENUE
FIGURE 54 C.R. BARD: GEOGRAPHICAL REVENUE
FIGURE 55 RELIANCE LIFE SCIENCES PVT. LTD: KEY FINANCIALS
FIGURE 56 RELIANCE LIFE SCIENCES PVT. LTD: SEGMENTAL REVENUE
FIGURE 57 RELIANCE LIFE SCIENCES PVT. LTD: GEOGRAPHICAL REVENUE
FIGURE 58 PFIZER, INC: KEY FINANCIALS
FIGURE 59 PFIZER, INC: SEGMENTAL REVENUE
FIGURE 60 PFIZER, INC: GEOGRAPHICAL REVENUE