ID: MRFR/F-B & N/3678-HCR | February 2021 | Region: Global | 90 pages
Market Scenario
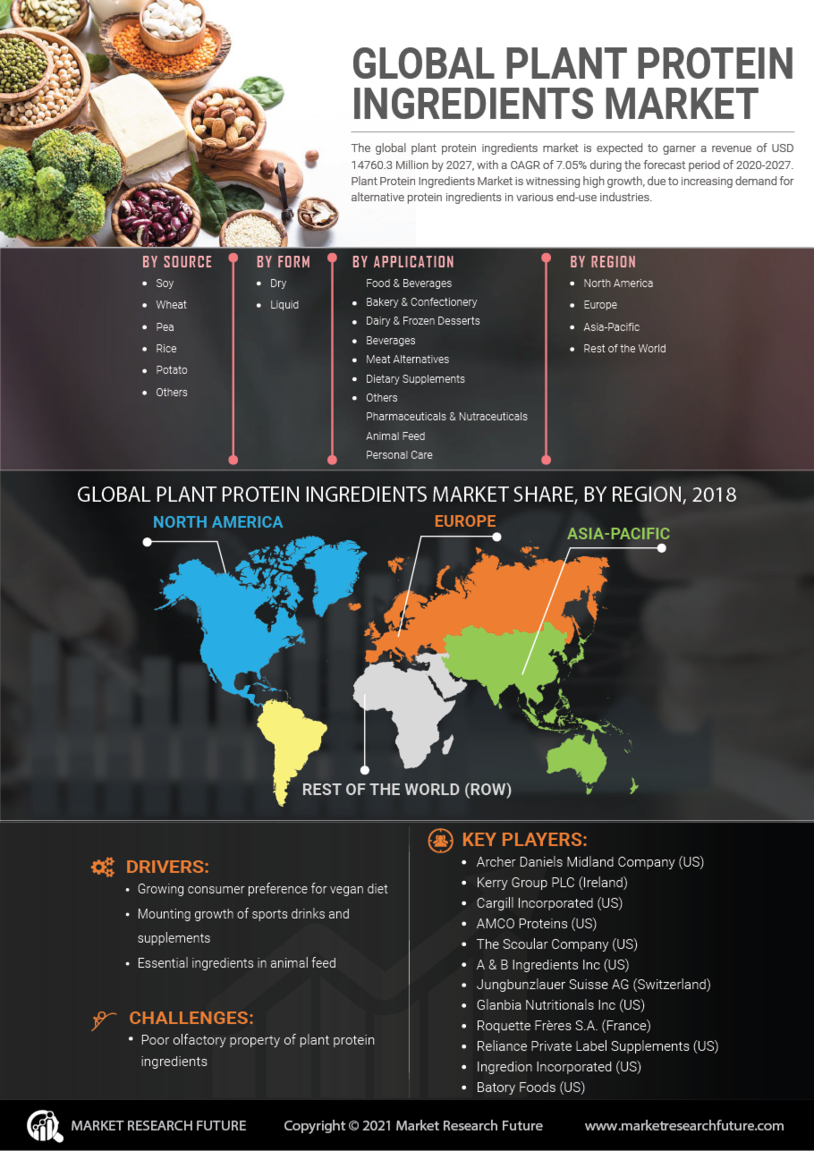
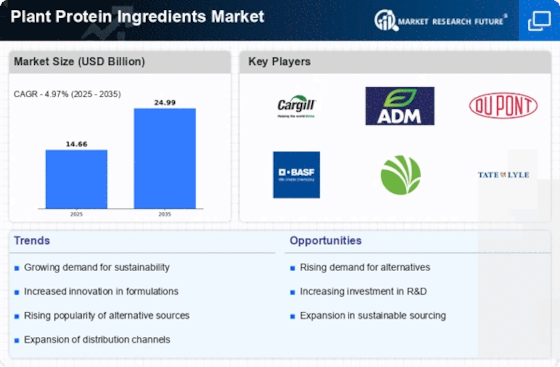
Plant Protein Ingredients Market is witnessing high growth, due to increasing demand for alternative protein ingredients in various end-use industries. At the same time, new product launches along with extensive research and development by the key players are driving the growth of the global plant protein ingredients market.
One of the significant reasons for increasing growth of plant protein ingredients is due to growing health awareness towards the benefits of plant protein ingredients among consumers. Furthermore, due to altering eating patterns of consumers and growing adoption of veganism and vegetarianism is expected to increase the usage of plant-based protein ingredients in various food products. Also, higher consumption of fat and carbohydrate-rich foods among the population has led to protein deficiency. Thus, as consumers are getting aware of it, the demand for protein-rich food is increasing.
The global plant protein ingredients market is expected to garner a revenue of USD 15.65 billion by 2024, with a CAGR of 7.1% during the forecast period of 2019–2024.
Plant protein ingredients are gaining acceptance globally, owing to increasing health concerns among the population. Also, due to increasing costs of healthcare, consumers are inclining towards plant protein ingredients to stay healthy. The increasing awareness among the consumers regarding harmful effects on environment due to increasing meat consumption.
Rising demand for functional food and beverages is also indicating the growth of plant protein ingredients. Additionally, strategic initiatives undertaken by the major market players will surge the growth of the market.
Segmentation
The global plant protein ingredients market has been segmented based on source, form, application, and region.
By source, the global plant protein ingredients market has been classified as soy, wheat, pea, rice, potato, and others. Soy segment holds the major market share in global plant protein ingredients market, and the same segment is expected to be the fastest-growing segment.
Based on form, the global plant protein ingredients market has been bifurcated into dry and liquid. The dry segment holds the larger market share in the global plant protein ingredients market, and the same segment is expected to register the higher CAGR during the review period.
The global plant protein ingredients market has been categorized, based on application, as Food & beverages, pharmaceuticals & nutraceuticals, animal feed, and personal care. Food & beverages segment is further segregated into bakery & confectionery, dairy & frozen desserts, beverages, meat alternatives, dietary supplements, and others. The food & beverages segment is expected to account for the largest revenue share of the market. However, the pharmaceuticals & nutraceuticals segment is expected to exhibit a higher growth rate during the forecast period of 2019 to 2024.
The global plant protein ingredients market has been studied about four key regions—North America, Europe, Asia-Pacific, and the rest of the world.
The North American plant protein ingredients market has further been segmented into the US, Canada, and Mexico. The European plant protein ingredients market has been classified as the UK, Germany, France, Italy, Spain, and the rest of Europe. The plant protein ingredients market in Asia-Pacific has been divided into China, India, Japan, Australia & New Zealand, and the rest of Asia-Pacific. The plant protein ingredients market in the rest of the world has been segmented into South America, the Middle East, and Africa.
Key Players
Archer Daniels Midland Company (US)
Kerry Group PLC (Ireland)
Cargill Incorporated (US)
AMCO Proteins (US)
The Scoular Company (US)
A & B Ingredients Inc (US)
Jungbunzlauer Suisse AG (Switzerland)
Glanbia Nutritionals Inc (US)
Roquette Frères S.A. (France)
Reliance Private Label Supplements (US)
Ingredion Incorporated (US)
Batory Foods (US)
Cambridge Commodities Inc (UK)
PLT Health Solutions (US)
Axiom Foods, Inc. (US)
Regional Market Summary
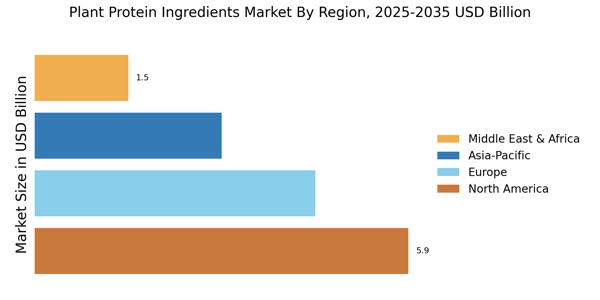
North America accounted for the largest market share in 2018. The region’s dominance and growth can be attributed to the increasing consumption of healthy food and beverages among health-conscious people. Additionally, growing adoption of veganism among consumers in the US and Canada is increasing the demand for vegan protein ingredients. Asia-Pacific is expected to be the fastest-growing region in the plant protein ingredients market. Rising demand for alternative for animal protein is majorly driving the growth of plant protein ingredients market in this region.
Global Plant Protein Ingredients Market, by Source
Soy
Wheat
Pea
Rice
Potato
Others
Global Plant Protein Ingredients Market, by Form
Dry
Liquid
Global Plant Protein Ingredients Market, by Application
Food & Beverages
Bakery & Confectionery
Dairy & Frozen Desserts
Beverages
Meat Alternatives
Dietary Supplements
Others
Pharmaceuticals & Nutraceuticals
Animal Feed
Personal Care
Global Plant Protein Ingredients Market, by Region
North America
US
Canada
Mexico
Europe
Germany
France
Italy
Spain
UK
Rest of Europe
Asia-Pacific
Japan
China
India
Australia & New Zealand
Rest of Asia-Pacific
Rest of the World (RoW)
South America
Middle East
Africa
Intended Audience
Plant protein ingredients manufacturers
Functional foods & beverages industry
Raw material suppliers
Retailers and wholesaler
Traders, importers, and exporters
Table of Contents
1. 1 EXECUTIVE SUMMARY
1.1. Market Attractiveness Analysis
1.1.1. Global Plant Protein Ingredients Market, by Source
1.1.2. Global Plant Protein Ingredients Market, by Form
1.1.3. Global Plant Protein Ingredients Market, by Application
1.1.4. Global Plant Protein Ingredients Market, by Region
2. MARKET INTRODUCTION
2.1. Definition
2.2. Scope of the Study
2.3. Market Structure
2.4. Key Buying Criteria
2.5. Macro Factor Indicator Analysis
3. Impact of COVID-19 on the market
3.1 Impact on raw material availability
3.2 Impact on supply chain
3.3 Impact on product pricing
3.4 Impact on store-based vs online sales
3.5 Impact on buying decision of customers/consumers
3.6 Impact on end-use industries
4. RESEARCH METHODOLOGY
4.1. Research Process
4.2. Primary Research
4.3. Secondary Research
4.4. Market Size Estimation
4.5. Forecast Model
4.6. List of Assumptions
5. MARKET DYNAMICS
5.1. Introduction
5.2. Drivers
5.2.1. Driver 1
5.2.2. Driver 2
5.3. Restraints
5.3.1. Restraint 1
5.3.2. Restraint 2
5.4. Opportunities
5.4.1. Opportunity 1
5.4.2. Opportunity 2
5.5. Challenges
5.5.1. Challenge 1
5.5.2. Challenge 2
6. MARKET FACTOR ANALYSIS
6.1. Value Chain Analysis
6.2. Supply Chain Analysis
6.3. Porter’s Five Forces Model
6.3.1. Bargaining Power of Suppliers
6.3.2. Bargaining Power of Buyers
6.3.3. Threat of New Entrants
6.3.4. Threat of Substitutes
6.3.5. Intensity of Rivalry
7. GLOBAL PLANT PROTEIN INGREDIENTS MARKET, BY SOURCE
7.1. Introduction
7.2. Soy
7.2.1. Soy: Market Estimates & Forecast, by Region/Country, 2019–2024
7.3. Wheat
7.3.1. Wheat: Market Estimates & Forecast, by Region/Country, 2019–2024
7.4. Pea
7.4.1. Pea: Market Estimates & Forecast, by Region/Country, 2019–2024
7.5. Rice
7.5.1. Rice: Market Estimates & Forecast, by Region/Country, 2019–2024
7.6. Potato
7.6.1. Potato: Market Estimates & Forecast, by Region/Country, 2019–2024
7.7. Others
7.7.1. Others: Market Estimates & Forecast, by Region/Country, 2019–2024
8. GLOBAL PLANT PROTEIN INGREDIENTS MARKET, BY FORM
8.1. Introduction
8.2. Dry
8.2.1. Dry: Market Estimates & Forecast, by Region/Country, 2019–2024
8.3. Liquid
8.3.1. Liquid: Market Estimates & Forecast, by Region/Country, 2019–2024
9. GLOBAL PLANT PROTEIN INGREDIENTS MARKET, BY APPLICATION
9.1. Introduction
9.2. Food & Beverages
9.2.1. Food & Beverages: Market Estimates & Forecast, by Country, 2019–2024
9.2.2. Bakery & Confectionary
9.2.2.1. Bakery & Confectionary: Market Estimates & Forecast, by Country, 2019–2024
9.2.3. Dairy & Frozen Desserts
9.2.3.1. Dairy & Frozen Desserts: Market Estimates & Forecast, by Country, 2019–2024
9.2.4. Beverages
9.2.4.1. Beverages: Market Estimates & Forecast, by Country, 2019–2024
9.2.5. Meat Alternatives
9.2.5.1. Meat Alternatives: Market Estimates & Forecast, by Country, 2019–2024
9.2.6. Dietary Supplements
9.2.6.1. Dietary Supplements: Market Estimates & Forecast, by Country, 2019–2024
9.2.7. Others
9.2.7.1. Others: Market Estimates & Forecast, by Country, 2019–2024
9.3. Pharmaceuticals & Nutraceuticals
9.3.1. Pharmaceuticals & Nutraceuticals: Market Estimates & Forecast, by Region/Country, 2019–2024
9.4. Animal Feed
9.4.1. Animal Feed: Market Estimates & Forecast, by Region/Country, 2019–2024
9.5. Personal Care
9.5.1. Personal Care: Market Estimates & Forecast, by Region/Country, 2019–2024
10. GLOBAL PLANT PROTEIN INGREDIENTS MARKET, BY REGION
10.1. Introduction
10.2. North America
10.2.1. Market Estimates & Forecast, by Source, 20110–2024
10.2.2. Market Estimates & Forecast, by Form, 2019–2024
10.2.3. Market Estimates & Forecast, by Application, 2019–2024
10.2.4. Market Estimates & Forecast, by Country, 2019–2024
10.2.5. US
10.2.5.1. Market Estimates & Forecast, by Source, 2019–2024
10.2.5.2. Market Estimates & Forecast, by Form, 2019–2024
10.2.5.3. Market Estimates & Forecast, by Application, 2019–2024
10.2.6. Canada
9.2.6.1. Market Estimates & Forecast, by Source, 2019–2024
10.2.6.2. Market Estimates & Forecast, by Form, 2019–2024
10.2.6.3. Market Estimates & Forecast, by Application, 2019–2024
10.2.7. Mexico
10.2.7.1. Market Estimates & Forecast, by Source, 2019–2024
10.2.7.2. Market Estimates & Forecast, by Form, 2019–2024
10.2.7.3. Market Estimates & Forecast, by Application, 2019–2024
10.3. Europe
10.3.1. Market Estimates & Forecast, by Source, 2019–2024
10.3.2. Market Estimates & Forecast, by Form, 2019–2024
10.3.3. Market Estimates & Forecast, by Application, 2019–2024
10.3.4. Market Estimates & Forecast, by Country, 2019–2024
10.3.5. Germany
10.3.5.1. Market Estimates & Forecast, by Source, 2019–2024
10.3.5.2. Market Estimates & Forecast, by Form, 2019–2024
10.3.5.3. Market Estimates & Forecast, by Application, 2019–2024
10.3.6. UK
10.3.6.1. Market Estimates & Forecast, by Source, 2019–2024
10.3.6.2. Market Estimates & Forecast, by Form, 2019–2024
10.3.6.3. Market Estimates & Forecast, by Application, 2019–2024
10.3.7. France
9.3.7.1. Market Estimates & Forecast, by Source, 2019–2024
10.3.7.2. Market Estimates & Forecast, by Form, 2019–2024
10.3.7.3. Market Estimates & Forecast, by Application, 2019–2024
10.3.8. Spain
10.3.8.1. Market Estimates & Forecast, by Source, 2019–2024
10.3.8.2. Market Estimates & Forecast, by Form, 2019–2024
10.3.8.3. Market Estimates & Forecast, by Application, 2019–2024
10.3.9. Italy
10.3.10.1. Market Estimates & Forecast, by Source, 2019–2024
10.3.10.2. Market Estimates & Forecast, by Form, 2019–2024
10.3.10.3. Market Estimates & Forecast, by Application, 2019–2024
10.3.10. Rest of Europe
10.3.10.1. Market Estimates & Forecast, by Source, 2019–2024
10.3.10.2. Market Estimates & Forecast, by Form, 2019–2024
10.3.10.3. Market Estimates & Forecast, by Application, 2019–2024
10.4. Asia-Pacific
10.4.1. Market Estimates & Forecast, by Source, 2019–2024
10.4.2. Market Estimates & Forecast, by Form, 2019–2024
10.4.3. Market Estimates & Forecast, by Application, 2019–2024
10.4.4. Market Estimates & Forecast, by Country, 2019–2024
10.4.5. China
10.4.5.1. Market Estimates & Forecast, by Source, 2019–2024
10.4.5.2. Market Estimates & Forecast, by Form, 2019–2024
10.4.5.3. Market Estimates & Forecast, by Application, 2019–2024
10.4.6. Japan
10.4.6.1. Market Estimates & Forecast, by Source, 2019–2024
10.4.6.2. Market Estimates & Forecast, by Form, 2019–2024
10.4.6.3. Market Estimates & Forecast, by Application, 2019–2024
10.4.7. India
9.4.7.1. Market Estimates & Forecast, by Source, 20110–2024
10.4.7.2. Market Estimates & Forecast, by Form, 2019–2024
10.4.7.3. Market Estimates & Forecast, by Application, 2019–2024
10.4.8. Australia & New Zealand
10.4.8.1. Market Estimates & Forecast, by Source, 2019–2024
10.4.8.2. Market Estimates & Forecast, by Form, 2019–2024
10.4.8.3. Market Estimates & Forecast, by Application, 2019–2024
10.4.10. Rest of Asia-Pacific
10.4.10.1. Market Estimates & Forecast, by Source, 2019–2024
10.4.10.2. Market Estimates & Forecast, by Form, 2019–2024
10.4.10.3. Market Estimates & Forecast, by Application, 2019–2024
10.5. Rest of the World
10.5.1. Market Estimates & Forecast, by Source, 2019–2024
10.5.2. Market Estimates & Forecast, by Form, 2019–2024
10.5.3. Market Estimates & Forecast, by Application, 20110–2024
10.5.4. Market Estimates & Forecast, by Region, 2019–2024
10.5.5. South America
10.5.5.1. Market Estimates & Forecast, by Source, 2019–2024
10.5.5.2. Market Estimates & Forecast, by Form, 2019–2024
10.5.5.3. Market Estimates & Forecast, by Application, 2019–2024
10.5.6. Middle East
10.5.6.1. Market Estimates & Forecast, by Source, 2019–2024
10.5.6.2. Market Estimates & Forecast, by Form, 2019–2024
10.5.6.3. Market Estimates & Forecast, by Application, 2019–2024
10.5.7. Africa
10.5.7.1. Market Estimates & Forecast, by Source, 2019–2024
10.5.7.2. Market Estimates & Forecast, by Form, 2019–2024
10.5.7.3. Market Estimates & Forecast, by Application, 2019–2024
11. COMPETITIVE LANDSCAPE
11.1. Introduction
11.2. Competitive Benchmarking
11.3. Development Share Analysis
11.4. Key Developments & Growth Strategies
12. COMPANY PROFILES
12.1. Archer Daniels Midland Company
12.1.1. Company Overview
12.1.2. Financial Overview
12.1.3. Products Offered
12.1.4. Key Developments
12.1.5. SWOT Analysis
12.1.6. Key Strategies
12.2. Kerry Group PLC
12.2.1. Company Overview
12.2.2. Financial Overview
12.2.3. Products Offered
12.2.4. Key Developments
12.2.5. SWOT Analysis
12.2.6. Key Strategies
12.3. Cargill Incorporated
12.3.1. Company Overview
12.3.2. Financial Overview
12.3.3. Products Offered
12.3.4. Key Developments
12.3.5. SWOT Analysis
12.3.6. Key Strategies
12.4. The Scoular Company
12.4.1. Company Overview
12.4.2. Financial Overview
12.4.3. Products Offered
12.4.4. Key Developments
12.4.5. SWOT Analysis
12.4.6. Key Strategies
12.5. A & B Ingredients Inc
12.5.1. Company Overview
12.5.2. Financial Overview
12.5.3. Products Offered
12.5.4. Key Developments
12.5.5. SWOT Analysis
12.5.6. Key Strategies
12.6. AMCO Proteins
12.6.1. Company Overview
12.6.2. Financial Overview
12.6.3. Products Offered
12.6.4. Key Developments
12.6.5. SWOT Analysis
12.6.6. Key Strategies
12.7. Jungbunzlauer Suisse AG
12.7.1. Company Overview
12.7.2. Financial Overview
12.7.3. Products Offered
12.7.4. Key Developments
12.7.5. SWOT Analysis
12.7.6. Key Strategies
12.8. Glanbia Nutritionals Inc
12.8.1. Company Overview
12.8.2. Financial Overview
12.8.3. Products Offered
12.8.4. Key Developments
12.8.5. SWOT Analysis
12.8.6. Key Strategies
12.9. Roquette Frères S.A.
12.9.1. Company Overview
12.9.2. Financial Overview
12.9.3. Products Offered
12.9.4. Key Developments
12.9.5. SWOT Analysis
12.9.6. Key Strategies
12.10. Reliance Private Label Supplements
12.10.1. Company Overview
12.10.2. Financial Overview
12.10.3. Products Offered
12.10.4. Key Developments
12.10.5. SWOT Analysis
12.10.6. Key Strategies
12.12. Ingredion Incorporated
12.12.1. Company Overview
12.12.2. Financial Overview
12.12.3. Products Offered
12.12.4. Key Developments
12.12.5. SWOT Analysis
12.12.6. Key Strategies
12.12. Batory Foods
12.12.1. Company Overview
12.12.2. Financial Overview
12.12.3. Products Offered
12.12.4. Key Developments
12.12.5. SWOT Analysis
12.12.6. Key Strategies
12.13. Cambridge Commodities Inc
12.13.1. Company Overview
12.13.2. Financial Overview
12.13.3. Products Offered
12.13.4. Key Developments
12.13.5. SWOT Analysis
12.13.6. Key Strategies
12.14. PLT Health Solutions
12.14.1. Company Overview
12.14.2. Financial Overview
12.14.3. Products Offered
12.14.4. Key Developments
12.14.5. SWOT Analysis
12.14.6. Key Strategies
12.15. Axiom Foods, Inc.
12.15.1. Company Overview
12.15.2. Financial Overview
12.15.3. Products Offered
12.15.4. Key Developments
12.15.5. SWOT Analysis
12.15.6. Key Strategies
13. APPENDIX
13.1. General Sources & References
13.2. List of Abbreviation
LIST OF TABLES
Table 1 Global Plant Protein Ingredients Market, by Region, 2018–2023 (USD Million)
Table 2 Global Plant Protein Ingredients Market, by Source, 2018–2023 (USD Million)
Table 3 Global Plant Protein Ingredients Market, by Form, 2018–2023 (USD Million)
Table 4 Global Plant Protein Ingredients Market, by Application, 2018–2023 (USD Million)
Table 5 North America: Plant Protein Ingredients Market, by Country, 2018–2023 (USD Million)
Table 6 North America: Plant Protein Ingredients Market, by Source, 2018–2023 (USD Million)
Table 7 North America: Plant Protein Ingredients Market, by Form, 2018–2023 (USD Million)
Table 8 North America: Plant Protein Ingredients Market, by Application, 2018–2023 (USD Million)
Table 9 US: Plant Protein Ingredients Market, by Source, 2018–2023 (USD Million)
Table 10 US: Plant Protein Ingredients Market, by Form, 2018–2023 (USD Million)
Table 11 US: Plant Protein Ingredients Market, by Application, 2018–2023 (USD Million)
Table 12 Canada: Plant Protein Ingredients Market, by Source, 2018–2023 (USD Million)
Table 13 Canada: Plant Protein Ingredients Market, by Form, 2018–2023 (USD Million)
Table 14 Canada: Plant Protein Ingredients Market, by Application, 2018–2023 (USD Million)
Table 15 Mexico: Plant Protein Ingredients Market, by Source, 2018–2023 (USD Million)
Table 16 Mexico: Plant Protein Ingredients Market, by Form, 2018–2023 (USD Million)
Table 17 Mexico: Plant Protein Ingredients Market, by Application, 2018–2023 (USD Million)
Table 18 Europe: Plant Protein Ingredients Market, by Country, 2018–2023 (USD Million)
Table 19 Europe: Plant Protein Ingredients Market, by Source, 2018–2023 (USD Million)
Table 20 Europe: Plant Protein Ingredients Market, by Form, 2018–2023 (USD Million)
Table 21 Europe: Plant Protein Ingredients Market, by Application, 2018–2023 (USD Million)
Table 22 Germany: Plant Protein Ingredients Market, by Source, 2018–2023 (USD Million)
Table 23 Germany: Plant Protein Ingredients Market, by Form, 2018–2023 (USD Million)
Table 24 Germany: Plant Protein Ingredients Market, by Application, 2018–2023 (USD Million)
Table 25 France: Plant Protein Ingredients Market, by Source, 2018–2023 (USD Million)
Table 26 France: Plant Protein Ingredients Market, by Form, 2018–2023 (USD Million)
Table 27 France: Plant Protein Ingredients Market, by Application, 2018–2023 (USD Million)
Table 28 Italy: Plant Protein Ingredients Market, by Source, 2018–2023 (USD Million)
Table 29 Italy: Plant Protein Ingredients Market, by Form, 2018–2023 (USD Million)
Table 30 Italy: Plant Protein Ingredients Market, by Application, 2018–2023 (USD Million)
Table 31 Spain: Plant Protein Ingredients Market, by Source, 2018–2023 (USD Million)
Table 32 Spain: Plant Protein Ingredients Market, by Form, 2018–2023 (USD Million)
Table 33 Spain: Plant Protein Ingredients Market, by Application, 2018–2023 (USD Million)
Table 34 UK: Plant Protein Ingredients Market, by Source, 2018–2023 (USD Million)
Table 35 UK: Plant Protein Ingredients Market, by Form, 2018–2023 (USD Million)
Table 36 UK: Plant Protein Ingredients Market, by Application, 2018–2023 (USD Million)
Table 37 Rest of Europe: Plant Protein Ingredients Market, by Source, 2018–2023 (USD Million)
Table 38 Rest of Europe: Plant Protein Ingredients Market, by Form, 2018–2023 (USD Million)
Table 39 Rest of Europe: Plant Protein Ingredients Market, by Application, 2018–2023 (USD Million)
Table 40 Asia-Pacific: Plant Protein Ingredients Market, by Country, 2018–2023 (USD Million)
Table 41 Asia-Pacific: Plant Protein Ingredients Market, by Source, 2018–2023 (USD Million)
Table 42 Asia-Pacific: Plant Protein Ingredients Market, by Form, 2018–2023 (USD Million)
Table 43 Asia-Pacific: Plant Protein Ingredients Market, by Application, 2018–2023 (USD Million)
Table 44 China: Plant Protein Ingredients Market, by Source, 2018–2023 (USD Million)
Table 45 China: Plant Protein Ingredients Market, by Form, 2018–2023 (USD Million)
Table 46 China: Plant Protein Ingredients Market, by Application, 2018–2023 (USD Million)
Table 47 India: Plant Protein Ingredients Market, by Source, 2018–2023 (USD Million)
Table 48 India: Plant Protein Ingredients Market, by Form, 2018–2023 (USD Million)
Table 49 India: Plant Protein Ingredients Market, by Application, 2018–2023 (USD Million)
Table 50 Japan: Plant Protein Ingredients Market, by Source, 2018–2023 (USD Million)
Table 51 Japan: Plant Protein Ingredients Market, by Form, 2018–2023 (USD Million)
Table 52 Japan: Plant Protein Ingredients Market, by Application, 2018–2023 (USD Million)
Table 53 Australia & New Zealand: Plant Protein Ingredients Market, by Source, 2019–2024 (USD Million)
Table 54 Australia & New Zealand: Plant Protein Ingredients Market, by Form ,2019–2024 (USD Million)
Table 55 Australia & New Zealand: Plant Protein Ingredients Market, by Application, 2019–2024 (USD Million)
Table 56 Rest of Asia-Pacific: Plant Protein Ingredients Market, by Source, 2018–2023 (USD Million)
Table 57 Rest of Asia-Pacific: Plant Protein Ingredients Market, by Form, 2018–2023 (USD Million)
Table 58 Rest of Asia-Pacific: Plant Protein Ingredients Market, by Application, 2018–2023 (USD Million)
Table 59 Rest of the World (RoW): Plant Protein Ingredients Market, by Country, 2018–2023 (USD Million)
Table 60 Rest of the World (RoW): Plant Protein Ingredients Market, by Source, 2018–2023 (USD Million)
Table 61 Rest of the World (RoW): Plant Protein Ingredients Market, by Form, 2018–2023 (USD Million)
Table 62 Rest of the World (RoW): Plant Protein Ingredients Market, by Application, 2018–2023 (USD Million)
Table 63 South America: Plant Protein Ingredients Market, by Source, 2018–2023 (USD Million)
Table 64 South America: Plant Protein Ingredients Market, by Form, 2018–2023 (USD Million)
Table 65 South America: Plant Protein Ingredients Market, by Application, 2018–2023 (USD Million)
Table 66 Middle East: Plant Protein Ingredients Market, by Source, 2018–2023 (USD Million)
Table 67 Middle East: Plant Protein Ingredients Market, by Form, 2018–2023 (USD Million)
Table 68 Middle East: Plant Protein Ingredients Market, by Application, 2018–2023 (USD Million)
Table 69 Africa: Plant Protein Ingredients Market, by Source, 2018–2023 (USD Million)
Table 70 Africa: Plant Protein Ingredients Market, by Form, 2018–2023 (USD Million)
Table 71 Africa: Plant Protein Ingredients Market, by Application, 2018–2023 (USD Million)
LIST OF FIGURES
FIGURE 1 Global Plant Protein Ingredients Market Segmentation
FIGURE 2 Forecast Research Methodology
FIGURE 3 Five Forces Analysis of the Global Plant Protein Ingredients Market
FIGURE 4 Value Chain of the Global Plant Protein Ingredients Market
FIGURE 5 Share of the Global Plant Protein Ingredients Market in 2018, by Country (%)
FIGURE 6 Global Plant Protein Ingredients Market, by Region, 2019–2024,
FIGURE 7 Global Plant Protein Ingredients Market Size, by Source, 2018
FIGURE 8 Share of the Global Plant Protein Ingredients Market, by Source, 2019–2024 (%)
FIGURE 9 Global Plant Protein Ingredients Market Size, by Form, 2018
FIGURE 10 Share of the Global Plant Protein Ingredients Market, by Form, 2019–2024 (%)
FIGURE 9 Global Plant Protein Ingredients Market Size, by Application, 2018
FIGURE 10 Share of the Global Plant Protein Ingredients Market, by Application, 2019–2024 (%)