Segmentation Quick Reference
| Dimension | Sub-Segments | Dominant Segment | Fastest Growing Segment |
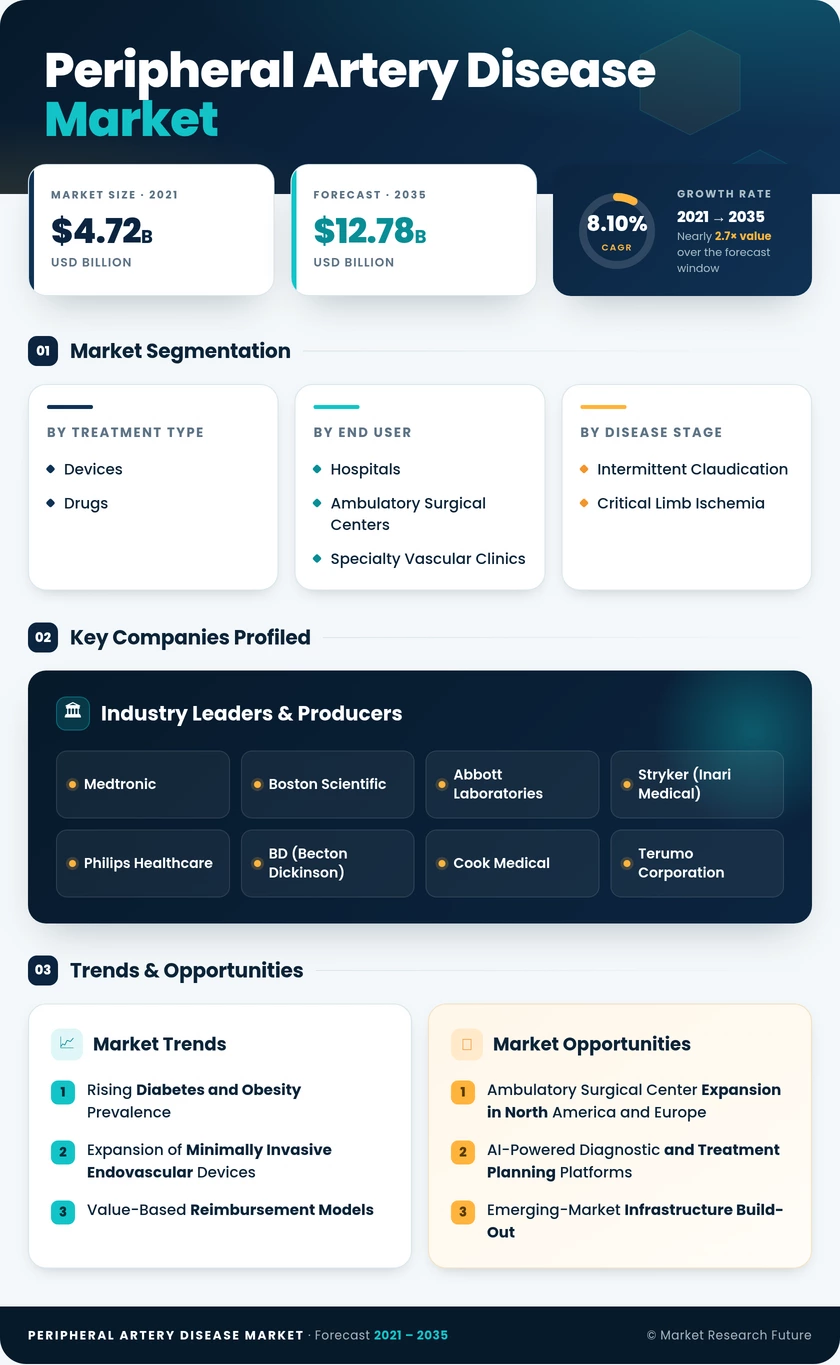
| Treatment Type | Devices, Drugs | Devices (61.2% share, 2025) | Drugs (10.72% CAGR) |
| End User | Hospitals, Ambulatory Surgical Centers, Specialty Vascular Clinics | Hospitals (61.5% share, 2025) | Ambulatory Surgical Centers (10.28% CAGR) |
| Disease Stage | Intermittent Claudication, Critical Limb Ischemia | Intermittent Claudication (69.5% share, 2025) | Critical Limb Ischemia (9.24% CAGR) |
| Anatomy Treated | Lower-Extremity Arteries, Renal-Visceral Arteries | Lower-Extremity Arteries (83.2% share, 2025) | Renal-Visceral Arteries (10.10% CAGR) |
Market Segmentation Overview
By Treatment Type
| Sub-Segment | Key Trend |
| Devices | Drug-coated balloons and atherectomy systems are displacing plain angioplasty; intravascular lithotripsy is entering mainstream adoption for calcified lesions. |
| Drugs | Novel vascular-dose anticoagulants and PCSK9 inhibitors extending pharmacological intervention window; combination-therapy protocols gaining guideline endorsement |
The treatment-type dimension reflects a market where procedural device innovation drives the majority of revenue today. Still, pharmaceutical advances are narrowing the gap by addressing upstream risk factors and post-procedural event reduction.
By End User
| Sub-Segment | Key Trend |
| Hospitals | Hybrid catheter-lab investments and CLI case concentration sustain inpatient dominance; teaching hospitals serve as centers of excellence for complex multi-vessel interventions. |
| Ambulatory Surgical Centers | CMS code expansions and payer cost incentives accelerate same-day discharge procedural migration; new facility construction is rising at double-digit rates in the US |
| Specialty Vascular Clinics | Office-based laboratories are gaining share in diagnostic workup and low-acuity interventions; physician-owned models offer faster scheduling and lower overhead. |
End-user segmentation captures a structural shift from centralized inpatient delivery toward a distributed outpatient model — a trend that reshapes device-company go-to-market strategies and payer contracting dynamics.
By Disease Stage
| Sub-Segment | Key Trend |
| Intermittent Claudication | Screening program expansion, pulling patients into treatment earlier; supervised exercise therapy bundled with pharmacotherapy as a first-line approach. |
| Critical Limb Ischemia | Limb-salvage technology advances, reducing major amputation rates; multi-disciplinary wound-care team protocols becoming standard of care |
Disease-stage segmentation reflects the clinical reality that most procedure volume occurs in earlier-stage patients, while the most resource-intensive (and revenue-generating) cases sit in the CLI segment.
By Anatomy Treated
| Sub-Segment | Key Trend |
| Lower-Extremity Arteries | Femoropopliteal and infrapopliteal interventions dominate procedure counts; below-the-knee devices are gaining dedicated regulatory pathways. |
| Renal-Visceral Arteries | Renovascular hypertension awareness driving referral volumes; dedicated renal stent systems and covered-stent grafts expanding the treatment toolkit. |
Anatomy-treated segmentation highlights that while lower-extremity disease is the clinical epicenter, renal-visceral interventions represent a high-growth niche as diagnostic awareness expands beyond traditional PAD cardiology referral channels.