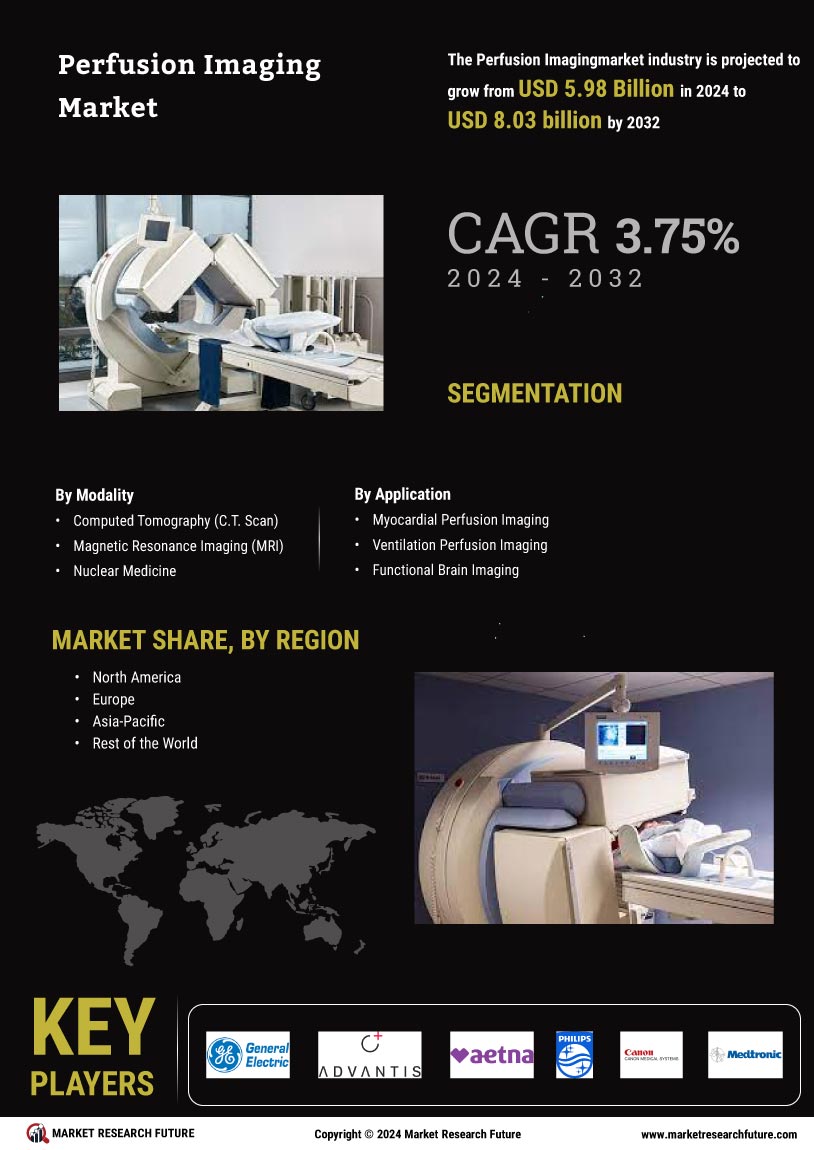
Certified Global Research Member
Isomar fd.webp Wcrc 57.webp
Key Questions Answered
  • Global Market Outlook
  • In-depth analysis of global and regional trends
  • Analyze and identify the major players in the market, their market share, key developments, etc.
  • To understand the capability of the major players based on products offered, financials, and strategies.
  • Identify disrupting products, companies, and trends.
  • To identify opportunities in the market.
  • Analyze the key challenges in the market.
  • Analyze the regional penetration of players, products, and services in the market.
  • Comparison of major players’ financial performance.
  • Evaluate strategies adopted by major players.
  • Recommendations
Why Choose Market Research Future?
  • Vigorous research methodologies for specific market.
  • Knowledge partners across the globe
  • Large network of partner consultants.
  • Ever-increasing/ Escalating data base with quarterly monitoring of various markets
  • Trusted by fortune 500 companies/startups/ universities/organizations
  • Large database of 5000+ markets reports.
  • Effective and prompt pre- and post-sales support.

Perfusion Imaging Market Research Report Information By Modality (Computed Tomography (C.T. Scan), Magnetic Resonance Imaging (MRI), Nuclear Medicine), By Application (Myocardial Perfusion Imaging, Ventilation Perfusion Imaging, Functional Brain Imaging) And By Region (North America, Europe, Asia-Pacific, And Rest Of The World) –Market Forecast Till 2032.


ID: MRFR/MED/2415-CR | 98 Pages | Author: Rahul Gotadki| July 2019

Perfusion Imaging Market Segmentation


Perfusion Imaging Modality Outlook (USD Billion, 2018-2032)


  • Computed Tomography (CT Scan)


  • Magnetic Resonance Imaging (MRI)


  • Nuclear Medicine


Perfusion Imaging Application Outlook (USD Billion, 2018-2032)


  • Myocardial Perfusion Imaging


  • Ventilation Perfusion Imaging


  • Functional Brain Imaging


Perfusion Imaging Regional Outlook (USD Billion, 2018-2032)


  • North AmericaOutlook (USD Billion, 2018-2032)


    • North America Perfusion Imaging by Modality


      • Computed Tomography (CT Scan)


      • Magnetic Resonance Imaging (MRI)


      • Nuclear Medicine


    • North America Perfusion Imaging by Application


      • Myocardial Perfusion Imaging


      • Ventilation Perfusion Imaging


      • Functional Brain Imaging


    • USOutlook (USD Billion, 2018-2032)


    • US Perfusion Imaging by Modality


      • Computed Tomography (CT Scan)


      • Magnetic Resonance Imaging (MRI)


      • Nuclear Medicine


    • US Perfusion Imaging by Application


      • Myocardial Perfusion Imaging


      • Ventilation Perfusion Imaging


      • Functional Brain Imaging


    • CANADAOutlook (USD Billion, 2018-2032)


    • CANADA Perfusion Imaging by Modality


      • Computed Tomography (CT Scan)


      • Magnetic Resonance Imaging (MRI)


      • Nuclear Medicine


    • CANADA Perfusion Imaging by Application


      • Myocardial Perfusion Imaging


      • Ventilation Perfusion Imaging


      • Functional Brain Imaging


  • EuropeOutlook (USD Billion, 2018-2032)


    • Europe Perfusion Imaging by Modality


      • Computed Tomography (CT Scan)


      • Magnetic Resonance Imaging (MRI)


      • Nuclear Medicine


    • Europe Perfusion Imaging by Application


      • Myocardial Perfusion Imaging


      • Ventilation Perfusion Imaging


      • Functional Brain Imaging


    • GermanyOutlook (USD Billion, 2018-2032)


    • Germany Perfusion Imaging by Modality


      • Computed Tomography (CT Scan)


      • Magnetic Resonance Imaging (MRI)


      • Nuclear Medicine


    • Germany Perfusion Imaging by Application


      • Myocardial Perfusion Imaging


      • Ventilation Perfusion Imaging


      • Functional Brain Imaging


    • FranceOutlook (USD Billion, 2018-2032)


    • France Perfusion Imaging by Modality


      • Computed Tomography (CT Scan)


      • Magnetic Resonance Imaging (MRI)


      • Nuclear Medicine


    • France Perfusion Imaging by Application


      • Myocardial Perfusion Imaging


      • Ventilation Perfusion Imaging


      • Functional Brain Imaging


    • UKOutlook (USD Billion, 2018-2032)


    • UK Perfusion Imaging by Modality


      • Computed Tomography (CT Scan)


      • Magnetic Resonance Imaging (MRI)


      • Nuclear Medicine


    • UK Perfusion Imaging by Application


      • Myocardial Perfusion Imaging


      • Ventilation Perfusion Imaging


      • Functional Brain Imaging


    • ITALYOutlook (USD Billion, 2018-2032)


    • ITALY Perfusion Imaging by Modality


      • Computed Tomography (CT Scan)


      • Magnetic Resonance Imaging (MRI)


      • Nuclear Medicine


    • ITALY Perfusion Imaging by Application


      • Myocardial Perfusion Imaging


      • Ventilation Perfusion Imaging


      • Functional Brain Imaging


    • SPAINOutlook (USD Billion, 2018-2032)


    • Spain Perfusion Imaging by Modality


      • Computed Tomography (CT Scan)


      • Magnetic Resonance Imaging (MRI)


      • Nuclear Medicine


    • Spain Perfusion Imaging by Application


      • Myocardial Perfusion Imaging


      • Ventilation Perfusion Imaging


      • Functional Brain Imaging


    • Rest Of EuropeOutlook (USD Billion, 2018-2032)


    • Rest Of Europe Perfusion Imaging by Modality


      • Computed Tomography (CT Scan)


      • Magnetic Resonance Imaging (MRI)


      • Nuclear Medicine


    • REST OF EUROPE Perfusion Imaging by Application


      • Myocardial Perfusion Imaging


      • Ventilation Perfusion Imaging


      • Functional Brain Imaging


  • Asia-PacificOutlook (USD Billion, 2018-2032)


    • Asia-Pacific Perfusion Imaging by Modality


      • Computed Tomography (CT Scan)


      • Magnetic Resonance Imaging (MRI)


      • Nuclear Medicine


    • Asia-Pacific Perfusion Imaging by Application


      • Myocardial Perfusion Imaging


      • Ventilation Perfusion Imaging


      • Functional Brain Imaging


    • ChinaOutlook (USD Billion, 2018-2032)


    • China Perfusion Imaging by Modality


      • Computed Tomography (CT Scan)


      • Magnetic Resonance Imaging (MRI)


      • Nuclear Medicine


    • China Perfusion Imaging by Application


      • Myocardial Perfusion Imaging


      • Ventilation Perfusion Imaging


      • Functional Brain Imaging


    • JapanOutlook (USD Billion, 2018-2032)


    • Japan Perfusion Imaging by Modality


      • Computed Tomography (CT Scan)


      • Magnetic Resonance Imaging (MRI)


      • Nuclear Medicine


    • Japan Perfusion Imaging by Application


      • Myocardial Perfusion Imaging


      • Ventilation Perfusion Imaging


      • Functional Brain Imaging


    • India Outlook (USD Billion, 2018-2032)


    • India Perfusion Imaging by Modality


      • Computed Tomography (CT Scan)


      • Magnetic Resonance Imaging (MRI)


      • Nuclear Medicine


    • India Perfusion Imaging by Application


      • Myocardial Perfusion Imaging


      • Ventilation Perfusion Imaging


      • Functional Brain Imaging


    • AustraliaOutlook (USD Billion, 2018-2032)


    • Australia Perfusion Imaging by Modality


      • Computed Tomography (CT Scan)


      • Magnetic Resonance Imaging (MRI)


      • Nuclear Medicine


    • Australia Perfusion Imaging by Application


      • Myocardial Perfusion Imaging


      • Ventilation Perfusion Imaging


      • Functional Brain Imaging


    • Rest of Asia-PacificOutlook (USD Billion, 2018-2032)


    • Rest of Asia-Pacific Perfusion Imaging by Modality


      • Computed Tomography (CT Scan)


      • Magnetic Resonance Imaging (MRI)


      • Nuclear Medicine


    • Rest of Asia-Pacific Perfusion Imaging by Application


      • Myocardial Perfusion Imaging


      • Ventilation Perfusion Imaging


      • Functional Brain Imaging


  • Rest of the WorldOutlook (USD Billion, 2018-2032)


    • Rest of the World Perfusion Imaging by Modality


      • Computed Tomography (CT Scan)


      • Magnetic Resonance Imaging (MRI)


      • Nuclear Medicine


    • Rest of the World Perfusion Imaging by Application


      • Myocardial Perfusion Imaging


      • Ventilation Perfusion Imaging


      • Functional Brain Imaging


    • Middle EastOutlook (USD Billion, 2018-2032)


    • Middle East Perfusion Imaging by Modality


      • Computed Tomography (CT Scan)


      • Magnetic Resonance Imaging (MRI)


      • Nuclear Medicine


    • Middle East Perfusion Imaging by Application


      • Myocardial Perfusion Imaging


      • Ventilation Perfusion Imaging


      • Functional Brain Imaging


    • AfricaOutlook (USD Billion, 2018-2032)


    • Africa Perfusion Imaging by Modality


      • Computed Tomography (CT Scan)


      • Magnetic Resonance Imaging (MRI)


      • Nuclear Medicine


    • Africa Perfusion Imaging by Application


      • Myocardial Perfusion Imaging


      • Ventilation Perfusion Imaging


      • Functional Brain Imaging


    • Latin AmericaOutlook (USD Billion, 2018-2032)


    • Latin America Perfusion Imaging by Modality


      • Computed Tomography (CT Scan)


      • Magnetic Resonance Imaging (MRI)


      • Nuclear Medicine


    • Latin America Perfusion Imaging by Application


      • Myocardial Perfusion Imaging


      • Ventilation Perfusion Imaging


      • Functional Brain Imaging


Leading companies partner with us for data-driven Insights
client_1 client_2 client_3 client_4 client_5 client_6 client_7 client_8 client_9 client_10
Please fill in Business Email for Quick Response

1 Executive Summary

1.1 Market Attractiveness Analysis 15

1.1.1 Global Perfusion Imaging Market, By Modality 15

1.1.2 Global Perfusion Imaging Market, By Application 16

2 Market Introduction

2.1 Definition 17

2.2 Scope Of The Study 17

2.3 Assumptions & Limitations 17

2.3.1 Assumptions 17

2.3.2 Limitations 17

2.4 Market Structure 18

3 Research Methodology

3.1 Research Process 19

3.2 Primary Research 20

3.3 Secondary Research 21

3.4 Market Size Estimation 21

3.5 Forecast Model 22

4 Market Dynamics

4.1 Overview 23

4.2 Drivers 24

4.2.1 Growing Prevalence Of Cardiovascular And Neurological Diseases 24

4.2.2 Increasing Geriatric Population 24

4.2.3 Advancements In Technology 24

4.3 Restraints 25

4.3.1 Stringent Regulatory Policies 25

4.3.2 Lack Of Awareness For The Use Of Advanced Technologies 25

4.4 Opportunities 26

4.4.1 Entering Developing Economies 26

4.5 Macroeconomic Indicators 26

5 Market Factor Analysis

5.1 Value Chain Analysis 27

5.1.1 R&D And Designing 27

5.1.2 Manufacturing 27

5.1.3 Packaging & Assembly 27

5.1.4 Distribution & Sales 28

5.1.5 Post-Sales Review 28

5.2 Porter’s Five Forces Analysis 29

5.2.1 Bargaining Power Of Suppliers 29

5.2.2 Bargaining Power Of Buyers 29

5.2.3 Threat Of New Entrants 30

5.2.4 Threat Of Substitutes 30

5.2.5 Intensity Of Rivalry 30

6 Perfusion Imaging Market, By Modality

6.1 Overview 31

6.2 Computed Tomography (CT Scan) 32

6.3 Magnetic Resonance Imaging (MRI) 33

6.4 Nuclear Medicine 34

7 Perfusion Imaging Market, By Application

7.1 Overview 35

7.2 Myocardial Perfusion Imaging 36

7.3 Ventilation Perfusion Imaging 37

7.4 Functional Brain Imaging 38

8 Global Perfusion Imaging Market, By Region

8.1 Overview 39

8.2 Americas 41

Perfusion Imaging Market, By Modality

Perfusion Imaging Market, By Application

8.2.1 North America 43

Perfusion Imaging Market, By Modality

Perfusion Imaging Market, By Application

8.2.1.1 US 44

Perfusion Imaging Market, By Modality

Perfusion Imaging Market, By Application

8.2.1.2 Canada 45

Perfusion Imaging Market, By Modality

Perfusion Imaging Market, By Application

8.2.2 Latin America 46

Perfusion Imaging Market, By Modality

Perfusion Imaging Market, By Application

8.3 Europe 47

Perfusion Imaging Market, By Modality

Perfusion Imaging Market, By Application

8.3.1 Western Europe 48

Perfusion Imaging Market, By Modality

Perfusion Imaging Market, By Application

8.3.1.1 Germany 50

Perfusion Imaging Market, By Modality

Perfusion Imaging Market, By Application

8.3.1.2 France 50

Perfusion Imaging Market, By Modality

Perfusion Imaging Market, By Application

8.3.1.3 UK 51

Perfusion Imaging Market, By Modality

Perfusion Imaging Market, By Application

8.3.1.4 Italy 52

Perfusion Imaging Market, By Modality

Perfusion Imaging Market, By Application

8.3.1.5 Spain 52

Perfusion Imaging Market, By Modality

Perfusion Imaging Market, By Application

8.3.1.6 Rest Of Western Europe 53

Perfusion Imaging Market, By Modality

Perfusion Imaging Market, By Application

8.3.2 Eastern Europe 54

Perfusion Imaging Market, By Modality

Perfusion Imaging Market, By Application

8.4 Asia-Pacific 55

Perfusion Imaging Market, By Modality

Perfusion Imaging Market, By Application

8.4.1.1 Japan 56

Perfusion Imaging Market, By Modality

Perfusion Imaging Market, By Application

8.4.1.2 China 57

Perfusion Imaging Market, By Modality

Perfusion Imaging Market, By Application

8.4.1.3 India 58

Perfusion Imaging Market, By Modality

Perfusion Imaging Market, By Application

8.4.1.4 South Korea 58

Perfusion Imaging Market, By Modality

Perfusion Imaging Market, By Application

8.4.1.5 Australia 59

Perfusion Imaging Market, By Modality

Perfusion Imaging Market, By Application

8.4.1.6 Rest Of Asia-Pacific 60

Perfusion Imaging Market, By Modality

Perfusion Imaging Market, By Application

8.5 Middle East & Africa 61

Perfusion Imaging Market, By Modality

Perfusion Imaging Market, By Application

8.5.1 Middle East 62

Perfusion Imaging Market, By Modality

Perfusion Imaging Market, By Application

8.5.2 Africa 63

Perfusion Imaging Market, By Modality

Perfusion Imaging Market, By Application

9 Competitive Landscape

9.1 Overview 64

9.2 Competitive Benchmarking 65

9.3 Leading Players In Terms Of Number Of Developments In The Perfusion Imaging Market 66

9.4 Key Development Analysis 67

9.4.1 Partnership/Strategic Agreement 67

9.4.2 Acquisition 68

9.4.3 Product Approval 68

9.4.4 Expansion 68

10 Company Profiles

10.1 General Electric Company 69

10.1.1 Company Overview 69

10.1.2 Financial Overview 69

10.1.3 Products/Services Offered 70

10.1.4 Key Developments 70

10.1.5 SWOT Analysis 70

10.1.6 Key Strategies 71

10.2 Siemens 72

10.2.1 Company Overview 72

10.2.2 Financial Overview 72

10.2.3 Products/Services Offered 73

10.2.4 Key Developments 73

10.2.5 SWOT Analysis 74

10.2.6 Key Strategies 74

10.3 Medtronic 75

10.3.1 Company Overview 75

10.3.2 Financial Overview 75

10.3.3 Products/Services Offered 75

10.3.4 Key Developments 76

10.3.5 SWOT Analysis 76

10.3.6 Key Strategies 76

10.4 Canon Medical Systems Corporation 77

10.4.1 Company Overview 77

10.4.2 Financial Overview 77

10.4.3 Products/Services Offered 78

10.4.4 Key Developments 78

10.4.5 SWOT Analysis 79

10.4.6 Key Strategies 79

10.5 Bracco Diagnostic, Inc. 80

10.5.1 Company Overview 80

10.5.2 Financial Overview 80

10.5.3 Products/Services Offered 81

10.5.4 Key Developments 81

10.5.5 SWOT Analysis 81

10.5.6 Key Strategies 81

10.6 Koninklijke Philips NV 82

10.6.1 Company Overview 82

10.6.2 Financial Overview 82

10.6.3 Products/Services Offered 83

10.6.4 Key Developments 84

10.6.5 SWOT Analysis 84

10.6.6 Key Strategies 84

10.7 Neusoft Corporation 85

10.7.1 Company Overview 85

10.7.2 Financial Overview 85

10.7.3 Products/Services Offered 86

10.7.4 Key Developments 86

10.7.5 SWOT Analysis 86

10.7.6 Key Strategies 86

10.8 Lantheus Medical Imaging, Inc. 87

10.8.1 Company Overview 87

10.8.2 Financial Overview 87

10.8.3 Products/Services Offered 88

10.8.4 Key Developments 88

10.8.5 SWOT Analysis 88

10.8.6 Key Strategies 88

10.9 Shimadzu Corporation 89

10.9.1 Company Overview 89

10.9.2 Financial Overview 89

10.9.3 Products/Services Offered 90

10.9.4 Key Developments 90

10.9.5 SWOT Analysis 90

10.9.6 Key Strategies 90

10.10 Aetna 91

10.10.1 Company Overview 91

10.10.2 Financial Overview 91

10.10.3 Products/Services Offered 92

10.10.4 Key Developments 92

10.10.5 SWOT Analysis 92

10.10.6 Key Strategies 92

10.11 Perimed 93

10.11.1 Company Overview 93

10.11.2 Financial Overview 93

10.11.3 Products/Services Offered 93

10.11.4 Key Developments 93

10.11.5 SWOT Analysis 93

10.11.6 Key Strategies 94

10.12 Advantis Medical Imaging 95

10.12.1 Company Overview 95

10.12.2 Financial Overview 95

10.12.3 Products/Services Offered 95

10.12.4 Key Developments 95

10.12.5 SWOT Analysis 95

10.12.6 Key Strategies 96

11 Appendix

11.1 References 97

11.2 Related Reports 97

12 List Of Tables

TABLE 1 PRIMARY INTERVIEWS 16

TABLE 2 GLOBAL HEMP BASED PRODUCTS MARKET, BY REGION 2020-2027 (USD MILLION) 32

TABLE 3 AMERICAS HEMP BASED PRODUCTS MARKET, BY REGION 2020-2027 (USD MILLION) 33

TABLE 4 NORTH AMERICA HEMP BASED PRODUCTS MARKET, BY REGION 2020-2027 (USD MILLION) 33

TABLE 5 EUROPE HEMP BASED PRODUCTS MARKET, BY REGION 2020-2027 (USD MILLION) 34

TABLE 6 WESTERN EUROPE HEMP BASED PRODUCTS MARKET, BY REGION 2020-2027 (USD MILLION) 34

TABLE 7 ASIA-PACIFIC: HEMP BASED PRODUCTS MARKET, BY COUNTRY 2023-2032 (USD MILLION) 35

TABLE 8 REST OF THE WORLD (ROW) HEMP BASED PRODUCTS MARKET, BY REGION 2020-2027 (USD MILLION) 35

TABLE 9 GLOBAL HEMP BASED PRODUCTS MARKET , BY INDUSTRIAL APPLICATION, 2023-2032 (USD MILLION) 36

TABLE 10 GLOBAL HEMP BASED PRODUCTS MARKET, FOR HEMP CBD BY TYPE, 2023-2032 (USD MILLION) 37

TABLE 11 GLOBAL HEMP BASED PRODUCTS MARKET, FOR HEMP CBD BY TYPE, 2023-2032 (VOLUME) 38

TABLE 12 GLOBAL HEMP BASED PRODUCTS MARKET, FOR HEMP CBD BY TYPE, 2019–2027 (VOLUME) 38

TABLE 13 GLOBAL CBD OIL MARKET, BY PRODUCT, 2023-2032 (USD MILLION) 40

TABLE 14 GLOBAL CBD OIL MARKET, FOR MARIJUANA-DERIVED CBD OIL BY REGION, 2023-2032 (USD MILLION) 41

TABLE 15 GLOBAL CBD OIL MARKET, FOR HEMP-DERIVED CBD OIL BY REGION, 2023-2032 (USD MILLION) 42

TABLE 16 GLOBAL CBD OIL MARKET, BY APPLICATION, 2023-2032 (USD MILLION) 44

TABLE 17 GLOBAL CBD OIL MARKET, FOR PAIN RELIEF BY REGION, 2023-2032 (USD MILLION) 45

TABLE 18 GLOBAL CBD OIL MARKET, FOR NEUROLOGICAL DISORDERS BY REGION, 2023-2032 (USD MILLION) 46

TABLE 19 GLOBAL CBD OIL MARKET, FOR FIBROMYALGIA BY REGION, 2023-2032 (USD MILLION) 46

TABLE 20 GLOBAL CBD OIL MARKET, FOR MOOD DISORDERS BY REGION, 2023-2032 (USD MILLION) 47

TABLE 21 GLOBAL CBD OIL MARKET, FOR DIABETES BY REGION, 2023-2032 (USD MILLION) 47

TABLE 22 GLOBAL CBD OIL MARKET, BY DISTRIBUTION CHANNEL 2023-2032 (USD MILLION) 49

TABLE 23 GLOBAL CBD OIL MARKET, FOR E-COMMERCE WEBSITES BY REGION 2023-2032 (USD MILLION) 50

TABLE 24 GLOBAL CBD OIL MARKET, FOR RETAIL PHARMACIES BY REGION 2023-2032 (USD MILLION) 50

TABLE 25 GLOBAL CBD OIL MARKET, FOR MEDICAL MARIJUANA DISPENSARIES BY REGION 2023-2032 (USD MILLION 51

TABLE 26 GLOBAL CBD OIL MARKET, FOR HOSPITAL PHARMACIES BY REGION 2023-2032 (USD MILLION 51

TABLE 27 GLOBAL CBD OIL MARKET, BY REGION 2023-2032 (USD MILLION) 54

TABLE 28 AMERICAS: CBD OIL MARKET, BY REGION 2023-2032 (USD MILLION) 55

TABLE 29 AMERICAS: CBD OIL MARKET, BY PRODUCT 2023-2032 (USD MILLION) 55

TABLE 30 AMERICAS: CBD OIL MARKET, BY APPLICATION 2023-2032 (USD MILLION) 56

TABLE 31 AMERICAS: CBD OIL MARKET, BY DISTRIBUTION CHANNEL 2023-2032 (USD MILLION) 56

TABLE 32 NORTH AMERICA: CBD OIL MARKET, BY COUNTRY 2023-2032 (USD MILLION) 57

TABLE 33 NORTH AMERICA: CBD OIL MARKET, BY PRODUCT 2023-2032 (USD MILLION) 57

TABLE 34 NORTH AMERICA: CBD OIL MARKET, BY APPLICATION 2023-2032 (USD MILLION) 58

TABLE 35 NORTH AMERICA: CBD OIL MARKET, BY DISTRIBUTION CHANNEL 2023-2032 (USD MILLION) 58

TABLE 36 US: CBD OIL MARKET, BY PRODUCT 2023-2032 (USD MILLION) 59

TABLE 37 US: CBD OIL MARKET, BY APPLICATION 2023-2032 (USD MILLION) 59

TABLE 38 US: CBD OIL MARKET, BY DISTRIBUTION CHANNEL 2023-2032 (USD MILLION) 60

TABLE 39 CANADA: CBD OIL MARKET, BY PRODUCT 2023-2032 (USD MILLION) 60

TABLE 40 CANADA: CBD OIL MARKET, BY APPLICATION 2023-2032 (USD MILLION) 61

TABLE 41 CANADA: CBD OIL MARKET, BY DISTRIBUTION CHANNEL 2023-2032 (USD MILLION) 61

TABLE 42 SOUTH AMERICA: CBD OIL MARKET, BY PRODUCT 2023-2032 (USD MILLION) 62

TABLE 43 SOUTH AMERICA: CBD OIL MARKET, BY APPLICATION 2023-2032 (USD MILLION) 62

TABLE 44 SOUTH AMERICA: CBD OIL MARKET, BY DISTRIBUTION CHANNEL 2023-2032 (USD MILLION) 63

TABLE 45 EUROPE: CBD OIL MARKET, BY REGION 2023-2032 (USD MILLION) 64

TABLE 46 EUROPE: CBD OIL MARKET, BY PRODUCT 2023-2032 (USD MILLION) 64

TABLE 47 EUROPE: CBD OIL MARKET, BY APPLICATION 2023-2032 (USD MILLION) 65

TABLE 48 EUROPE: CBD OIL MARKET, BY DISTRIBUTION CHANNEL 2023-2032 (USD MILLION) 65

TABLE 49 WESTERN EUROPE: CBD OIL MARKET, BY COUNTRY 2023-2032 (USD MILLION) 66

TABLE 50 WESTERN EUROPE: CBD OIL MARKET, BY PRODUCT 2023-2032 (USD MILLION) 67

TABLE 51 WESTERN EUROPE CBD OIL MARKET, BY APPLICATION 2023-2032 (USD MILLION) 67

TABLE 52 WESTERN EUROPE: CBD OIL MARKET, BY DISTRIBUTION CHANNEL 2023-2032 (USD MILLION) 68

TABLE 53 GERMANY: CBD OIL MARKET, BY PRODUCT 2023-2032 (USD MILLION) 69

TABLE 54 GERMANY: CBD OIL MARKET, BY APPLICATION 2023-2032 (USD MILLION) 69

TABLE 55 GERMANY: CBD OIL MARKET, BY DISTRIBUTION CHANNEL 2023-2032 (USD MILLION) 70

TABLE 56 UK: CBD OIL MARKET, BY PRODUCT 2023-2032 (USD MILLION) 70

TABLE 57 UK: CBD OIL MARKET, BY APPLICATION 2023-2032 (USD MILLION) 71

TABLE 58 UK: CBD OIL MARKET, BY DISTRIBUTION CHANNEL 2023-2032 (USD MILLION) 71

TABLE 59 FRANCE: CBD OIL MARKET, BY PRODUCT 2023-2032 (USD MILLION) 72

TABLE 60 FRANCE: CBD OIL MARKET, BY APPLICATION 2023-2032 (USD MILLION) 72

TABLE 61 FRANCE: CBD OIL MARKET, BY DISTRIBUTION CHANNEL 2023-2032 (USD MILLION) 73

TABLE 62 SPAIN: CBD OIL MARKET, BY PRODUCT 2023-2032 (USD MILLION) 73

TABLE 63 SPAIN: CBD OIL MARKET, BY APPLICATION 2023-2032 (USD MILLION) 74

TABLE 64 SPAIN: CBD OIL MARKET, BY DISTRIBUTION CHANNEL 2023-2032 (USD MILLION) 74

TABLE 65 ITALY: CBD OIL MARKET, BY PRODUCT 2023-2032 (USD MILLION) 75

TABLE 66 ITALY: CBD OIL MARKET, BY APPLICATION 2023-2032 (USD MILLION) 75

TABLE 67 ITALY: CBD OIL MARKET, BY DISTRIBUTION CHANNEL 2023-2032 (USD MILLION) 76

TABLE 68 REST OF WESTERN EUROPE: CBD OIL MARKET, BY PRODUCT 2023-2032 (USD MILLION) 76

TABLE 69 REST OF WESTERN EUROPE: CBD OIL MARKET, BY APPLICATION 2023-2032 (USD MILLION) 77

TABLE 70 REST OF WESTERN EUROPE: CBD OIL MARKET, BY DISTRIBUTION CHANNEL 2023-2032 (USD MILLION) 77

TABLE 71 EASTERN EUROPE: CBD OIL MARKET, BY PRODUCT 2023-2032 (USD MILLION) 78

TABLE 72 EASTERN EUROPE: CBD OIL MARKET, BY APPLICATION 2023-2032 (USD MILLION) 78

TABLE 73 EASTERN EUROPE: CBD OIL MARKET, BY DISTRIBUTION CHANNEL 2023-2032 (USD MILLION) 79

TABLE 74 ASIA-PACIFIC: CBD OIL MARKET, BY COUNTRY 2023-2032 (USD MILLION) 80

TABLE 75 ASIA-PACIFIC: CBD OIL MARKET, BY PRODUCT 2023-2032 (USD MILLION) 81

TABLE 76 ASIA-PACIFIC: CBD OIL MARKET, BY APPLICATION 2023-2032 (USD MILLION) 81

TABLE 77 ASIA-PACIFIC: CBD OIL MARKET, BY DISTRIBUTION CHANNEL 2023-2032 (USD MILLION) 82

TABLE 78 JAPAN: CBD OIL MARKET, BY PRODUCT 2023-2032 (USD MILLION) 82

TABLE 79 JAPAN: CBD OIL MARKET, BY APPLICATION 2023-2032 (USD MILLION) 83

TABLE 80 JAPAN: CBD OIL MARKET, BY DISTRIBUTION CHANNEL 2023-2032 (USD MILLION) 83

TABLE 81 CHINA: CBD OIL MARKET, BY PRODUCT 2023-2032 (USD MILLION) 84

TABLE 82 CHINA: CBD OIL MARKET, BY APPLICATION 2023-2032 (USD MILLION) 84

TABLE 83 CHINA: CBD OIL MARKET, BY DISTRIBUTION CHANNEL 2023-2032 (USD MILLION) 85

TABLE 84 AUSTRALIA: CBD OIL MARKET, BY PRODUCT 2023-2032 (USD MILLION) 85

TABLE 85 AUSTRALIA: CBD OIL MARKET, BY APPLICATION 2023-2032 (USD MILLION) 86

TABLE 86 AUSTRALIA: CBD OIL MARKET, BY DISTRIBUTION CHANNEL 2023-2032 (USD MILLION) 86

TABLE 87 INDIA: CBD OIL MARKET, BY PRODUCT 2023-2032 (USD MILLION) 87

TABLE 88 INDIA: CBD OIL MARKET, BY APPLICATION 2023-2032 (USD MILLION) 87

TABLE 89 INDIA: CBD OIL MARKET, BY DISTRIBUTION CHANNEL 2023-2032 (USD MILLION) 88

TABLE 90 SOUTH KOREA: CBD OIL MARKET, BY PRODUCT 2023-2032 (USD MILLION) 89

TABLE 91 SOUTH KOREA: CBD OIL MARKET, BY APPLICATION 2023-2032 (USD MILLION) 89

TABLE 92 SOUTH KOREA: CBD OIL MARKET, BY DISTRIBUTION CHANNEL 2023-2032 (USD MILLION) 90

TABLE 93 REST OF ASIA-PACIFIC: CBD OIL MARKET, BY PRODUCT 2023-2032 (USD MILLION) 90

TABLE 94 REST OF ASIA-PACIFIC: CBD OIL MARKET, BY APPLICATION 2023-2032 (USD MILLION) 91

TABLE 95 REST OF ASIA-PACIFIC: CBD OIL MARKET, BY DISTRIBUTION CHANNEL 2023-2032 (USD MILLION) 91

TABLE 96 REST OF THE WORLD: CBD OIL MARKET, BY REGION 2023-2032 (USD MILLION) 92

TABLE 97 REST OF THE WORLD: CBD OIL MARKET, BY PRODUCT 2023-2032 (USD MILLION) 92

TABLE 98 REST OF THE WORLD: CBD OIL MARKET, BY APPLICATION 2023-2032 (USD MILLION) 93

TABLE 99 REST OF THE WORLD: CBD OIL MARKET, BY DISTRIBUTION CHANNEL 2023-2032 (USD MILLION) 93

13 List Of Figures

FIGURE 1 GLOBAL CBD OIL MARKET: MARKET STRUCTURE 14

FIGURE 2 RESEARCH PROCESS 16

FIGURE 3 TOP-DOWN & BOTTOM-UP APPROACH 19

FIGURE 4 MARKET DYNAMICS: ANALYSIS OF GLOBAL CBD OIL MARKET 21

FIGURE 5 VALUE CHAIN: GLOBAL CBD OIL MARKET 26

FIGURE 6 PORTER’S FIVE FORCES ANALYSIS: GLOBAL CBD OIL MARKET 27

FIGURE 7 GLOBAL HEMP BASED PRODUCTS MARKET, BY INDUSTRIAL APPLICATION, 2020 (%) 31

FIGURE 8 GLOBAL HEMP BASED PRODUCTS MARKET, BY HEMP CBD PRODUCT TYPE, 2020 (%) 31

FIGURE 9 GLOBAL HEMP BASED PRODUCTS MARKET, BY REGION, 2023-2032 (USD MILLION) 32

FIGURE 10 GLOBAL HEMP BASED PRODUCTS MARKET, BY INDUSTRIAL APPLICATION, 2023-2032 (USD MILLION) 36

FIGURE 11 GLOBAL HEMP BASED PRODUCTS MARKET, FOR HEMP CBD BY TYPE, 2023-2032 (USD MILLION) 37

FIGURE 12 GLOBAL HEMP BASED PRODUCTS MARKET, FOR HEMP CBD BY TYPE, 2023-2032 (VOLUME) 38

FIGURE 13 GLOBAL CBD OIL MARKET, BY PRODUCT, 2023-2032 (USD MILLION) 41

FIGURE 14 GLOBAL CBD OIL MARKET, BY APPLICATION, 2023-2032 (USD MILLION) 45

FIGURE 15 GLOBAL CBD OIL MARKET, BY DISTRIBUTION CHANNEL, 2023-2032 (USD MILLION) 49

FIGURE 16 GLOBAL CBD OIL MARKET, BY REGION 2023-2032 (USD MILLION) 54

FIGURE 17 AMERICAS: CBD OIL MARKET SHARE, BY REGION 2020 55

FIGURE 18 NORTH AMERICA: CBD OIL MARKET SHARE, BY COUNTRY 2020 57

FIGURE 19 EUROPE: CBD OIL MARKET SHARE, BY REGION 2020 64

FIGURE 20 WESTERN EUROPE: CBD OIL MARKET SHARE, BY COUNTRY 2020 66

FIGURE 21 ASIA-PACIFIC: CBD OIL MARKET SHARE, BY COUNTRY 2020 80

FIGURE 22 REST OF THE WORLD: CBD OIL MARKET SHARE, BY REGION 2020 92

FIGURE 23 GLOBAL CBD OIL MARKET SHARE ANALYSIS, 2020 (%) 95

Purchase Option
Single User $ 4,950
Multiuser License $ 5,950
Enterprise User $ 7,250
Compare Licenses
Tailored for You
  • Dedicated Research on any specifics segment or region.
  • Focused Research on specific players in the market.
  • Custom Report based only on your requirements.
  • Flexibility to add or subtract any chapter in the study.
  • Historic data from 2014 and forecasts outlook till 2040.
  • Flexibility of providing data/insights in formats (PDF, PPT, Excel).
  • Provide cross segmentation in applicable scenario/markets.