Peracetic Acid Market

ID: MRFR/CnM/6767-HCR
111 Pages
Chitranshi Jaiswal
Last Updated: June 16, 2026
Peracetic Acid Market Size, Share & Industry Analysis Research Report Information by Application (Sanitizer, Disinfectant, Sterilant, Bleaching Agent, Oxidizer, Biocide, Polymerization Catalyst and others), By Grade(<5% Grade. 5-15% Grade. >15% Grade), End-Use Industry (Food & Beverage, Water Treatment, Healthcare, Pulp & Paper, Chemicals, Agriculture and others) and Region (North America, Europe, Asia-Pacific, Latin America and Middle East & Africa) - Forecast till 2035
Download PDF ×

We do not share your information with anyone. However, we may send you emails based on your report interest from time to time. You may contact us at any time to opt-out.

Peracetic Acid Market

Market Size

Forecast Period2026-2035
CAGR (2026-2035)5.38%
2025 Market Size383.24 kilotons
2035 Market Size648.70 kilotons

Key Players

Evonik Industries
Solvay S.A.
Kemira Oyj
Enviro Tech Chemical Services
Mitsubishi Gas Chemical
PeroxyChem
Opportunities
  • On-Site Generation Systems
  • Emerging-Market Aquaculture Biosecurity
  • Healthcare Endoscope Reprocessing
  1. 1 Market Overview |
    1. 1.1 Study Assumptions & Market Definition |
    2. 1.2 Scope of the Study |
    3. 1.3 Research Methodology
  2. 2 Market Summary & Key Takeaways
  3. 3 Market Dynamics |
    1. 3.1 Market Drivers Analysis | |
      1. 3.1.1 Tightening Food-Safety Sanitation Mandates | |
      2. 3.1.2 Stricter Wastewater Discharge Limits | |
      3. 3.1.3 Shift from Halogenated to Non-Halogenated Chemistries | |
      4. 3.1.4 Hydrogen Peroxide Feedstock Capacity Expansion | |
      5. 3.1.5 Healthcare Facility Sterilization Upgrades | |
      6. 3.1.6 Aquaculture Biosecurity Regulations | |
      7. 3.1.7 Growth in Ready-to-Eat Food Processing Volumes |
    2. 3.2 Market Restraints Analysis | |
      1. 3.2.1 Handling and Storage Hazards (Concentrated PAA) | |
      2. 3.2.2 Regulatory Registration Costs for No-Rinse Formulations | |
      3. 3.2.3 Price Volatility of Hydrogen Peroxide Feedstock | |
      4. 3.2.4 Limited Shelf Life vs. Stable Chlorine Alternatives | |
      5. 3.2.5 Competition from Alternative Sterilization Technologies (Ozone, UV) |
    3. 3.3 Market Opportunity Analysis | |
      1. 3.3.1 On-Site Generation Systems | |
      2. 3.3.2 Emerging-Market Aquaculture Biosecurity | |
      3. 3.3.3 Healthcare Endoscope Reprocessing | |
      4. 3.3.4 Data-Driven Dosing and Digital Monitoring | |
      5. 3.3.5 Pulp and Paper ECF-to-TCF Conversion |
    4. 3.4 Industry Value Chain Analysis |
    5. 3.5 Porter's Five Forces Analysis
  4. 4 Global Peracetic Acid Market Size & Forecast (2021–2035) |
    1. 4.1 Historical Market Size (2021–2025) |
    2. 4.2 Current & Forecast Market Size (2026–2035) |
    3. 4.3 Market Size by Volume (Kilotons) |
    4. 4.4 Year-over-Year Growth Analysis
  5. 5 Segmentation Analysis |
    1. 5.1 By Product Form | |
      1. 5.1.1 Liquid Solutions | |
      2. 5.1.2 Powder/Granules | |
      3. 5.1.3 Aqueous Blends |
    2. 5.2 By Concentration Grade | |
      1. 5.2.1 Less Than 5% PAA | |
      2. 5.2.2 5–15% PAA | |
      3. 5.2.3 More Than 15% PAA |
    3. 5.3 By Application | |
      1. 5.3.1 Disinfectant | |
      2. 5.3.2 Oxidizer | |
      3. 5.3.3 Other Applications |
    4. 5.4 By End-User Industry | |
      1. 5.4.1 Food and Beverage | |
      2. 5.4.2 Water Treatment | |
      3. 5.4.3 Healthcare | |
      4. 5.4.4 Other End Users
  6. 6 Regional Analysis |
    1. 6.1 North America | |
      1. 6.1.1 United States | |
      2. 6.1.2 Canada | |
      3. 6.1.3 Mexico |
    2. 6.2 Europe | |
      1. 6.2.1 Germany | |
      2. 6.2.2 United Kingdom | |
      3. 6.2.3 France | |
      4. 6.2.4 Italy | |
      5. 6.2.5 Spain | |
      6. 6.2.6 Nordic Countries | |
      7. 6.2.7 Russia | |
      8. 6.2.8 Rest of Europe |
    3. 6.3 Asia-Pacific | |
      1. 6.3.1 China | |
      2. 6.3.2 India | |
      3. 6.3.3 Japan | |
      4. 6.3.4 South Korea | |
      5. 6.3.5 ASEAN | |
      6. 6.3.6 Rest of Asia-Pacific |
    4. 6.4 South America | |
      1. 6.4.1 Brazil | |
      2. 6.4.2 Argentina | |
      3. 6.4.3 Rest of South America |
    5. 6.5 Middle East & Africa | |
      1. 6.5.1 Saudi Arabia | |
      2. 6.5.2 UAE | |
      3. 6.5.3 South Africa | |
      4. 6.5.4 Egypt | |
      5. 6.5.5 Rest of MEA
  7. 7 Competitive Landscape |
    1. 7.1 Market Share Analysis (2025) |
    2. 7.2 Competitive Benchmarking Matrix |
    3. 7.3 Company Profiles | |
      1. 7.3.1 Evonik Industries | |
      2. 7.3.2 Solvay S.A. | |
      3. 7.3.3 Kemira Oyj | |
      4. 7.3.4 Enviro Tech Chemical Services | |
      5. 7.3.5 Mitsubishi Gas Chemical | |
      6. 7.3.6 PeroxyChem (Evonik) | |
      7. 7.3.7 Aditya Birla Chemicals | |
      8. 7.3.8 Christeyns NV | |
      9. 7.3.9 Jubilant Industries | |
      10. 7.3.10 BioSafe Systems
  8. 8 Future Outlook & Strategic Recommendations (2026–2035) |
    1. 8.1 Automation and Smart Dosing Integration |
    2. 8.2 Sustainability and Green-Chemistry Positioning |
    3. 8.3 Emerging-Market Capacity Buildout |
    4. 8.4 Regulatory Harmonization and Global Standards Convergence
  9. 9 Recent Developments & News
  10. 10 Frequently Asked Questions (FAQs)
  11. 11 Report Scope & Methodology |
    1. 11.1 Study Period & Base Year |
    2. 11.2 Data Sources & Citations |
    3. 11.3 Abbreviations
  12. 12 LIST OF TABLES |
  13. TABLE 1 Global Peracetic Acid Market Size & Forecast, by Volume (Kilotons), 2021–2035 |
  14. TABLE 2 Global Peracetic Acid Market – Year-over-Year Growth Analysis, 2021–2035 |
  15. TABLE 3 Global Peracetic Acid Market – Driver Impact Analysis |
  16. TABLE 4 Global Peracetic Acid Market – Restraint Impact Analysis |
  17. TABLE 5 Global Peracetic Acid Market Size, by Product Form, 2021–2035 (Kilotons) |
  18. TABLE 6 Global Peracetic Acid Market Size, by Concentration Grade, 2021–2035 (Kilotons) |
  19. TABLE 7 Global Peracetic Acid Market Size, by Application, 2021–2035 (Kilotons) |
  20. TABLE 8 Global Peracetic Acid Market Size, by End-User Industry, 2021–2035 (Kilotons) |
  21. TABLE 9 Global Peracetic Acid Market Size, by Region, 2021–2035 (Kilotons) |
  22. TABLE 10 North America Peracetic Acid Market Size, by Country, 2021–2035 (Kilotons) |
  23. TABLE 11 Europe Peracetic Acid Market Size, by Country, 2021–2035 (Kilotons) |
  24. TABLE 12 Asia-Pacific Peracetic Acid Market Size, by Country, 2021–2035 (Kilotons) |
  25. TABLE 13 South America Peracetic Acid Market Size, by Country, 2021–2035 (Kilotons) |
  26. TABLE 14 Middle East & Africa Peracetic Acid Market Size, by Country, 2021–2035 (Kilotons) |
  27. TABLE 15 Competitive Benchmarking Matrix – Global Peracetic Acid Market, 2025 |
  28. TABLE 16 Company Profiles – Key Players, Global Peracetic Acid Market |
  29. TABLE 17 Recent Developments & Strategic Announcements, 2023–2025 |
  30. TABLE 18 Report Scope & Methodology Summary |
  31. TABLE 19 Detailed Sources and Citations |
  32. TABLE 20 North America Peracetic Acid Market Size, by Product Form, 2021–2035 (Kilotons) |
  33. TABLE 21 North America Peracetic Acid Market Size, by Concentration Grade, 2021–2035 (Kilotons) |
  34. TABLE 22 North America Peracetic Acid Market Size, by Application, 2021–2035 (Kilotons) |
  35. TABLE 23 North America Peracetic Acid Market Size, by End-User Industry, 2021–2035 (Kilotons) |
  36. TABLE 24 Europe Peracetic Acid Market Size, by Product Form, 2021–2035 (Kilotons) |
  37. TABLE 25 Europe Peracetic Acid Market Size, by Concentration Grade, 2021–2035 (Kilotons) |
  38. TABLE 26 Europe Peracetic Acid Market Size, by Application, 2021–2035 (Kilotons) |
  39. TABLE 27 Europe Peracetic Acid Market Size, by End-User Industry, 2021–2035 (Kilotons) |
  40. TABLE 28 Asia-Pacific Peracetic Acid Market Size, by Product Form, 2021–2035 (Kilotons) |
  41. TABLE 29 Asia-Pacific Peracetic Acid Market Size, by Concentration Grade, 2021–2035 (Kilotons) |
  42. TABLE 30 Asia-Pacific Peracetic Acid Market Size, by Application, 2021–2035 (Kilotons) |
  43. TABLE 31 Asia-Pacific Peracetic Acid Market Size, by End-User Industry, 2021–2035 (Kilotons) |
  44. TABLE 32 South America Peracetic Acid Market Size, by Product Form, 2021–2035 (Kilotons) |
  45. TABLE 33 South America Peracetic Acid Market Size, by Concentration Grade, 2021–2035 (Kilotons) |
  46. TABLE 34 South America Peracetic Acid Market Size, by Application, 2021–2035 (Kilotons) |
  47. TABLE 35 South America Peracetic Acid Market Size, by End-User Industry, 2021–2035 (Kilotons) |
  48. TABLE 36 Middle East & Africa Peracetic Acid Market Size, by Product Form, 2021–2035 (Kilotons) |
  49. TABLE 37 Middle East & Africa Peracetic Acid Market Size, by Concentration Grade, 2021–2035 (Kilotons) |
  50. TABLE 38 Middle East & Africa Peracetic Acid Market Size, by Application, 2021–2035 (Kilotons) |
  51. TABLE 39 Middle East & Africa Peracetic Acid Market Size, by End-User Industry, 2021–2035 (Kilotons)
  52. 13 LIST OF FIGURES |
  53. FIGURE 1 Global Peracetic Acid Market Dynamics (Drivers, Restraints, Opportunities) |
  54. FIGURE 2 Industry Value Chain Analysis – Peracetic Acid Market |
  55. FIGURE 3 Porter's Five Forces Analysis – Global Peracetic Acid Market |
  56. FIGURE 4 Global Peracetic Acid Market Size Trend, 2021–2035 (Kilotons) |
  57. FIGURE 5 Global Peracetic Acid Market Share, by Product Form, 2025 (%) |
  58. FIGURE 6 Global Peracetic Acid Market Share, by Concentration Grade, 2025 (%) |
  59. FIGURE 7 Global Peracetic Acid Market Share, by Application, 2025 (%) |
  60. FIGURE 8 Global Peracetic Acid Market Share, by End-User Industry, 2025 (%) |
  61. FIGURE 9 Global Peracetic Acid Market Share, by Region, 2025 (%) |
  62. FIGURE 10 North America Peracetic Acid Market Share, by Country, 2025 (%) |
  63. FIGURE 11 Europe Peracetic Acid Market Share, by Country, 2025 (%) |
  64. FIGURE 12 Asia-Pacific Peracetic Acid Market Share, by Country, 2025 (%) |
  65. FIGURE 13 South America Peracetic Acid Market Share, by Country, 2025 (%) |
  66. FIGURE 14 Middle East & Africa Peracetic Acid Market Share, by Country, 2025 (%) |
  67. FIGURE 15 Competitive Landscape – Market Share of Key Players, 2025 (%) |
  68. FIGURE 16 Competitive Positioning Map – Global Peracetic Acid Market

Segmentation Quick Reference

DimensionSub-SegmentsDominant SegmentFastest Growing Segment
Product FormLiquid Solutions, Powder/Granules, Aqueous BlendsLiquid SolutionsAqueous Blends
Concentration GradeLess Than 5% PAA, 5–15% PAA, More Than 15% PAA5–15% PAAMore Than 15% PAA
ApplicationDisinfectant, Oxidizer, Other ApplicationsDisinfectantOxidizer
End-User IndustryFood and Beverage, Water Treatment, Healthcare, Other End UsersFood and BeverageWater Treatment
RegionAsia-Pacific, North America, Europe, South America, the Middle East & AfricaAsia-PacificAsia-Pacific


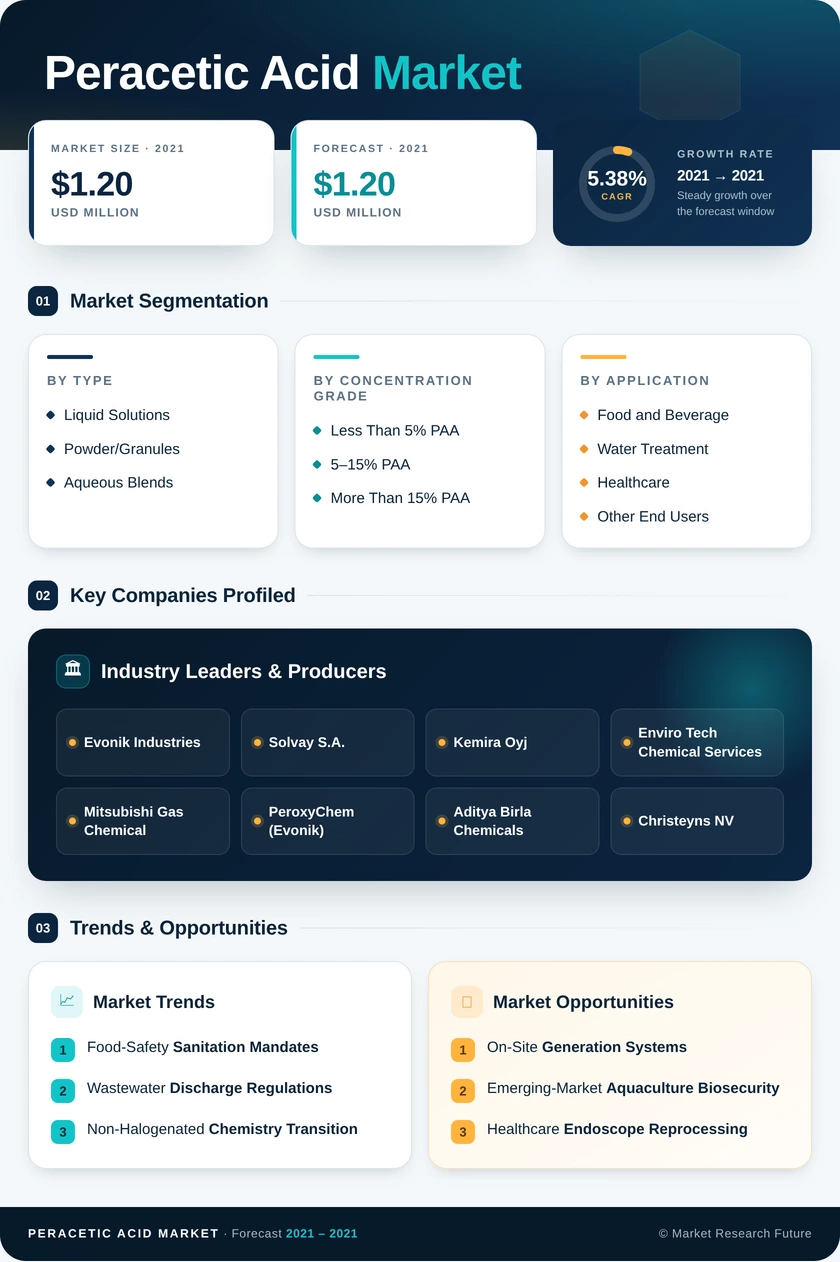
Market Segmentation Overview

By Product Form

Sub-SegmentKey Trend
Liquid SolutionsRemains the standard format for CIP systems in food and beverage plants; it accounts for the largest volume share globally.
Powder/GranulesGrowing adoption in remote aquaculture and agricultural settings where cold-chain logistics are impractical
Aqueous BlendsOn-site blending systems are gaining traction in municipal water treatment and mid-scale food processing facilities.


Liquid solutions continue to anchor the product-form landscape because they integrate seamlessly into automated dosing and clean-in-place infrastructure. Powder and granular formats are carving out a share in tropical and remote-location applications where extended shelf life outweighs higher per-unit costs.

By Concentration Grade

Sub-SegmentKey Trend
Less Than 5% PAAPreferred for healthcare high-level disinfection where low-concentration, ready-to-use formats minimize handling risk
5–15% PAAWorkhorse grade for food-contact sanitation and municipal water treatment, balancing efficacy and safety compliance
More Than 15% PAAExpanding into industrial oxidizer applications, including TCF pulp bleaching and heavy-duty textile processing


The 5–15% PAA grade dominates because most food-safety and water-treatment regulations are written around this concentration window. Above-15% formulations serve specialized industrial oxidizer niches where higher active-ingredient loading justifies the additional storage and transport precautions.

By Application

Sub-SegmentKey Trend
DisinfectantCore application driven by global regulatory mandates replacing chlorine-based chemicals across food, water, and healthcare
OxidizerGrowing as pulp mills and textile processors seek chlorine-free bleaching and brightening alternatives.
Other ApplicationsIncludes soil fumigation, oil-field biocide injection, and specialty chemical synthesis


Disinfectant use cases represent nearly half of all peracetic acid consumption, reflecting the compound's broad-spectrum antimicrobial efficacy and favorable regulatory profile. Oxidizer applications are the fastest-growing category as sustainability-driven bleaching conversions accelerate globally.

By End-User Industry

Sub-SegmentKey Trend
Food and BeverageLargest consumer; driven by no-rinse sanitation mandates for poultry, dairy, produce, and ready-to-eat lines
Water TreatmentFastest-growing major end use: municipal and industrial wastewater plants switching from chlorination to PAA dosing
HealthcareConcentrated in high-level disinfection of heat-sensitive medical devices, especially flexible endoscopes
Other End UsersEncompasses pulp and paper, oil and gas, aquaculture, and textile processing


Food and beverage processing dominates end-user demand because peracetic acid is one of the few antimicrobial compounds approved for direct food-contact use without a mandatory rinse step. Water treatment is accelerating as discharge regulations tighten globally and utilities seek halogen-free alternatives that eliminate trihalomethane formation.