

Information and Communications Technology Market Segmentation
Information and Communications Technology By Organization Size (USD Billion, 2025-2035)
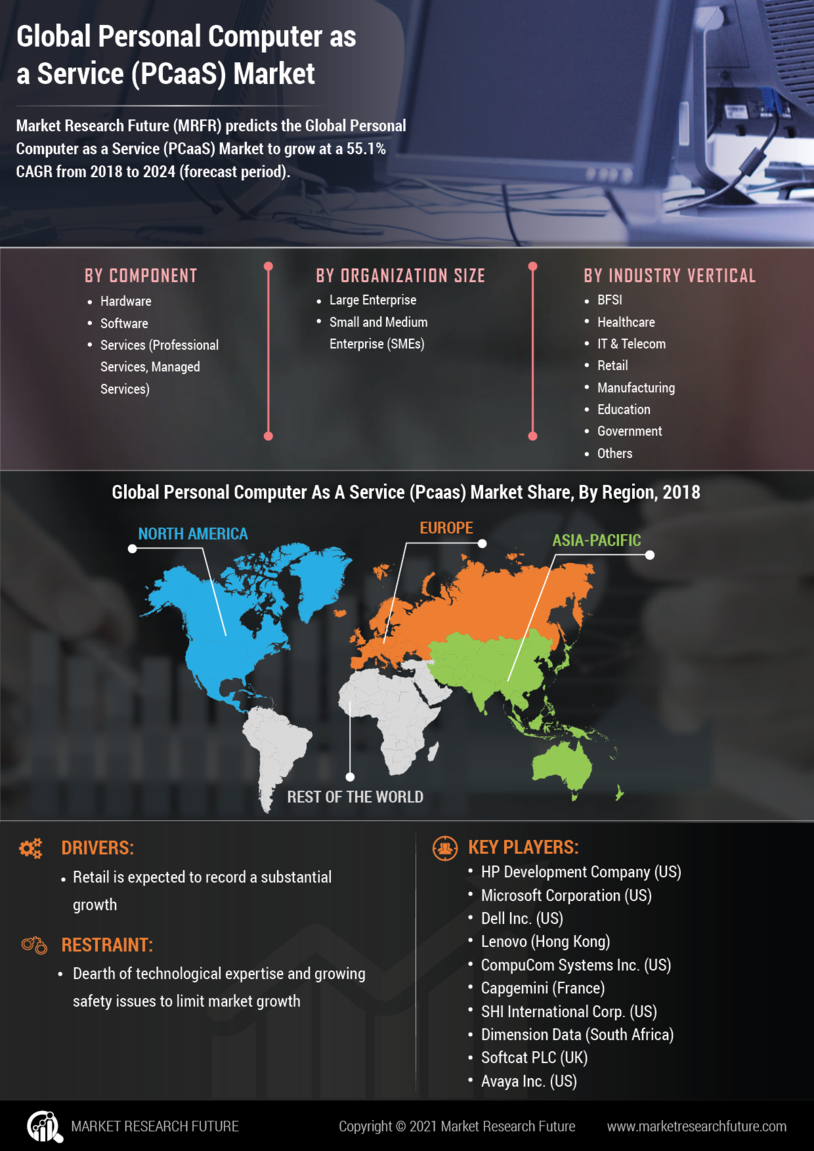
- SMEs
- Large Enterprises
Information and Communications Technology By Component (USD Billion, 2025-2035)
- Hardware
- Software
Information and Communications Technology By Vertical (USD Billion, 2025-2035)
- BFSI
- Government
- Education
- Healthcare & Life Science
- IT & Telecommunication


