Patient Access Solutions Market Segmentation
Patient Access Solutions Market By Service (USD Billion, 2025-2035)
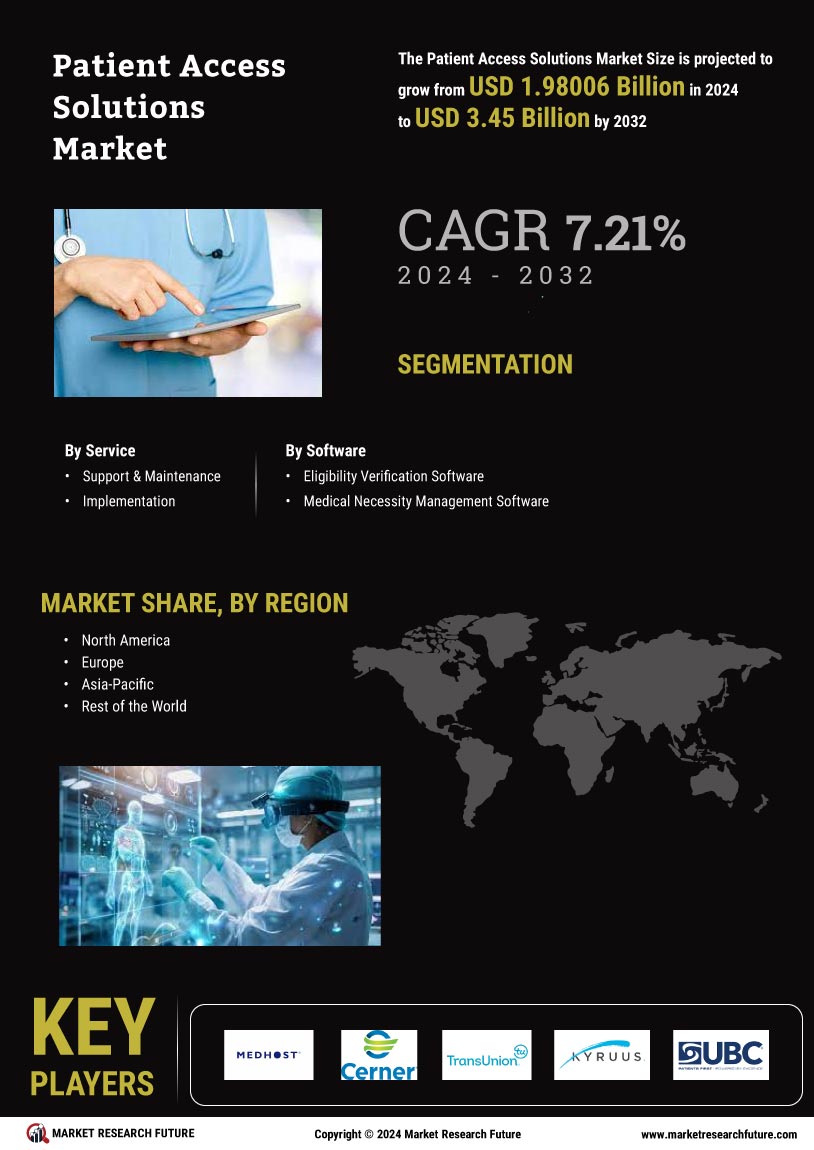
- Support & Maintenance
- Implementation
Patient Access Solutions Market By Patient Access Solutions Market (USD Billion, 2025-2035)
- Eligibility Verification Patient Access Solutions Market
- Medical Necessity Management Patient Access Solutions Market