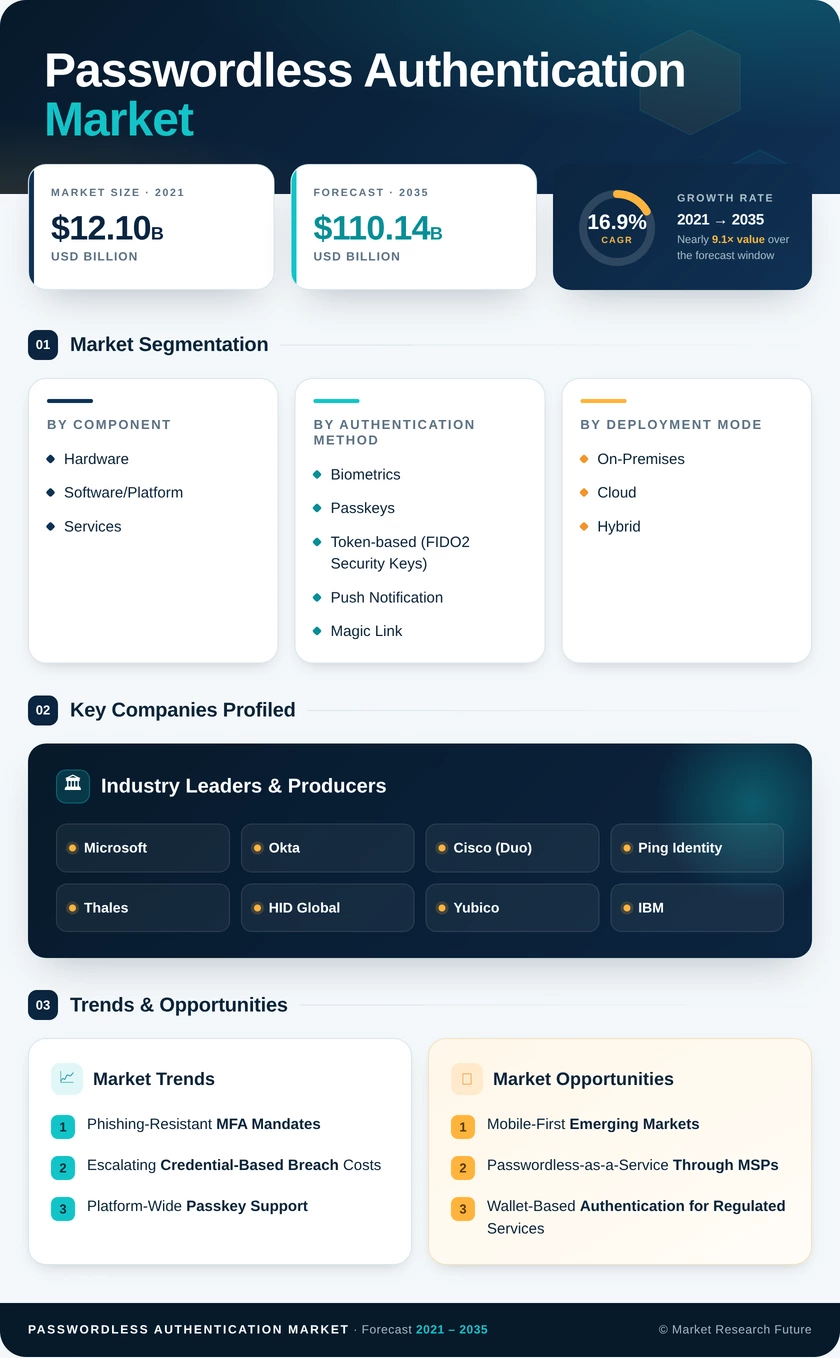
Passwordless Authentication Market (2026 - 2035)

ID: MRFR/ICT/22639-HCR 100 Pages Ankit Gupta Last Updated: October 13, 2026
Passwordless Authentication Market Size, Share and Research Report By Component (Hardware, Software/Platform, Services), By Authentication Method (Biometrics, Passkeys, Token-based (FIDO2 Security Keys), Push Notification and Magic Link, Smart Card and PKI), By Deployment Mode (On-Premises, Cloud, Hybrid), By Organization Size (Small and Medium Enterprises, Large Enterprises), By End-User Industry (BFSI, IT and Telecom, Healthcare, Government and Defense, Retail and E-commerce, Manufacturing, Others) - Industry Forecast to 2035.
Passwordless Authentication Market
Market Size
Forecast Period2026-2035
CAGR (2026-2035)16.9%
2025 Market SizeUSD 22.40 Billion
2035 Market SizeUSD 110.14 Billion
Key Players
Microsoft
Okta
Cisco
Ping Identity
Thales
HID Global
Opportunities
  • Mobile-First Emerging Markets
  • Passwordless-as-a-Service Through MSPs
  • Wallet-Based Authentication for Regulated Services
  1. 1 Market Summary | |
  2. 2 Key Report Takeaways | |
    1. 2.1 By Component | |
    2. 2.2 By Authentication Method | |
    3. 2.3 By Deployment Mode | |
    4. 2.4 By Organization Size | |
    5. 2.5 By End-User Industry | |
    6. 2.6 By Region | |
  3. 3 Market Size and Forecast (2021–2035) | |
  4. 4 Driver Impact Analysis | |
    1. 4.1 Phishing-Resistant MFA Mandates | |
    2. 4.2 Escalating Credential-Based Breach Costs | |
    3. 4.3 Platform-Wide Passkey Support | |
    4. 4.4 Zero-Trust Architecture Adoption | |
    5. 4.5 National Digital ID and Wallet Programs | |
    6. 4.6 Checkout Conversion and Payment Security Rules | |
    7. 4.7 Helpdesk Cost Reduction | |
  5. 5 Restraints Impact Analysis | |
    1. 5.1 Legacy Application Integration Complexity | |
    2. 5.2 Account Recovery and Device Loss Risk | |
    3. 5.3 Biometric Privacy Regulation | |
    4. 5.4 Upfront Cost for Smaller Organizations | |
    5. 5.5 Interoperability Fragmentation Across Ecosystems | |
  6. 6 Opportunities | |
    1. 6.1 Mobile-First Emerging Markets | |
    2. 6.2 Passwordless-as-a-Service Through MSPs | |
    3. 6.3 Wallet-Based Authentication for Regulated Services | |
    4. 6.4 Workforce and Operational Technology Identities | |
    5. 6.5 Fraud Analytics on Authentication Signals | |
  7. 7 Regional Market Share and Country-Level Analysis | |
    1. 7.1 North America | | |
      1. 7.1.1 US | | |
      2. 7.1.2 Canada | | |
      3. 7.1.3 Mexico | |
    2. 7.2 Europe | | |
      1. 7.2.1 Germany | | |
      2. 7.2.2 UK | | |
      3. 7.2.3 France | | |
      4. 7.2.4 Italy | | |
      5. 7.2.5 Spain | | |
      6. 7.2.6 Nordic Countries | | |
      7. 7.2.7 Russia | | |
      8. 7.2.8 Rest of Europe | |
    3. 7.3 Asia-Pacific | | |
      1. 7.3.1 China | | |
      2. 7.3.2 India | | |
      3. 7.3.3 Japan | | |
      4. 7.3.4 South Korea | | |
      5. 7.3.5 ASEAN | | |
      6. 7.3.6 Rest of Asia-Pacific | |
    4. 7.4 South America | | |
      1. 7.4.1 Brazil | | |
      2. 7.4.2 Argentina | | |
      3. 7.4.3 Rest of South America | |
    5. 7.5 Middle East & Africa | | |
      1. 7.5.1 Saudi Arabia | | |
      2. 7.5.2 UAE | | |
      3. 7.5.3 South Africa | | |
      4. 7.5.4 Egypt | | |
      5. 7.5.5 Rest of MEA | |
  8. 8 Future Outlook (2026–2035) | |
    1. 8.1 AI-Driven Adaptive Authentication | |
    2. 8.2 Deepfake and Injection Attack Defense | |
    3. 8.3 Hyperscaler Bundling and Platform Economics | |
    4. 8.4 Convergence with Digital Wallets and Verifiable Credentials | |
  9. 9 Segmentation Analysis | |
    1. 9.1 By Component | | |
      1. 9.1.1 Hardware | | |
      2. 9.1.2 Software/Platform | | |
      3. 9.1.3 Services | |
    2. 9.2 By Authentication Method | | |
      1. 9.2.1 Biometrics | | |
      2. 9.2.2 Passkeys | | |
      3. 9.2.3 Token-based (FIDO2 Security Keys) | | |
      4. 9.2.4 Push Notification and Magic Link | | |
      5. 9.2.5 Smart Card and PKI | |
    3. 9.3 By Deployment Mode | | |
      1. 9.3.1 On-Premises | | |
      2. 9.3.2 Cloud | | |
      3. 9.3.3 Hybrid | |
    4. 9.4 By Organization Size | | |
      1. 9.4.1 Small and Medium Enterprises | | |
      2. 9.4.2 Large Enterprises | |
    5. 9.5 By End-User Industry | | |
      1. 9.5.1 BFSI | | |
      2. 9.5.2 IT and Telecom | | |
      3. 9.5.3 Healthcare | | |
      4. 9.5.4 Government and Defense | | |
      5. 9.5.5 Retail and E-commerce | | |
      6. 9.5.6 Manufacturing | | |
      7. 9.5.7 Others | |
  10. 10 Competitive Landscape | |
    1. 10.1 Market Concentration Analysis | |
    2. 10.2 Competitive Benchmarking Matrix | |
  11. 11 Recent News & Developments | |
  12. 12 Report Scope and Methodology | |
  13. 13 Detailed Sources and Citations | |
  14. 14 Frequently Asked Questions (FAQs) | | LIST OF TABLES | |
  15. TABLE 1 Global Passwordless Authentication Market Summary Snapshot, 2025–2035 | |
  16. TABLE 2 Global Passwordless Authentication Market Size & Forecast, by Revenue (USD Billion), 2021–2035 | |
  17. TABLE 3 Driver Impact Analysis – Passwordless Authentication, 2026–2035 | |
  18. TABLE 4 Restraints Impact Analysis – Passwordless Authentication, 2026–2035 | |
  19. TABLE 5 Global Passwordless Authentication Market, by Region, 2025 | |
  20. TABLE 6 North America Passwordless Authentication Market, by Country, 2025 | |
  21. TABLE 7 Europe Passwordless Authentication Market, by Country, 2025 | |
  22. TABLE 8 Asia-Pacific Passwordless Authentication Market, by Country, 2025 | |
  23. TABLE 9 South America Passwordless Authentication Market, by Country, 2025 | |
  24. TABLE 10 Middle East & Africa Passwordless Authentication Market, by Country, 2025 | |
  25. TABLE 11 Global Passwordless Authentication Market, by Component, 2025–2035 | |
  26. TABLE 12 Global Passwordless Authentication Market, by Authentication Method, 2025–2035 | |
  27. TABLE 13 Global Passwordless Authentication Market, by Deployment Mode, 2025–2035 | |
  28. TABLE 14 Global Passwordless Authentication Market, by Organization Size, 2025–2035 | |
  29. TABLE 15 Global Passwordless Authentication Market, by End-User Industry, 2025–2035 | |
  30. TABLE 16 Competitive Benchmarking Matrix – Passwordless Authentication, 2025 | |
  31. TABLE 17 Report Scope and Methodology | |
  32. TABLE 18 Detailed Sources and Citations | |
  33. TABLE 19 Segmentation Quick Reference | | LIST OF FIGURES | |
  34. FIGURE 1 Market Dynamics Overview – Drivers, Restraints, Opportunities | |
  35. FIGURE 2 Passwordless Authentication Value Chain Analysis | |
  36. FIGURE 3 Porter's Five Forces Analysis | |
  37. FIGURE 4 Global Market Size Trend, 2021–2035 (USD Billion) | |
  38. FIGURE 5 Year-over-Year Growth Rate, 2022–2035 | |
  39. FIGURE 6 Market Share by Component, 2025 | |
  40. FIGURE 7 Market Share by Authentication Method, 2025 | |
  41. FIGURE 8 Market Share by Deployment Mode, 2025 | |
  42. FIGURE 9 Market Share by Organization Size, 2025 | |
  43. FIGURE 10 Market Share by End-User Industry, 2025 | |
  44. FIGURE 11 Regional Market Share, 2025 | |
  45. FIGURE 12 Regional Growth Comparison, 2026–2035 | |
  46. FIGURE 13 Competitive Landscape – Vendor Positioning Map, 2025 | |
  47. FIGURE 14 Estimated Revenue Share Ranges of Key Players, 2025

Segmentation Quick Reference

DimensionSub-SegmentsDominant SegmentFastest Growing Segment
By ComponentHardware, Software/Platform, ServicesSoftware/Platform (66.5% share)Services (18.0% CAGR)
By Authentication MethodBiometrics, Passkeys, Token-based (FIDO2 Security Keys), Push Notification and Magic Link, Smart Card and PKIBiometrics (45.8% share)Passkeys (18.3% CAGR)
By Deployment ModeOn-Premises, Cloud, HybridCloud (52.9% share)Hybrid (19.8% CAGR)
By Organization SizeSmall and Medium Enterprises, Large EnterprisesLarge Enterprises (58.4% share)Small and Medium Enterprises (18.8% CAGR)
By End-User IndustryBFSI, IT and Telecom, Healthcare, Government and Defense, Retail and E-commerce, Manufacturing, OthersBFSI (26.3% share)Retail and E-commerce (18.1% CAGR)
By RegionNorth America, Europe, Asia-Pacific, South America, Middle East & AfricaNorth America (35.5% share)Asia-Pacific (19.3% CAGR)

Market Segmentation Overview

By Component

Sub-SegmentKey Trend
HardwareFIPS-validated security keys retained for administrators and air-gapped networks
Software/PlatformIdentity suites consolidate authentication, orchestration, and policy
ServicesIntegration and adoption programs become decisive for project ROI

Software/Platform leads with a 66.5% share because authentication policy, orchestration, and passkey management run inside enterprise identity suites. Services grow fastest at 18.0% CAGR, since recovery design, legacy integration, and enrollment campaigns determine whether passwords can be switched off. Hardware keeps a defensible role where FIPS rules or offline recovery demand physical authenticators.

By Authentication Method

Sub-SegmentKey Trend
BiometricsOn-device fingerprint and face matching becomes the default user gesture
PasskeysSynced credentials remove hardware logistics and spread across ecosystems
Token-based (FIDO2 Security Keys)Device-bound keys secure privileged and high-assurance access
Push Notification and Magic LinkUsed as a bridge by organizations not yet ready for FIDO
Smart Card and PKIMandated in defense and critical infrastructure

Biometrics holds a 45.8% share because nearly every smartphone and laptop ships with a capable sensor. Passkeys post the fastest growth at 18.3% CAGR, as synced credentials avoid the issuance cost of security keys while remaining phishing-resistant. Push Notification and Magic Link methods will gradually lose ground as regulators exclude approval-based prompts from phishing-resistant definitions.

By Deployment Mode

Sub-SegmentKey Trend
On-PremisesContainerized FIDO servers modernize classified environments
CloudSaaS identity platforms dominate new deployments
HybridLocal key custody paired with cloud policy orchestration

Cloud leads with a 52.9% share because SaaS removes infrastructure upkeep and delivers faster security updates. Hybrid expands at 19.8% CAGR as data-residency rules in Germany, India, and the Gulf require signing keys to stay within national borders. On-Premises demand narrows to defense and sensitive research sites running containerized servers.

By Organization Size

Sub-SegmentKey Trend
Small and Medium EnterprisesMSP bundles and subscription tiers lower entry barriers
Large EnterprisesEnterprise-wide password retirement programs

Large Enterprises hold a 58.4% share, funding organization-wide programs that span workforce, partners, and customers. Small and Medium Enterprises grow fastest at 18.8% CAGR as managed providers bundle passwordless login with endpoint management at predictable monthly prices. Pre-configured templates derived from large-enterprise rollouts shorten SME deployment timelines from months to weeks.

By End-User Industry

Sub-SegmentKey Trend
BFSIAccount takeover losses and regulatory scrutiny drive device-bound credentials
IT and TelecomSIM-swap fraud pushes operators away from SMS codes
HealthcareTap-and-go access speeds clinician workflows
Government and DefenseZero-trust mandates and citizen digital ID portals
Retail and E-commercePasskeys at checkout reduce cart abandonment
ManufacturingBadge and key access for shared OT terminals
OthersEducation, energy, and professional services adopt cloud identity

BFSI leads with a 26.3% share because institutions bear fraud losses directly and face strict authentication rules from payment regulators. Retail and E-commerce grow fastest at 18.1% CAGR, as replacing one-time codes with passkeys measurably lifts checkout completion. Healthcare and Manufacturing adopt shared-device patterns, using badges and security keys where personal phones are impractical.


Download PDF ×

We do not share your information with anyone. However, we may send you emails based on your report interest from time to time. You may contact us at any time to opt-out.