Certified Global Research Member
Isomar fd.webp Wcrc 57.webp
Key Questions Answered
  • Global Market Outlook
  • In-depth analysis of global and regional trends
  • Analyze and identify the major players in the market, their market share, key developments, etc.
  • To understand the capability of the major players based on products offered, financials, and strategies.
  • Identify disrupting products, companies, and trends.
  • To identify opportunities in the market.
  • Analyze the key challenges in the market.
  • Analyze the regional penetration of players, products, and services in the market.
  • Comparison of major players’ financial performance.
  • Evaluate strategies adopted by major players.
  • Recommendations
Why Choose Market Research Future?
  • Vigorous research methodologies for specific market.
  • Knowledge partners across the globe
  • Large network of partner consultants.
  • Ever-increasing/ Escalating data base with quarterly monitoring of various markets
  • Trusted by fortune 500 companies/startups/ universities/organizations
  • Large database of 5000+ markets reports.
  • Effective and prompt pre- and post-sales support.

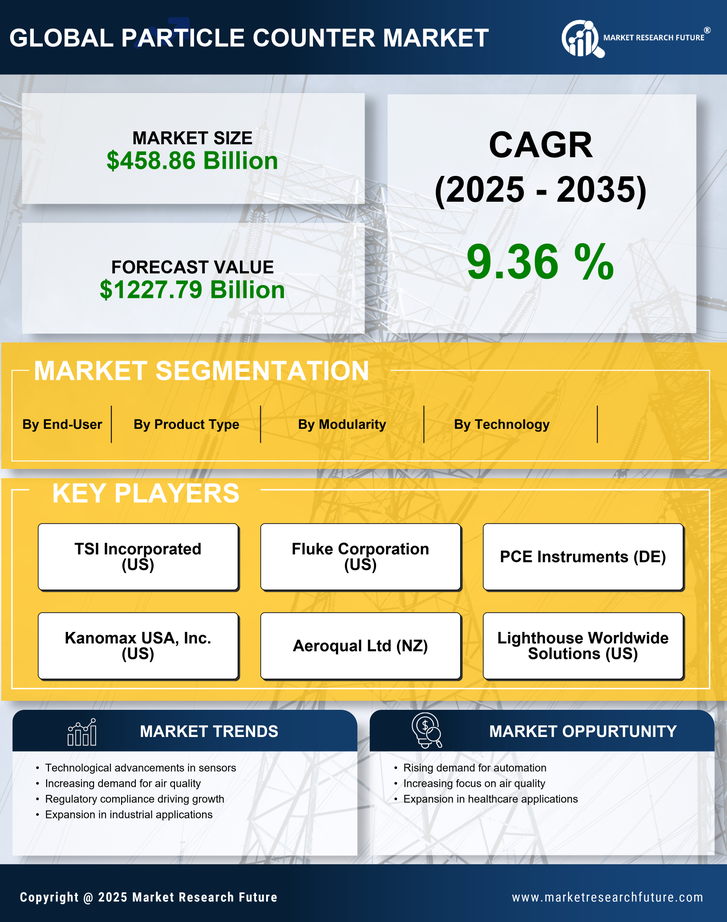
Particle Counter Market Segmentation by Product Type: Airborne Particle Counters, Liquid Particle Counters; Technology: Online Particle Counters, Offline Particle Counters; Modularity: Portable Particle Counters, Remote Particle Counters, Handheld Particle Counters; End-User: Medical Device Industry, Pharmaceutical Industry, Research Laboratories - Forecast to 2030


ID: MRFR/HC/7304-HCR | 117 Pages | Author: Rahul Gotadki| April 2024
Leading companies partner with us for data-driven Insights
client_1 client_2 client_3 client_4 client_5 client_6 client_7 client_8 client_9 client_10
Please fill in Business Email for Quick Response

Table of Contents

1. EXECUTIVE SUMMARY

2. MARKET INTRODUCTION

2.1. Definition

2.2. Scope of the Study

2.2.1. Research Objective

2.2.2. Assumptions

2.2.3. Limitations

3. RESEARCH METHODOLOGY

3.1. Overview

3.2. Primary Research

3.3. Secondary Research

3.4. Market Size Estimation

4. MARKET DYNAMICS

4.1. Overview

4.2. Drivers

4.3. Restraints

4.4. Opportunities

5. MARKET FACTOR ANALYSIS

5.1. Porter’s Five Forces Analysis

5.1.1. Bargaining Power of Suppliers

5.1.2. Bargaining Power of Buyers

5.1.3. Threat of New Entrants

5.1.4. Threat of Substitutes

5.1.5. Intensity of Rivalry

5.2. Value Chain Analysis/Supply Chain Analysis

6. GLOBAL PARTICLE COUNTER MARKET, BY PRODUCT TYPE

6.1. Overview

6.2. Airborne Particle Counters

Market Estimates & Forecast, by Region, 2020-2027

Market Estimates & Forecast, by Country, 2020-2027

6.3. Liquid Particle Counters

Market Estimates & Forecast, by Region, 2020-2027

Market Estimates & Forecast, by Country, 2020-2027

7. GLOBAL PARTICLE COUNTER MARKET, BY MODULARITY

7.1. Overview

7.2. Portable Particle Counters

Market Estimates & Forecast, by Region, 2020-2027

Market Estimates & Forecast, by Country, 2020-2027

7.3. Remote Particle Counters

Market Estimates & Forecast, by Region, 2020-2027

Market Estimates & Forecast, by Country, 2020-2027

7.4. Handheld Particle Counters

Market Estimates & Forecast, by Region, 2020-2027

Market Estimates & Forecast, by Country, 2020-2027

8. GLOBAL PARTICLE COUNTER MARKET, BY TECHNOLOGY

8.1. Overview

8.2. Online Particle Counters

Market Estimates & Forecast, by Region, 2020-2027

Market Estimates & Forecast, by Country, 2020-2027

8.3. Offline Particle Counters

Market Estimates & Forecast, by Region, 2020-2027

Market Estimates & Forecast, by Country, 2020-2027

9. GLOBAL PARTICLE COUNTER MARKET, BY END USER

9.1. Overview

9.2. Medical Device Industry

Market Estimates & Forecast, by Region, 2020-2027

Market Estimates & Forecast, by Country, 2020-2027

9.3. Pharmaceutical Industry

Market Estimates & Forecast, by Region, 2020-2027

Market Estimates & Forecast, by Country, 2020-2027

9.4. Research Laboratories

Market Estimates & Forecast, by Region, 2020-2027

Market Estimates & Forecast, by Country, 2020-2027

9.5. Others

Market Estimates & Forecast, by Region, 2020-2027

Market Estimates & Forecast, by Country, 2020-2027

10. GLOBAL PARTICLE COUNTER MARKET, BY REGION

10.1. Overview

10.2. Americas

10.2.1. North America

10.2.1.1. US

10.2.1.2. Canada

10.2.2. Latin America

10.3. Europe

10.3.1. Western Europe

10.3.1.1. Germany

10.3.1.2. France

10.3.1.3. Italy

10.3.1.4. Spain

10.3.1.5. UK

10.3.1.6. Rest of Western Europe

10.3.2. Eastern Europe

10.4. Asia-Pacific

10.4.1. Japan

10.4.2. China

10.4.3. India

10.4.4. Australia

10.4.5. South Korea

10.4.6. Rest of Asia-Pacific

10.5. Middle East & Africa

10.5.1. Middle East

10.5.2. Africa

11. COMPANY LANDSCAPE

11.1.1. Overview

11.1.2. Competitive Analysis

11.1.3. Market Share Analysis

11.1.4. Major Growth Strategy in the global particle counter market

11.1.5. Competitive Benchmarking

11.1.6. Leading Player in terms of Number of Developments in the global particle counter market

11.1.7. Key Developments & Growth Strategies

11.1.7.1. Product Launch

11.1.7.2. Merger & Acquisition

11.1.7.3. Joint Ventures

11.1.8. Major Players Financial Matrix

11.1.8.1. Sales & Operating Income 2020

11.1.8.2. Major Players R&D Expenditure 2020

12. COMPANY PROFILES

12.1. Beckman Coulter (A Danaher Corporation Company)

12.1.1. Company Overview

12.1.2. Product Type Overview

12.1.3. Financial Overview

12.1.4. Key Developments

12.1.5. SWOT Analysis

12.1.6. Key Strategies

12.2. Particle Measuring Systems, Inc. (A Spectris Company)

12.2.1. Company Overview

12.2.2. Product Type Overview

12.2.3. Financial Overview

12.2.4. Key Developments

12.2.5. SWOT Analysis

12.2.6. Key Strategies

12.3. Rion Co., Ltd.

12.3.1. Company Overview

12.3.2. Product Type Overview

12.3.3. Financial Overview

12.3.4. Key Developments

12.3.5. SWOT Analysis

12.3.6. Key Strategies

12.4. Lighthouse Worldwide Solutions, Inc.

12.4.1. Company Overview

12.4.2. Product Type Overview

12.4.3. Financial Overview

12.4.4. Key Developments

12.4.5. SWOT Analysis

12.4.6. Key Strategies

12.5. TSI Incorporated

12.5.1. Company Overview

12.5.2. Product Type Overview

12.5.3. Financial Overview

12.5.4. Key Developments

12.5.5. SWOT Analysis

12.5.6. Key Strategies

12.6. Climet Instruments Company

12.6.1. Company Overview

12.6.2. Product Type Overview

12.6.3. Financial Overview

12.6.4. Key Developments

12.6.5. SWOT Analysis

12.6.6. Key Strategies

12.7. Setra Systems

12.7.1. Company Overview

12.7.2. Product Type Overview

12.7.3. Financial Overview

12.7.4. Key Developments

12.7.5. SWOT Analysis

12.7.6. Key Strategies

12.8. Met One Instruments, Inc.

12.8.1. Company Overview

12.8.2. Product Type Overview

12.8.3. Financial Overview

12.8.4. Key Developments

12.8.5. SWOT Analysis

12.8.6. Key Strategies

12.9. Chemtrac, Inc.

12.9.1. Company Overview

12.9.2. Product Type Overview

12.9.3. Financial Overview

12.9.4. Key Developments

12.9.5. SWOT Analysis

12.9.6. Key Strategies

12.10. Others

13. APPENDIX

13.1. References

13.2. Related Reports

LIST OF TABLES

TABLE 1 GLOBAL PARTICLE COUNTER MARKET SYNOPSIS, 2020-2027

TABLE 2 GLOBAL PARTICLE COUNTER MARKET ESTIMATES & FORECAST, 2020-2027 (USD MILLION)

TABLE 3 GLOBAL PARTICLE COUNTER MARKET, BY PRODUCT TYPE, 2020-2027 (USD MILLION)

TABLE 4 GLOBAL PARTICLE COUNTER MARKET, BY TECHNOLOGY, 2020-2027 (USD MILLION)

TABLE 5 GLOBAL PARTICLE COUNTER MARKET, BY MODULARITY, 2020-2027 (USD MILLION)

TABLE 6 GLOBAL PARTICLE COUNTER MARKET, BY END USER, 2020-2027 (USD MILLION)

TABLE 7 GLOBAL PARTICLE COUNTER MARKET, BY REGION, 2020-2027 (USD MILLION)

TABLE 8 NORTH AMERICA: PARTICLE COUNTER MARKET, BY PRODUCT TYPE, 2020-2027 (USD MILLION)

TABLE 9 NORTH AMERICA: PARTICLE COUNTER MARKET, BY TECHNOLOGY, 2020-2027 (USD MILLION)

TABLE 10 NORTH AMERICA: PARTICLE COUNTER MARKET, BY MODULARITY, 2020-2027 (USD MILLION)

TABLE 11 NORTH AMERICA: PARTICLE COUNTER MARKET, BY END USER, 2020-2027 (USD MILLION)

TABLE 12 US: PARTICLE COUNTER MARKET, BY PRODUCT TYPE, 2020-2027 (USD MILLION)

TABLE 13 US: PARTICLE COUNTER MARKET, BY TECHNOLOGY, 2020-2027 (USD MILLION)

TABLE 14 US: PARTICLE COUNTER MARKET, BY MODULARITY, 2020-2027 (USD MILLION)

TABLE 15 US: PARTICLE COUNTER MARKET, BY END USER, 2020-2027 (USD MILLION)

TABLE 16 CANADA: PARTICLE COUNTER MARKET, BY PRODUCT TYPE, 2020-2027 (USD MILLION)

TABLE 17 CANADA: PARTICLE COUNTER MARKET, BY TECHNOLOGY, 2020-2027 (USD MILLION)

TABLE 18 CANADA: PARTICLE COUNTER MARKET, BY MODULARITY, 2020-2027 (USD MILLION)

TABLE 19 CANADA: PARTICLE COUNTER MARKET, BY END USER, 2020-2027 (USD MILLION)

TABLE 20 LATIN AMERICA: PARTICLE COUNTER MARKET, BY PRODUCT TYPE, 2020-2027 (USD MILLION)

TABLE 21 LATIN AMERICA: PARTICLE COUNTER MARKET, BY TECHNOLOGY, 2020-2027 (USD MILLION)

TABLE 22 LATIN AMERICA: PARTICLE COUNTER MARKET, BY MODULARITY, 2020-2027 (USD MILLION)

TABLE 23 LATIN AMERICA: PARTICLE COUNTER MARKET, BY END USER, 2020-2027 (USD MILLION)

TABLE 24 EUROPE: PARTICLE COUNTER MARKET, BY PRODUCT TYPE, 2020-2027 (USD MILLION)

TABLE 25 EUROPE: PARTICLE COUNTER MARKET, BY TECHNOLOGY, 2020-2027 (USD MILLION)

TABLE 26 EUROPE: PARTICLE COUNTER MARKET, BY MODULARITY, 2020-2027 (USD MILLION)

TABLE 27 EUROPE: PARTICLE COUNTER MARKET, BY END USER, 2020-2027 (USD MILLION)

TABLE 28 WESTERN EUROPE: PARTICLE COUNTER MARKET, BY PRODUCT TYPE, 2020-2027 (USD MILLION)

TABLE 29 WESTERN EUROPE: PARTICLE COUNTER MARKET, BY TECHNOLOGY, 2020-2027 (USD MILLION)

TABLE 30 WESTERN EUROPE: PARTICLE COUNTER MARKET, BY MODULARITY, 2020-2027 (USD MILLION)

TABLE 31 WESTERN EUROPE: PARTICLE COUNTER MARKET, BY END USER, 2020-2027 (USD MILLION)

TABLE 32 EASTERN EUROPE: PARTICLE COUNTER MARKET, BY PRODUCT TYPE, 2020-2027 (USD MILLION)

TABLE 33 EASTERN EUROPE: PARTICLE COUNTER MARKET, BY TECHNOLOGY, 2020-2027 (USD MILLION)

TABLE 34 EASTERN EUROPE: PARTICLE COUNTER MARKET, BY MODULARITY, 2020-2027 (USD MILLION)

TABLE 35 EASTERN EUROPE: PARTICLE COUNTER MARKET, BY END USER, 2020-2027 (USD MILLION)

TABLE 36 ASIA-PACIFIC: PARTICLE COUNTER MARKET, BY PRODUCT TYPE, 2020-2027 (USD MILLION)

TABLE 37 ASIA-PACIFIC: PARTICLE COUNTER MARKET, BY TECHNOLOGY, 2020-2027 (USD MILLION)

TABLE 38 ASIA-PACIFIC: PARTICLE COUNTER MARKET, BY MODULARITY, 2020-2027 (USD MILLION)

TABLE 39 ASIA-PACIFIC: PARTICLE COUNTER MARKET, BY END USER, 2020-2027 (USD MILLION)

TABLE 40 MIDDLE EAST & AFRICA: PARTICLE COUNTER MARKET, BY PRODUCT TYPE, 2020-2027 (USD MILLION)

TABLE 41 MIDDLE EAST & AFRICA: PARTICLE COUNTER MARKET, BY TECHNOLOGY, 2020-2027 (USD MILLION)

TABLE 42 MIDDLE EAST & AFRICA: PARTICLE COUNTER MARKET, BY MODULARITY, 2020-2027 (USD MILLION)

TABLE 43 MIDDLE EAST & AFRICA: PARTICLE COUNTER MARKET, BY END USER, 2020-2027 (USD MILLION)  

LIST OF FIGURES

FIGURE 1 RESEARCH PROCESS

FIGURE 2 MARKET STRUCTURE FOR THE GLOBAL PARTICLE COUNTER MARKET

FIGURE 3 MARKET DYNAMICS FOR THE GLOBAL PARTICLE COUNTER MARKET

FIGURE 4 GLOBAL PARTICLE COUNTER MARKET SHARE, BY PRODUCT TYPE, 2020 (%)

FIGURE 5 GLOBAL PARTICLE COUNTER MARKET SHARE, BY TECHNOLOGY, 2020 (%)

FIGURE 6 GLOBAL PARTICLE COUNTER MARKET SHARE, BY MODULARITY, 2020 (%)

FIGURE 7 GLOBAL PARTICLE COUNTER MARKET SHARE, BY END USER, 2020 (%)

FIGURE 8 GLOBAL PARTICLE COUNTER MARKET SHARE, BY REGION, 2020 (%)

FIGURE 7 AMERICAS: PARTICLE COUNTER MARKET SHARE BY REGION, 2020 (%)

FIGURE 9 NORTH AMERICA: PARTICLE COUNTER MARKET SHARE, BY COUNTRY, 2020 (%)

FIGURE 10 EUROPE: PARTICLE COUNTER MARKET SHARE, BY REGION, 2020 (%)

FIGURE 11 WESTERN EUROPE: PARTICLE COUNTER MARKET SHARE, BY COUNTRY, 2020 (%)

FIGURE 12 ASIA-PACIFIC: PARTICLE COUNTER MARKET SHARE, BY COUNTRY, 2020 (%)

FIGURE 13 MIDDLE EAST & AFRICA: PARTICLE COUNTER MARKET SHARE, BY COUNTRY, 2020 (%)

FIGURE 14 GLOBAL PARTICLE COUNTER MARKET: COMPANY SHARE ANALYSIS, 2020 (%)

FIGURE 15 PARTICLE MEASURING SYSTEMS, INC.: KEY FINANCIALS

FIGURE 16 PARTICLE MEASURING SYSTEMS, INC.: SEGMENTAL REVENUE

FIGURE 17 PARTICLE MEASURING SYSTEMS, INC.: REGIONAL REVENUE

FIGURE 18 BECKMAN COULTER: KEY FINANCIALS

FIGURE 19 BECKMAN COULTER: SEGMENTAL REVENUE

FIGURE 20 BECKMAN COULTER: REGIONAL REVENUE

FIGURE 21 RION CO., LTD.: KEY FINANCIALS

FIGURE 22 RION CO., LTD.: SEGMENTAL REVENUE

FIGURE 23 RION CO., LTD.: REGIONAL REVENUE

FIGURE 24 LIGHTHOUSE WORLDWIDE SOLUTIONS, INC.: KEY FINANCIALS

FIGURE 25 LIGHTHOUSE WORLDWIDE SOLUTIONS, INC.: SEGMENTAL REVENUE

FIGURE 26 LIGHTHOUSE WORLDWIDE SOLUTIONS, INC.: REGIONAL REVENUE

FIGURE 27 TSI INCORPORATED: KEY FINANCIALS

FIGURE 28 TSI INCORPORATED: SEGMENTAL REVENUE

FIGURE 29 TSI INCORPORATED: REGIONAL REVENUE

FIGURE 30 SETRA SYSTEMS.: KEY FINANCIALS

FIGURE 31 SETRA SYSTEMS.: SEGMENTAL REVENUE

FIGURE 32 SETRA SYSTEMS.: REGIONAL REVENUE

FIGURE 33 CLIMET INSTRUMENTS COMPANY: KEY FINANCIALS

FIGURE 34 CLIMET INSTRUMENTS COMPANY: SEGMENTAL REVENUE

FIGURE 35 CLIMET INSTRUMENTS COMPANY: REGIONAL REVENUE

FIGURE 36 MET ONE INSTRUMENTS, INC.: KEY FINANCIALS

FIGURE 37 MET ONE INSTRUMENTS, INC.: SEGMENTAL REVENUE

FIGURE 38 MET ONE INSTRUMENTS, INC.: REGIONAL REVENUE

FIGURE 39 CHEMTRAC, INC.: KEY FINANCIALS

FIGURE 40 CHEMTRAC, INC.: SEGMENTAL REVENUE

FIGURE 41 CHEMTRAC, INC.: REGIONAL REVENUE

Purchase Option
Single User $ 4,950
Multiuser License $ 5,950
Enterprise User $ 7,250
Compare Licenses
Tailored for You
  • Dedicated Research on any specifics segment or region.
  • Focused Research on specific players in the market.
  • Custom Report based only on your requirements.
  • Flexibility to add or subtract any chapter in the study.
  • Historic data from 2014 and forecasts outlook till 2040.
  • Flexibility of providing data/insights in formats (PDF, PPT, Excel).
  • Provide cross segmentation in applicable scenario/markets.