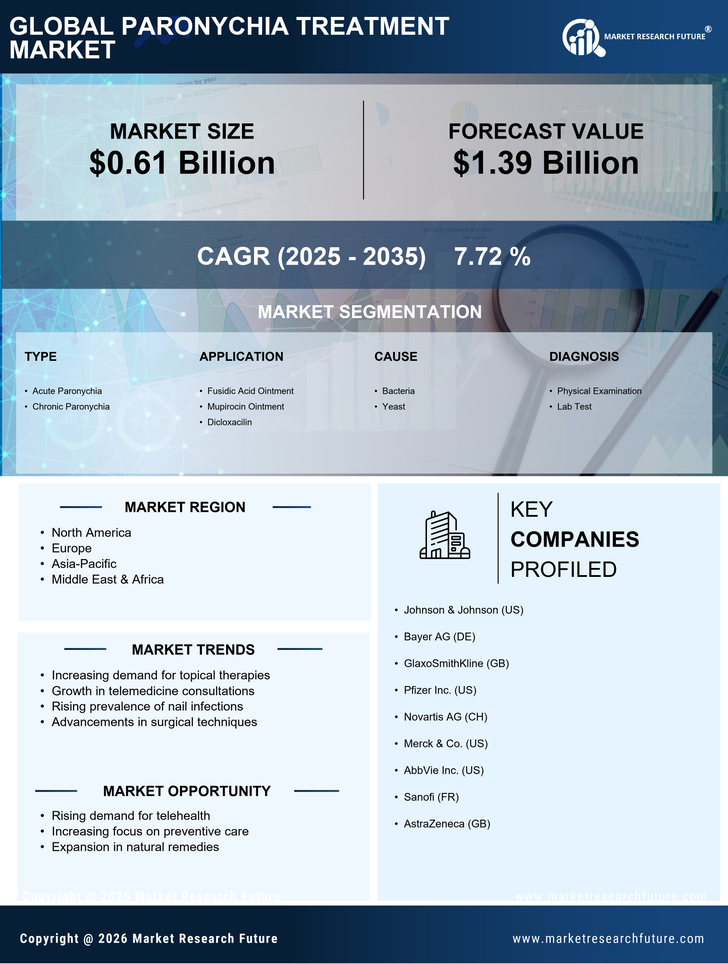
Certified Global Research Member
Isomar fd.webp Wcrc 57.webp
Key Questions Answered
  • Global Market Outlook
  • In-depth analysis of global and regional trends
  • Analyze and identify the major players in the market, their market share, key developments, etc.
  • To understand the capability of the major players based on products offered, financials, and strategies.
  • Identify disrupting products, companies, and trends.
  • To identify opportunities in the market.
  • Analyze the key challenges in the market.
  • Analyze the regional penetration of players, products, and services in the market.
  • Comparison of major players’ financial performance.
  • Evaluate strategies adopted by major players.
  • Recommendations
Why Choose Market Research Future?
  • Vigorous research methodologies for specific market.
  • Knowledge partners across the globe
  • Large network of partner consultants.
  • Ever-increasing/ Escalating data base with quarterly monitoring of various markets
  • Trusted by fortune 500 companies/startups/ universities/organizations
  • Large database of 5000+ markets reports.
  • Effective and prompt pre- and post-sales support.

Paronychia Treatment Market Research Report Information: By Type (Acute Paronychia, Chronic Paronychia, Candidal Paronychia) Application (Mupirocin Ointment, Fusidic Acid Ointment, Dicloxacillin) End User (Hospitals & Clinics, Dermatology Center) - Forecast till 2030


ID: MRFR/Pharma/1184-HCR | 80 Pages | Author: Kinjoll Dey| April 2024
Leading companies partner with us for data-driven Insights
client_1 client_2 client_3 client_4 client_5 client_6 client_7 client_8 client_9 client_10
Please fill in Business Email for Quick Response

Table of Content

1. Report Prologue

2. Market Introduction

2.1 Definition

2.2 Scope of the Study

2.2.1 Research Objective

2.2.2 Assumptions

2.2.3 Limitations

3. Research Methodology

3.1 Introduction

3.2 Primary Research

3.3 Secondary research

3.4 Market Size Estimation

4. Market Dynamics

4.1 Drivers

4.2 Restrains

4.3 Opportunities

4.4 Challenges

4.5 Macroeconomic Indicators

4.6 Technology Trends & Assessment

5. Market Factor Analysis

5.1 Porter’s Five Forces Analysis

5.1.1 Bargaining Power of Suppliers

5.1.2 Bargaining Power of Buyers

5.1.3 Threat of New Entrants

5.1.4 Threat of Substitutes

5.1.5 Intensity of Rivalry

5.2 Value Chain Analysis

5.3 Investment Feasibility Analysis

5.4 Pricing Analysis

6. Global Paronychia Treatment Market, by Types

6.1 Introduction

6.2 Acute Paronychia

6.2.1 Market Estimates & Forecast, 2020-2027

6.3 Chronic Paronychia

6.3.1 Market Estimates & Forecast, 2020-2027

6.4 Candidal Paronychia

6.4.1 Market Estimates & Forecast, 2020-2027

6.5 Pyogenic Paronychia

6.5.1 Market Estimates & Forecast, 2020-2027

6.6 Others

6.6.1 Market Estimates & Forecast, 2020-2027

7. Global Paronychia Treatment Market, by Application

7.1 Introduction

7.2 Mupirocin Ointment

7.2.1 Market Estimates & Forecast, 2020-2027

7.3 Fusidic Acid Ointment

7.3.1 Market Estimates & Forecast, 2020-2027

7.4 Gentamicin Ointment

7.4.1 Market Estimates & Forecast, 2020-2027

7.5 Dicloxacillin

7.5.1 Market Estimates & Forecast, 2020-2027

7.6 Others

7.6.1 Market Estimates & Forecast, 2020-2027

8. Global Paronychia Treatment Market, by End User

8.1 Introduction

8.2 Hospitals & Clinics

8.2.1 Market Estimates & Forecast, 2020-2027

8.3 Dermatology Center

8.3.1 Market Estimates & Forecast, 2020-2027

8.4 Others

8.4.1 Market Estimates & Forecast, 2020-2027

9. Global Paronychia Treatment Market, by Region

9.1 Introduction

9.2 Americas

9.2.1 North America

9.2.1.1 U.S.

9.2.1.2 Canada

9.2.2 South America

9.3 Europe

9.3.1 Western Europe

9.3.1.1 Germany

9.3.1.2 France

9.3.1.3 U.K

9.3.1.4 Italy

9.3.1.5 Spain

9.3.1.6 Rest of Western Europe

9.3.2 Eastern Europe

9.4 Asia Pacific

9.4.1 Japan

9.4.2 China

9.4.3 India

9.4.4 Australia

9.4.5 Republic of Korea

9.4.6 Rest of Asia Pacific

9.5 The Middle East & Africa

9.5.1 United Arab Emirates

9.5.2 Saudi Arabia

9.5.3 Oman

9.5.4 Kuwait

9.5.5 Qatar

9.5.6 Rest of the Middle East & Africa

10 Company Landscape

10.1 Introduction

10.2 Market Share Analysis

10.3 Key Development & Strategies

10.3.1 Key Developments

11 Company Profiles

11.1 GlaxoSmithKline plc

11.1.1 Company Overview

11.1.2 Product Overview

11.1.3 Financials

11.1.4 SWOT Analysis

11.2 Glenmark Generics Ltd.

11.2.1 Company Overview

11.2.2 Product Overview

11.2.3 Financial Overview

11.2.4 Key Developments

11.2.5 SWOT Analysis

11.3 Teva Pharmaceutical Industries Ltd.

11.3.1 Company Overview

11.3.2 Product Overview

11.3.3 Financial Overview

11.3.4 Key Development

11.3.5 SWOT Analysis

11.4 Eli Lilly Company

11.4.1 Company Overview

11.4.2 Product/Business Segment Overview

11.4.3 Financial Overview

11.4.4 Key Development

11.4.5 SWOT Analysis

11.5 Jonakayem Pharma Formulation Pvt. Ltd.

11.5.1 Company Overview

11.5.2 Product Overview

11.5.3 Financial overview

11.5.4 Key Developments

11.6 Fougera Pharmaceuticals Inc.

11.6.1 Company Overview

11.6.2 Product Overview

11.6.3 Financial Overview

11.6.4 Key Developments

11.7 Taro Pharmaceutical Industries Ltd.

11.7.1 Overview

11.7.2 Product Overview

11.7.3 Financials

11.7.4 Key Developments

11.7.5 SWOT Analysis

11.8 Others

12 MRFR Conclusion

12.1 Key Findings

12.1.1 From CEO’s View Point

12.1.2 Unmet Needs of the Market

12.2 Key Companies to Watch

12.3 Prediction of Pharmaceutical Industry

13 Appendix

LIST OF TABLES

Table 1 Paronychia Treatment Industry Synopsis, 2020-2027

Table 2 Global Paronychia Treatment Market Estimates and Forecast, 2020-2027, (USD Million)

Table 3 Global Paronychia Treatment Market by Region, 2020-2027, (USD Million)

Table 4 Global Paronychia Treatment Market by Types, 2020-2027, (USD Million)

Table 5 Global Paronychia Treatment Market by Application, 2020-2027, (USD Million)

Table 6 Global Paronychia Treatment Market by End Users, 2020-2027, (USD Million)

Table 7 North America Paronychia Treatment Market by Types, 2020-2027, (USD Million)

Table 8 North America Paronychia Treatment Market by Application, 2020-2027, (USD Million)

Table 9 North America Paronychia Treatment Market by End Users, 2020-2027, (USD Million)

Table 10 US Paronychia Treatment Market by Types, 2020-2027, (USD Million)

Table 11 US Paronychia Treatment Market by Application, 2020-2027, (USD Million)

Table 12 US Paronychia Treatment Market by End Users, 2020-2027, (USD Million)

Table 13 Canada Paronychia Treatment Market by Types, 2020-2027, (USD Million)

Table 14 Canada Paronychia Treatment Market by Application, 2020-2027, (USD Million)

Table 15 Canada Paronychia Treatment Market by End Users, 2020-2027, (USD Million)

Table 16 South America Paronychia Treatment Market by Types, 2020-2027, (USD Million)

Table 17 South America Paronychia Treatment Market by Application, 2020-2027, (USD Million)

Table 18 South America Paronychia Treatment Market by End Users, 2020-2027, (USD Million)

Table 19 Europe Paronychia Treatment Market by Types, 2020-2027, (USD Million)

Table 20 Europe Paronychia Treatment Market by Application, 2020-2027, (USD Million)

Table 21 Europe Paronychia Treatment Market by End Users, 2020-2027, (USD Million)

Table 22 Western Europe Paronychia Treatment Market by Types, 2020-2027, (USD Million)

Table 23 Western Europe Paronychia Treatment Market by Application, 2020-2027, (USD Million)

Table 24 Western Europe Paronychia Treatment Market by End Users, 2020-2027, (USD Million)

Table 25 Eastern Europe Paronychia Treatment Market by Types, 2020-2027, (USD Million)

Table 26 Eastern Europe Paronychia Treatment Market by Application, 2020-2027, (USD Million)

Table 27 Eastern Europe Paronychia Treatment Market by End Users, 2020-2027, (USD Million)

Table 28 Asia Pacific Paronychia Treatment Market by Types, 2020-2027, (USD Million)

Table 29 Asia Pacific Paronychia Treatment Market by Application, 2020-2027, (USD Million)

Table 30 Asia Pacific Paronychia Treatment Market by End Users, 2020-2027, (USD Million)

Table 31 Middle East & Africa Paronychia Treatment Market by Types, 2020-2027, (USD Million)

Table 32 Middle East & Africa Paronychia Treatment Market by Application, 2020-2027, (USD Million)

Table 33 Middle East & Africa Paronychia Treatment Market by End Users, 2020-2027, (USD Million)
LIST OF FIGURES

Figure 1 Research Process

Figure 2 Segmentation for Global Paronychia Treatment Market

Figure 3 Segmentation Market Dynamics for Paronychia Treatment Market

Figure 4 Global Paronychia Treatment Market Share, by Types 2020

Figure 5 Global Paronychia Treatment Market Share, by Application 2020

Figure 6 Global Paronychia Treatment Market Share, by End Users, 2020

Figure 7 Global Paronychia Treatment Market Share, by Region, 2020

Figure 8 Americas Paronychia Treatment Market Share, by Country, 2020

Figure 9 Europe Paronychia Treatment Market Share, by Country, 2020

Figure 10 Asia Pacific Paronychia Treatment Market Share, by Country, 2020

Figure 11 Middle East & Africa Paronychia Treatment Market Share, by Country, 2020

Figure 12 Global Paronychia Treatment Market: Company Share Analysis, 2020 (%)

Figure 13 GlaxoSmithKline plc: Key Financials

Figure 14 GlaxoSmithKline plc: Segmental Revenue

Figure 15 GlaxoSmithKline plc: Geographical Revenue

Figure 16 Glenmark Generics Ltd: Key Financials

Figure 17 Glenmark Generics Ltd: Segmental Revenue

Figure 18 Glenmark Generics Ltd: Geographical Revenue

Figure 19 Teva Pharmaceutical Industries Ltd: Key Financials

Figure 20 Teva Pharmaceutical Industries Ltd: Segmental Revenue

Figure 21 Teva Pharmaceutical Industries Ltd: Geographical Revenue

Figure 22 Eli Lilly Company: Key Financials

Figure 23 Eli Lilly Company: Segmental Revenue

Figure 24 Eli Lilly Company: Geographical Revenue

Figure 25 Jonakayem Pharma Formulation Pvt. Ltd: Key Financials

Figure 26 Jonakayem Pharma Formulation Pvt. Ltd: Segmental Revenue

Figure 27 Jonakayem Pharma Formulation Pvt. Ltd: Geographical Revenue

Figure 28 Fougera Pharmaceuticals Inc.: Key Financials

Figure 29 Fougera Pharmaceuticals Inc.: Segmental Revenue

Figure 30 Fougera Pharmaceuticals Inc.: Geographical Revenue

Figure 31 Taro Pharmaceutical Industries Ltd.: Key Financials

Figure 32 Taro Pharmaceutical Industries Ltd.: Segmental Revenue

Figure 33 Taro Pharmaceutical Industries Ltd.: Geographical Revenue

Purchase Option
Single User $ 4,950
Multiuser License $ 5,950
Enterprise User $ 7,250
Compare Licenses
Tailored for You
  • Dedicated Research on any specifics segment or region.
  • Focused Research on specific players in the market.
  • Custom Report based only on your requirements.
  • Flexibility to add or subtract any chapter in the study.
  • Historic data from 2014 and forecasts outlook till 2040.
  • Flexibility of providing data/insights in formats (PDF, PPT, Excel).
  • Provide cross segmentation in applicable scenario/markets.