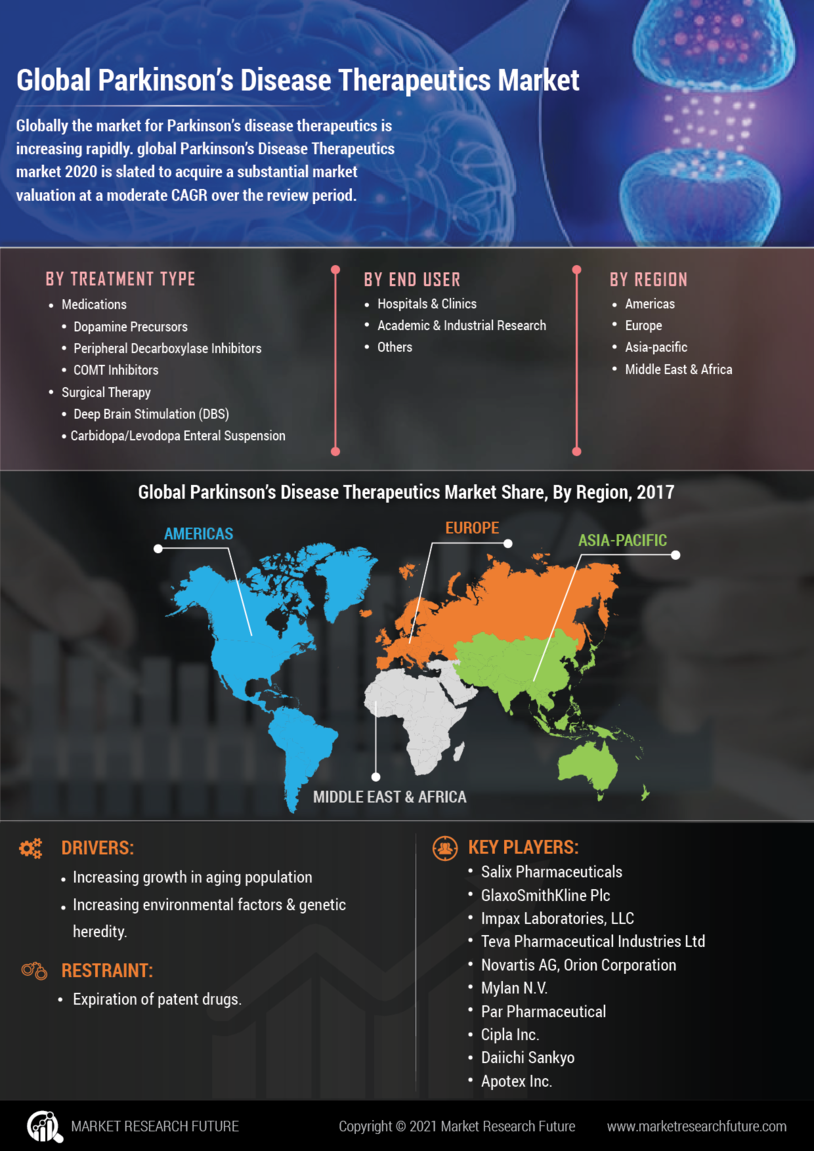
Parkinson’s Disease Therapeutics Market Research Report- Forecast to 2030

Parkinson’s Disease Therapeutics Market Research Report Information By Treatment Type (Medication, Surgical Therapy, Carbidopa/Levodopa Enteral Suspension), By End-User (Hospitals & Clinics, Academic & Industrial Research), And By Region (North America, Europe, Asia-Pacific, And Rest Of The World) – Market Forecast Till 2030

ID: MRFR/Pharma/1043-HCR | 90 Pages | Author: Rahul Gotadki | March 2024         

TABLE OF CONTENT

Chapter 1. Report Prologue

Chapter 2. Market Introduction

2.1 Definition

2.2 Scope of the Study

2.2.1 Research Objective

2.2.2 Assumptions

2.2.3 Limitations

Chapter 3. Research Methodology

3.1 Introduction

3.2 Primary Research

3.3 Secondary Research

3.4 Market Size Estimation

Chapter 4. Market Dynamics

4.1 Drivers

4.2 Restraints

4.3 Opportunities

4.4 Challenges

4.5 Macroeconomic Indicators

4.6 Technology Trends & Assessment

Chapter 5. Market Factor Analysis

5.1 Porter’s Five Forces Analysis

5.1.1 Bargaining Power of Suppliers

5.1.2 Bargaining Power of Buyers

5.1.3 Threat of New Entrants

5.1.4 Threat of Substitutes

5.1.5 Intensity of Rivalry

5.2 Value Chain Analysis

5.3 Investment Feasibility Analysis

5.4 Pricing Analysis

Chapter 6. Global Parkinson’s disease Therapeutics Market, by Treatment Type

6.1 Introduction

6.2 Medications

6.2.1 Dopamine Precursors

6.2.2 Peripheral Decarboxylase Inhibitors

6.2.3 COMT Inhibitors

6.2.4 MAO Inhibitors

6.2.5 Others

6.3 Surgical Therapy

6.3.1 Deep Brain Stimulation (DBS)

6.3.2 Carbidopa/Levodopa Enteral Suspension

Chapter 7. Global Parkinson’s disease Therapeutics Market, by End-User

7.1 Introduction

7.2 Hospitals & Clinics

7.3 Academic & Industrial Research

7.4 Others

Chapter 8. Global Parkinson’s disease Therapeutics Market, by Region

8.1 Introduction

8.2 America

8.2.1 North America

8.2.1.1 U.S.

8.2.1.2 Canada

8.2.2 South America

8.3 Europe

8.3.1 Western Europe

8.3.1.1 Germany

8.3.1.2 France

8.3.1.3 Italy

8.3.1.4 Spain

8.3.1.5 U.K.

8.3.1.6 Rest of Western Europe

8.3.2 Eastern Europe

8.4 Asia Pacific

8.4.1 Japan

8.4.2 China

8.4.3 India

8.4.4 Australia

8.4.5 Republic of Korea

8.4.6 Rest of Asia Pacific

8.5 The Middle East & Africa

8.5.1 United Arab Emirates

8.5.2 Saudi Arabia

8.5.3 Oman

8.5.4 Kuwait

8.5.5 Qatar

8.5.6 Rest of the Middle East & Africa

Chapter 9. Company Landscape

9.1 Introduction

9.2 Market Share Analysis

9.3 Key Development & Strategies

9.3.1 Key Developments

Chapter 10 Company Profiles

10.1 Salix Pharmaceuticals

10.1.1 Company Overview

10.1.2 Type Overview

10.1.3 Financials

10.2.4 Key Developments

10.1.5 SWOT Analysis

10.2 GlaxoSmithKline Plc

10.2.1 Company Overview

10.2.2 Type Overview

10.2.3 Financial Overview

10.2.4 Key Developments

10.2.5 SWOT Analysis

10.3 Impax Laboratories, LLC

10.3.1 Company Overview

10.3.2 Type Overview

10.3.3 Financial Overview

10.3.4 Key Development

10.3.5 SWOT Analysis

10.4 Teva Pharmaceutical Industries Ltd

10.4.1 Company Overview

10.4.2 Type/Business Segment Overview

10.4.3 Financial Overview

10.4.4 Key Development

10.4.5 SWOT Analysis

10.5 Novartis AG

10.5.1 Company Overview

10.5.2 Type Overview

10.5.3 Financial overview

10.5.4 Key Developments

10.5.5 SWOT Analysis

10.6 Orion Corporation

10.6.1 Company Overview

10.6.2 Type Overview

10.6.3 Financial Overview

10.6.4 Key Developments

10.6.5 SWOT Analysis

10.7 Mylan N.V.

10.7.1 Overview

10.7.2 Type Overview

10.7.3 Financials

10.7.4 Key Developments

10.7.5 SWOT Analysis

10.8 Par Pharmaceutical

10.8.1 Overview

10.8.2 Type Overview

10.8.3 Financials

10.8.4 Key Developments

10.8.5 SWOT Analysis

10.9 Cipla Inc.

10.9.1 Overview

10.9.2 Type Overview

10.9.3 Financials

10.9.4 Key Developments

10.9.5 SWOT Analysis

10.10 Daiichi Sankyo

10.10.1 Overview

10.10.2 Type Overview

10.10.3 Financials

10.10.4 Key Developments

10.10.5 SWOT Analysis

10.11 Apotex Inc.

10.11.1 Overview

10.11.2 Type Overview

10.11.3 Financials

10.11.4 Key Developments

10.11.5 SWOT Analysis

10.12 Wockhardt Limited

10.12.1 Overview

10.12.2 Type Overview

10.12.3 Financials

10.12.4 Key Developments

10.12.5 SWOT Analysis

10.13 ACADIA Pharmaceuticals Inc

10.13.1 Overview

10.13.2 Type Overview

10.13.3 Financials

10.13.4 Key Developments

10.13.5 SWOT Analysis

10.14 Abbott

10.14.1 Overview

10.14.2 Type Overview

10.14.3 Financials

10.14.4 Key Developments

10.14.5 SWOT Analysis

10.15 Others

Chapter 11 Appendix

LIST OF TABLES

Table 1 Global Parkinson’s disease Therapeutics Market Industry Synopsis, 2023-2030

Table 2 Global Parkinson’s disease Therapeutics Market Estimates & Forecast, 2023-2030, (USD Million)

Table 3 Global Parkinson’s disease Therapeutics Market, by Region, 2023-2030, (USD Million)

Table 4 Global Parkinson’s disease Therapeutics Market, by Treatment Type, 2023-2030, (USD Million)

Table 6 Global Parkinson’s disease Therapeutics Market, by End-User, 2023-2030, (USD Million)

Table 7 North America Parkinson’s disease Therapeutics Market, by Treatment Type, 2023-2030, (USD Million)

Table 9 North America Parkinson’s disease Therapeutics Market, by End-User, 2023-2030, (USD Million)

Table 10 U.S. Parkinson’s disease Therapeutics Market, by Treatment Type, 2023-2030, (USD Million)

Table 11 U.S. Parkinson’s disease Therapeutics Market, by End-User, 2023-2030, (USD Million)

Table 12 Canada Parkinson’s disease Therapeutics Market, by Treatment Type, 2023-2030, (USD Million)

Table 13 Canada Parkinson’s disease Therapeutics Market, by End-User, 2023-2030, (USD Million)

Table 14 South America Parkinson’s disease Therapeutics Market, by Treatment Type, 2023-2030, (USD Million)

Table 15 South America Parkinson’s disease Therapeutics Market, by End-User, 2023-2030, (USD Million)

Table 16 Europe Parkinson’s disease Therapeutics Market, by Treatment Type, 2023-2030, (USD Million)

Table 17 Europe Parkinson’s disease Therapeutics Market, by End-User, 2023-2030, (USD Million)

Table 18 Western Europe Parkinson’s disease Therapeutics Market, by Treatment Type, 2023-2030, (USD Million)

Table 19 Western Europe Parkinson’s disease Therapeutics Market, by End-User, 2023-2030, (USD Million)

Table 20 Eastern Europe Parkinson’s disease Therapeutics Market, by Treatment Type, 2023-2030, (USD Million)

Table 21 Eastern Europe Parkinson’s disease Therapeutics Market, by End-User, 2023-2030, (USD Million)

Table 22 Asia Pacific Parkinson’s disease Therapeutics Market, by Treatment Type, 2023-2030, (USD Million)

Table 23 Asia Pacific Parkinson’s disease Therapeutics Market, by End-User, 2023-2030, (USD Million)

Table 24 The Middle East & Africa Parkinson’s disease Therapeutics Market, by Treatment Type, 2023-2030, (USD Million)

Table 25 The Middle East & Africa Parkinson’s disease Therapeutics Market, by End-User, 2023-2030, (USD Million)

LIST OF FIGURES

Figure 1 Research Process

Figure 2 Segmentation for Global Parkinson’s disease Therapeutics Market

Figure 3 Market Dynamics for Global Parkinson’s disease Therapeutics Market

Figure 4 Global Parkinson’s disease Therapeutics Market Share, by Treatment Type, 2023

Figure 5 Global Parkinson’s disease Therapeutics Market Share, by End-User, 2023

Figure 6 Global Parkinson’s disease Therapeutics Market Share, by Region, 2023

Figure 7 North America Parkinson’s disease Therapeutics Market Share, by Country, 2023

Figure 8 Europe Parkinson’s disease Therapeutics Share, by Country, 2023

Figure 9 Asia Pacific Parkinson’s disease Therapeutics Market Share, by Country, 2023

Figure 10 The Middle East & Africa Parkinson’s disease Therapeutics Market Share, by Country, 2023

Figure 11 Global Parkinson’s disease Therapeutics Market: Company Share Analysis, 2023 (%)

Figure 12 Abbott: Key Financials

Figure 13 Abbott: Segmental Revenue

Figure 14 Abbott: Geographical Revenue

Figure 15 Salix Pharmaceuticals: Key Financials

Figure 16 Salix Pharmaceuticals: Segmental Revenue

Figure 17 Salix Pharmaceuticals: Geographical Revenue

Figure 18 GlaxoSmithKline Plc: Key Financials

Figure 19 GlaxoSmithKline Plc: Segmental Revenue

Figure 20 GlaxoSmithKline Plc: Geographical Revenue

Figure 21 Impax Laboratories, LLC: Key Financials

Figure 22 Impax Laboratories, LLC: Segmental Revenue

Figure 23 Impax Laboratories, LLC: Geographical Revenue

Figure 24 Teva Pharmaceutical Industries Ltd: Key Financials

Figure 25 Teva Pharmaceutical Industries Ltd: Segmental Revenue

Figure 26 Teva Pharmaceutical Industries Ltd: Geographical Revenue

Figure 27 Novartis AG: Key Financials

Figure 28 Novartis AG: Segmental Revenue

Figure 29 Novartis AG: Geographical Revenue

Figure 30 Orion Corporation: Key Financials

Figure 31 Orion Corporation: Segmental Revenue

Figure 32 Orion Corporation: Geographical Revenue

Figure 33 Mylan N.V.: Key Financials

Figure 34 Mylan N.V.: Segmental Revenue

Figure 35 Mylan N.V.: Geographical Revenue

Figure 36 Par Pharmaceutical: Key Financials

Figure 37 Par Pharmaceutical: Segmental Revenue

Figure 38 Par Pharmaceutical: Geographical Revenue

Figure 39 Cipla Inc.: Key Financials

Figure 40 Cipla Inc.: Segmental Revenue

Figure 41 Cipla Inc.: Geographical Revenue

Figure 42 Daiichi Sankyo: Key Financials

Figure 43 Daiichi Sankyo: Segmental Revenue

Figure 44 Daiichi Sankyo: Geographical Revenue

Figure 45 Apotex Inc.: Key Financials

Figure 46 Apotex Inc.: Segmental Revenue

Figure 47 Apotex Inc.: Geographical Revenue

Leading companies partner with us for data-driven Insights.
Report List icon Report List icon Report List icon Report List icon Report List icon Report List icon Report List icon Report List icon Report List icon Report List icon Report List icon

Kindly complete the form below to receive a free sample of this Report

Please fill in Business Email for Quick Response
Invalid