Paper Packaging Market Segmentation
Paper Packaging Market By Application (USD Billion, 2025-2035)
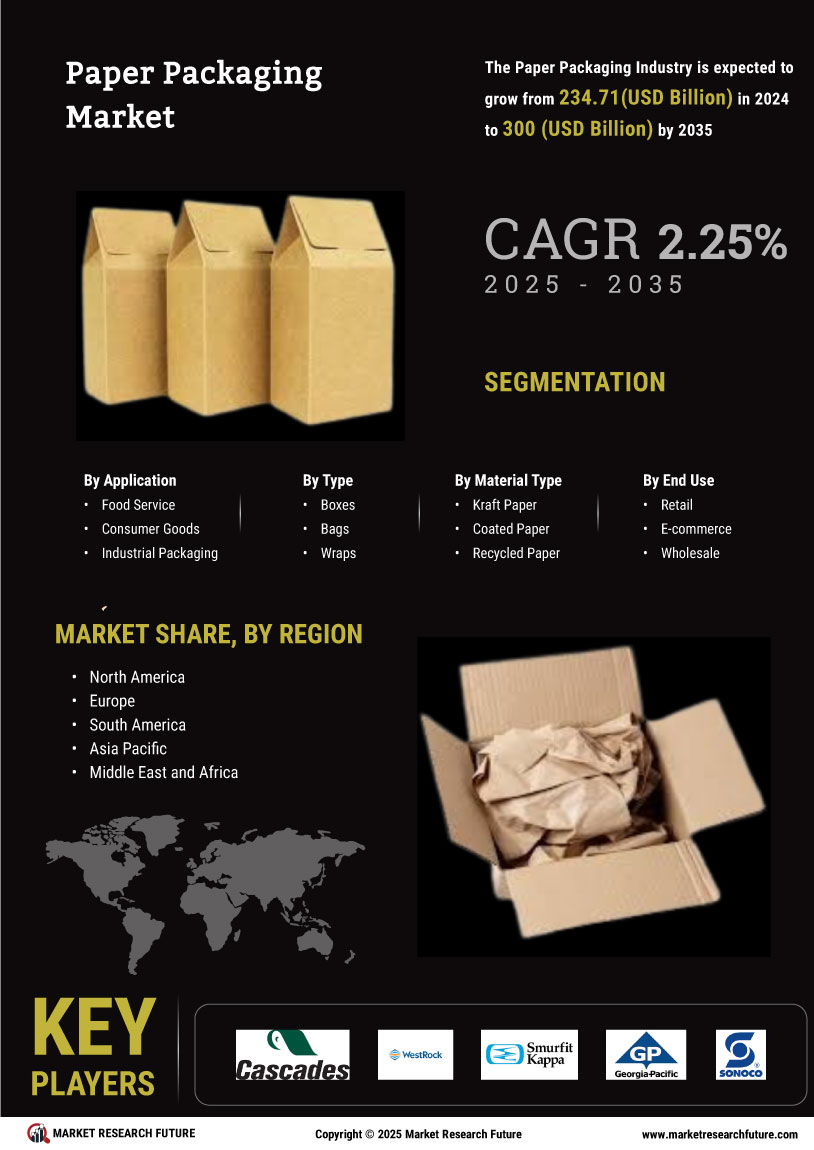
- Food Packaging
- Beverage Packaging
- Consumer Goods Packaging
- Pharmaceutical Packaging
- Industrial Packaging
Paper Packaging Market By Material Type (USD Billion, 2025-2035)
- Kraft Paper
- Coated Paper
- Recycled Paper
- Corrugated Paper
- Paperboard
Paper Packaging Market By End Use (USD Billion, 2025-2035)
- Retail
- E-commerce
- Food Service
- Healthcare
- Personal Care
Paper Packaging Market By Printing Technology (USD Billion, 2025-2035)
- Flexographic Printing
- Digital Printing
- Lithographic Printing
- Gravure Printing
- Screen Printing
Paper Packaging Market By Product Type (USD Billion, 2025-2035)
- Boxes
- Bags
- Wraps
- Labels
- Cartons