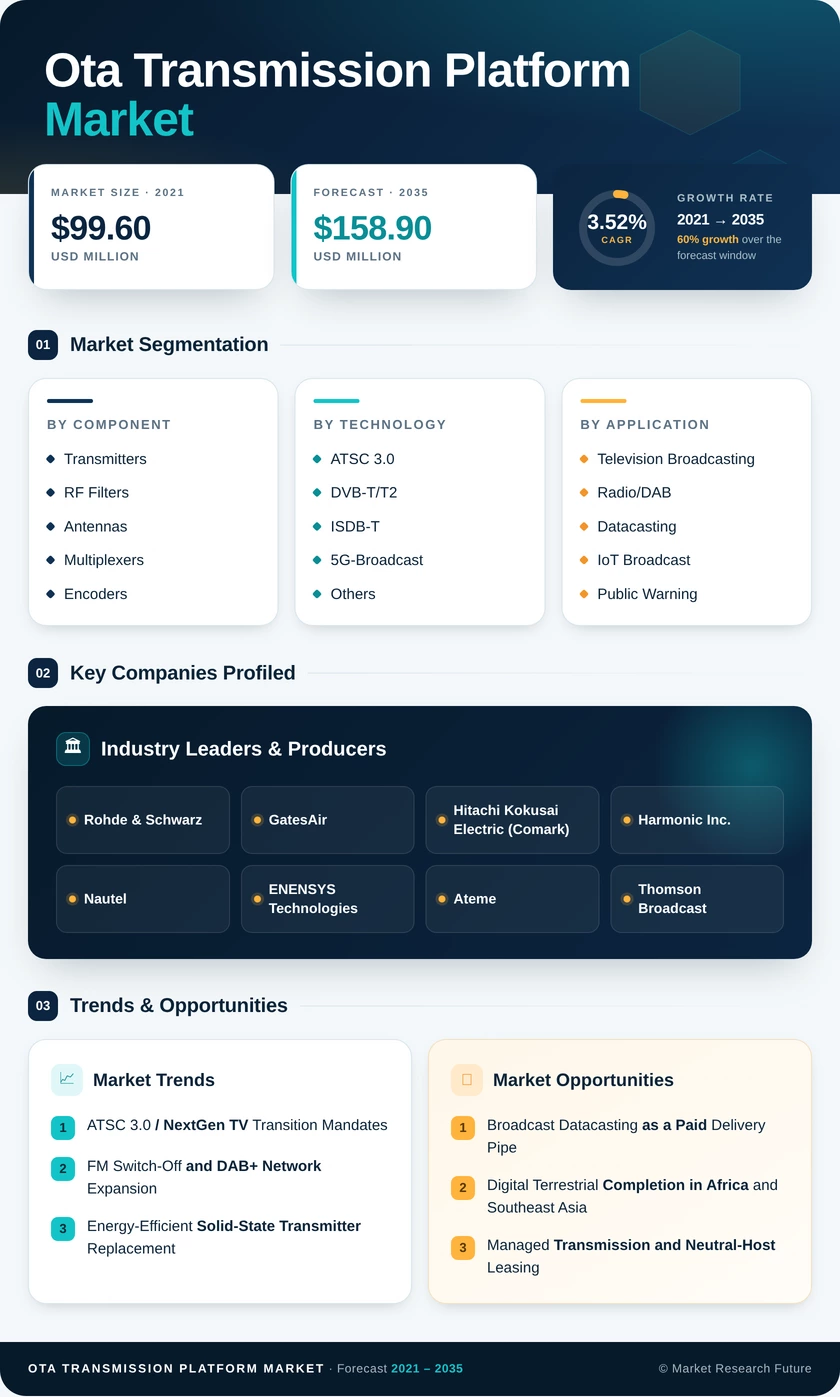
Ota Transmission Platform Market (2026 - 2035)

ID: MRFR/ICT/29493-HCR 128 Pages Nirmit Biswas Last Updated: November 13, 2026
OTA Transmission Platform Market Research Report By Deployment Type (Cloud-based, On-premises, Hybrid), By Application (Automotive, Industrial, Consumer Electronics, Healthcare), By Protocol (OTA 1.0, OTA 2.0, OTA 3.0), By Connectivity Technology (Cellular (4G/5G), Wi-Fi, Bluetooth) and By Regional (North America, Europe, South America, Asia Pacific, Middle East and Africa) - Forecast to 2035
Ota Transmission Platform Market
Market Size
Forecast Period2026-2035
CAGR (2026-2035)3.52%
2025 Market SizeUSD 112.4 Million
2035 Market SizeUSD 158.9 Million
Key Players
Rohde & Schwarz
GatesAir
Hitachi Kokusai Electric
Harmonic Inc.
Nautel
ENENSYS Technologies
Opportunities
  • Broadcast Datacasting as a Paid Delivery Pipe
  • Digital Terrestrial Completion in Africa and Southeast Asia
  • Managed Transmission and Neutral-Host Leasing
  1. 1 Market Summary | |
  2. 2 Key Report Takeaways | |
    1. 2.1 By Component | |
    2. 2.2 By Technology | |
    3. 2.3 By Application | |
    4. 2.4 By End-User | |
    5. 2.5 By Region | |
  3. 3 Market Size and Forecast (2021–2035) | |
  4. 4 Driver Impact Analysis | |
    1. 4.1 ATSC
    2. 3.0 / NextGen TV Transition Mandates | |
    3. 4.2 FM Switch-Off and DAB+ Network Expansion | |
    4. 4.3 Energy-Efficient Solid-State Transmitter Replacement | |
    5. 4.4 5G-Broadcast and Direct-to-Mobile Rollout | |
    6. 4.5 Public Warning and Emergency Alerting Obligations | |
    7. 4.6 Centralized Remote Monitoring and IP-Native Networks | |
    8. 4.7 Digital Terrestrial Completion in Emerging Markets | |
  5. 5 Restraints Impact Analysis | |
    1. 5.1 Linear Viewing Migration to Streaming | |
    2. 5.2 High Replacement Capex and Constrained Broadcaster Budgets | |
    3. 5.3 UHF Spectrum Pressure from Mobile Services | |
    4. 5.4 Limited ATSC
    5. 3.0 Receiver Penetration and Content-Protection Disputes | |
    6. 5.5 Component Supply Volatility and Trade Tariffs | |
  6. 6 Opportunities | |
    1. 6.1 Broadcast Datacasting as a Paid Delivery Pipe | |
    2. 6.2 Digital Terrestrial Completion in Africa and Southeast Asia | |
    3. 6.3 Managed Transmission and Neutral-Host Leasing | |
    4. 6.4 Direct-to-Mobile Broadcasting in India | |
    5. 6.5 Secure Broadcast and Positioning for Government Users | |
  7. 7 Regional Market Share and Country-Level Analysis | |
    1. 7.1 North America | | |
      1. 7.1.1 US | | |
      2. 7.1.2 Canada | | |
      3. 7.1.3 Mexico | |
    2. 7.2 Europe | | |
      1. 7.2.1 Germany | | |
      2. 7.2.2 UK | | |
      3. 7.2.3 France | | |
      4. 7.2.4 Italy | | |
      5. 7.2.5 Spain | | |
      6. 7.2.6 Nordic Countries | | |
      7. 7.2.7 Russia | | |
      8. 7.2.8 Rest of Europe | |
    3. 7.3 Asia-Pacific | | |
      1. 7.3.1 China | | |
      2. 7.3.2 India | | |
      3. 7.3.3 Japan | | |
      4. 7.3.4 South Korea | | |
      5. 7.3.5 ASEAN | | |
      6. 7.3.6 Rest of Asia-Pacific | |
    4. 7.4 South America | | |
      1. 7.4.1 Brazil | | |
      2. 7.4.2 Argentina | | |
      3. 7.4.3 Rest of South America | |
    5. 7.5 Middle East & Africa | | |
      1. 7.5.1 Saudi Arabia | | |
      2. 7.5.2 UAE | | |
      3. 7.5.3 South Africa | | |
      4. 7.5.4 Egypt | | |
      5. 7.5.5 Rest of MEA | |
  8. 8 Future Outlook (2026–2035) | |
    1. 8.1 AI-Driven Autonomous Network Operations | |
    2. 8.2 Software-Defined and Cloud-Native Headends | |
    3. 8.3 Energy Efficiency and Sustainability Reporting | |
    4. 8.4 Broadcast-Broadband Convergence and Positioning | |
  9. 9 Segmentation Analysis | |
    1. 9.1 By Component | | |
      1. 9.1.1 Transmitters | | |
      2. 9.1.2 RF Filters and Antennas | | |
      3. 9.1.3 Multiplexers and Encoders | | |
      4. 9.1.4 Monitoring and Control Systems | | |
      5. 9.1.5 Ancillary Infrastructure | |
    2. 9.2 By Technology | | |
      1. 9.2.1 ATSC
    3. 3.0 | | |
      1. 9.2.2 DVB-T/T2 | | |
      2. 9.2.3 ISDB-T | | |
      3. 9.2.4 5G-Broadcast | | |
      4. 9.2.5 Others | |
    4. 9.3 By Application | | |
      1. 9.3.1 Television Broadcasting | | |
      2. 9.3.2 Radio/DAB | | |
      3. 9.3.3 Datacasting and IoT Broadcast | | |
      4. 9.3.4 Public Warning and Emergency Alerting | |
    5. 9.4 By End-User | | |
      1. 9.4.1 Commercial Broadcasters and MSOs | | |
      2. 9.4.2 Public Service Broadcasters | | |
      3. 9.4.3 Government and Defense | | |
      4. 9.4.4 Tower Companies and Neutral Hosts | |
  10. 10 Competitive Landscape | |
  11. 11 Recent News & Developments | |
  12. 12 Report Scope and Methodology | |
  13. 13 Detailed Sources and Citations | |
  14. 14 Frequently Asked Questions (FAQs) | | LIST OF TABLES | |
  15. TABLE 1 Report Snapshot — Market Size, CAGR, and Regional Leadership | |
  16. TABLE 2 Global Market Size and Forecast, by Revenue (USD Million), 2021–2035 | |
  17. TABLE 3 Driver Impact Analysis on Forecast CAGR | |
  18. TABLE 4 Restraints Impact Analysis on Forecast CAGR | |
  19. TABLE 5 Regional Summary, 2025 | |
  20. TABLE 6 North America Country-Level Analysis, 2025 | |
  21. TABLE 7 Europe Country-Level Analysis, 2025 | |
  22. TABLE 8 Asia-Pacific Country-Level Analysis, 2025 | |
  23. TABLE 9 South America Country-Level Analysis, 2025 | |
  24. TABLE 10 Middle East & Africa Country-Level Analysis, 2025 | |
  25. TABLE 11 Market Segmentation, by Component, 2025 | |
  26. TABLE 12 Market Segmentation, by Technology, 2025 | |
  27. TABLE 13 Market Segmentation, by Application, 2025 | |
  28. TABLE 14 Market Segmentation, by End-User, 2025 | |
  29. TABLE 15 Competitive Benchmarking Matrix | |
  30. TABLE 16 Report Scope and Methodology | |
  31. TABLE 17 Detailed Sources and Citations | |
  32. TABLE 18 Segmentation Quick Reference | | LIST OF FIGURES | |
  33. FIGURE 1 Market Dynamics Overview — Drivers, Restraints, and Opportunities | |
  34. FIGURE 2 Industry Value Chain Analysis | |
  35. FIGURE 3 Porter's Five Forces Analysis | |
  36. FIGURE 4 Global Market Size Trend, 2021–2035 (USD Million) | |
  37. FIGURE 5 Market Share, by Component, 2025 | |
  38. FIGURE 6 Market Share, by Technology, 2025 | |
  39. FIGURE 7 Market Share, by Application, 2025 | |
  40. FIGURE 8 Market Share, by End-User, 2025 | |
  41. FIGURE 9 Regional Market Share, 2025 | |
  42. FIGURE 10 Country-Level Growth Comparison, 2026–2035 | |
  43. FIGURE 11 Competitive Landscape — Vendor Positioning Matrix | |
  44. FIGURE 12 Estimated Revenue Share Ranges of Leading Players

Segmentation Quick Reference

DimensionSub-SegmentsDominant SegmentFastest Growing Segment
By ComponentTransmitters; RF Filters and Antennas; Multiplexers and Encoders; Monitoring and Control Systems; Ancillary InfrastructureTransmitters (43.6% share)Monitoring and Control Systems (4.9% CAGR)
By TechnologyATSC 3.0; DVB-T/T2; ISDB-T; 5G-Broadcast; OthersATSC 3.0 (31.9% share)5G-Broadcast (6.2% CAGR)
By ApplicationTelevision Broadcasting; Radio/DAB; Datacasting and IoT Broadcast; Public Warning and Emergency AlertingTelevision Broadcasting (54.8% share)Radio/DAB (4.7% CAGR)
By End-UserCommercial Broadcasters and MSOs; Public Service Broadcasters; Government and Defense; Tower Companies and Neutral HostsCommercial Broadcasters and MSOs (52.9% share)Government and Defense (6.7% CAGR)
By RegionNorth America; Europe; Asia-Pacific; South America; Middle East & AfricaNorth America (35.8% share)Asia-Pacific (4.8% CAGR)


Market Segmentation Overview

By Component

Sub-SegmentKey Trend
TransmittersShift to liquid-cooled solid-state designs with software-licensed waveforms.
RF Filters and AntennasRefresh tied to transmitter replacement and ATSC 3.0 mask requirements.
Multiplexers and EncodersHEVC/VVC compression enabling UHD within existing spectrum
Monitoring and Control SystemsPredictive analytics and centralized fleet management
Ancillary InfrastructureSite hardening and backup power for alerting resilience


Transmitters lead the component mix because every standards change or power increase requires a new exciter and amplifier chain, and high-power sites are where efficiency savings are largest. Monitoring and Control Systems grow fastest, since broadcasters managing unattended fleets want remote diagnostics that cut site visits. RF Filters and Antennas track transmitter refresh closely rather than following an independent cycle.

By Technology

Sub-SegmentKey Trend
ATSC 3.0U.S. sunset petition and Brazil TV 3.0 adoption
DVB-T/T2Completion of European and African DTT networks
ISDB-TReplacement of Japan's 2011-era installed base
5G-BroadcastDirect-to-mobile trials in Europe and India
OthersDTMB upgrades in China and ATSC 1.0 maintenance


ATSC 3.0 holds the largest share because U.S. conversions and Brazil's TV 3.0 decree create concentrated, regulation-driven demand. 5G-Broadcast grows fastest as broadcasters and telecom operators test delivery to phones without SIM cards. DVB-T/T2 remains the volume standard across Europe and Africa, favouring vendors with multi-standard exciters.

By Application

Sub-SegmentKey Trend
Television BroadcastingUHD services and higher-order modulation
Radio/DABFM switch-offs and in-car digital tuner mandates
Datacasting and IoT BroadcastStations selling one-to-many data capacity.
Public Warning and Emergency AlertingGovernment-funded alerting obligations


Television Broadcasting dominates because free-to-air audiences and must-carry rules keep stations investing in transmission quality. Radio/DAB grows fastest on the EECC in-car receiver mandate and national FM switch-offs. Datacasting and IoT Broadcast remain small but give stations a revenue stream independent of advertising.

By End-User

Sub-SegmentKey Trend
Commercial Broadcasters and MSOsGroup-wide upgrade contracts and channel sharing
Public Service BroadcastersCoverage mandates balanced against tight budgets
Government and DefenseCyber-hardened, certified transmission for alerting and command
Tower Companies and Neutral HostsManaged transmission sold as a leasing service


Commercial Broadcasters and MSOs lead because group owners negotiate fleet-wide conversions and can finance them off balance sheet. Government and Defense grows fastest, driven by secure alerting needs and the prospect of broadcast-based positioning. Tower Companies and Neutral Hosts are gaining ground by converting station capital outlays into predictable leasing fees.


Download PDF ×

We do not share your information with anyone. However, we may send you emails based on your report interest from time to time. You may contact us at any time to opt-out.