Certified Global Research Member
Isomar fd.webp Wcrc 57.webp
Key Questions Answered
  • Global Market Outlook
  • In-depth analysis of global and regional trends
  • Analyze and identify the major players in the market, their market share, key developments, etc.
  • To understand the capability of the major players based on products offered, financials, and strategies.
  • Identify disrupting products, companies, and trends.
  • To identify opportunities in the market.
  • Analyze the key challenges in the market.
  • Analyze the regional penetration of players, products, and services in the market.
  • Comparison of major playersโ€™ financial performance.
  • Evaluate strategies adopted by major players.
  • Recommendations
Why Choose Market Research Future?
  • Vigorous research methodologies for specific market.
  • Knowledge partners across the globe
  • Large network of partner consultants.
  • Ever-increasing/ Escalating data base with quarterly monitoring of various markets
  • Trusted by fortune 500 companies/startups/ universities/organizations
  • Large database of 5000+ markets reports.
  • Effective and prompt pre- and post-sales support.

Organic Food Additives Market Research Report Information by Form (Dry and Liquid), Type (Acidulants, Vitamins & Minerals, Colorants, Hydrocolloids, Enzymes, Flavors & Sweeteners and others), Application (Bakery & Confectionery, Beverages, Dairy & Frozen Dessert, Sweet & Savory Snacks, Soups, Sauces & Dressings and others) and Region (North America, Europe, Asia-Pacific and Rest of the World) - Forecast till 2030


ID: MRFR/F-B & N/2687-HCR | 90 Pages | Author: Tejas Chaudhary| April 2024
Leading companies partner with us for data-driven Insights
client_1 client_2 client_3 client_4 client_5 client_6 client_7 client_8 client_9 client_10
Please fill in Business Email for Quick Response

Table of Contents

1. 1 EXECUTIVE SUMMARY

1.1. Market Attractiveness Analysis

1.1.1. Global Organic Food Additives, by Form

1.1.2. Global Organic Food Additives, Types

1.1.3. Global Organic Food Additives, by Application

1.1.4. Global Organic Food Additives, by Region

2. MARKET INTRODUCTION

2.1. Definition

2.2. Scope of the Study

2.3. Market Structure

2.4. Key Buying Criteria

2.5. Macro Factor Indicator Analysis

3. RESEARCH METHODOLOGY

3.1. Research Process

3.2. Primary Research

3.3. Secondary Research

3.4. Market Size Estimation

3.5. Forecast Model

3.6. List of Assumptions

4. MARKET DYNAMICS

4.1. Introduction

4.2. Drivers

4.2.1. Driver 1

4.2.2. Driver 2

4.3. Restraints

4.3.1. Restraint 1

4.3.2. Restraint 2

4.4. Opportunities

4.4.1. Opportunity 1

4.4.2. Opportunity 2

4.5. Challenges

4.5.1. Challenge 1

4.5.2. Challenge 2

5. MARKET FACTOR ANALYSIS

5.1. Value Chain Analysis

5.2. Supply Chain Analysis

5.3. Porterโ€™s Five Forces Model

5.3.1. Bargaining Power of Suppliers

5.3.2. Bargaining Power of Buyers

5.3.3. Threat of New Entrants

5.3.4. Threat of Substitutes

5.3.5. Intensity of Rivalry

6. GLOBAL ORGANIC FOOD ADDITIVES MARKET, BY FORM

6.1. Introduction

6.2. Dry

6.2.1. Dry: Market Estimates & Forecast, by Region/Country, 2022โ€“2030

6.3. Liquid

6.3.1. Liquid: Market Estimates & Forecast, by Region/Country, 2022โ€“2030

7. GLOBAL ORGANIC FOOD ADDITIVES MARKET, BY TYPES

7.1. Introduction

7.2. Acidulants

7.2.1. Acidulants: Market Estimates & Forecast, by Region/Country, 2022โ€“2030

7.3. Vitamins & Minerals

7.3.1. Vitamins & Minerals: Market Estimates & Forecast, by Region/Country, 2022โ€“2030

7.4. Colorants

7.4.1. Colorants: Market Estimates & Forecast, by Region/Country, 2022โ€“2030

7.5. Hydrocolloids

7.5.1. Hydrocolloids: Market Estimates & Forecast, by Region/Country, 2022โ€“2030

7.6. Enzymes

7.6.1. Enzymes: Market Estimates & Forecast, by Region/Country, 2022โ€“2030

7.7. Flavors & Sweeteners

7.7.1. Flavors & Sweetenesr: Market Estimates & Forecast, by Region/Country, 2022โ€“2030

7.8. Others

7.8.1. Others: Market Estimates & Forecast, by Region/Country, 2022โ€“2030

8. GLOBAL ORGANIC FOOD ADDITIVES MARKET, BY APPLICATION

8.1. Introduction

8.2. Bakery & Confectionary

8.2.1. Bakery & Confectionary: Market Estimates & Forecast, by Region/Country, 2022โ€“2030

8.3. Beverages

8.3.1. Beverages: Market Estimates & Forecast, by Region/Country, 2022โ€“2030

8.4. Dairy & Frozen Dessert

8.4.1. Dairy & Frozen Dessert: Market Estimates & Forecast, by Region/Country, 2022โ€“2030

8.5. Sweet & Savory Snacks

8.5.1. Sweet & Savory Snacks: Market Estimates & Forecast, by Region/Country, 2022โ€“2030

8.6. Soups, Sauces & Dressings

8.6.1. Soups, Sauces & Dressings: Market Estimates & Forecast, by Region/Country, 2022โ€“2030

8.7. Others

8.7.1. Others: Market Estimates & Forecast, by Region/Country, 2022โ€“2030

9. GLOBAL ORGANIC FOOD ADDITIVES MARKET, BY REGION

9.1. Introduction

9.2. North America

9.2.1. Market Estimates & Forecast, by Form, 2022โ€“2030

9.2.2. Market Estimates & Forecast, by Types, 2022โ€“2030

9.2.3. Market Estimates & Forecast, by Application, 2022โ€“2030

9.2.4. Market Estimates & Forecast, by Country, 2022โ€“2030

9.2.5. US

9.2.5.1. Market Estimates & Forecast, by Form, 2022โ€“2030

9.2.5.2. Market Estimates & Forecast, by Types, 2022โ€“2030

9.2.5.3. Market Estimates & Forecast, by Application, 2022โ€“2030

9.2.6. Canada

9.2.6.1. Market Estimates & Forecast, by Form, 2022โ€“2030

9.2.6.2. Market Estimates & Forecast, by Types, 2022โ€“2030

9.2.6.3. Market Estimates & Forecast, by Application, 2022โ€“2030

9.2.7. Mexico

9.2.7.1. Market Estimates & Forecast, by Form, 2022โ€“2030

9.2.7.2. Market Estimates & Forecast, by Types, 2022โ€“2030

9.2.7.3. Market Estimates & Forecast, by Application, 2022โ€“2030

9.3. Europe

9.3.1. Market Estimates & Forecast, by Form, 2022โ€“2030

9.3.2. Market Estimates & Forecast, by Types, 2022โ€“2030

9.3.3. Market Estimates & Forecast, by Application, 2022โ€“2030

9.3.4. Market Estimates & Forecast, by Country, 2022โ€“2030

9.3.5. Germany

9.3.5.1. Market Estimates & Forecast, by Form, 2022โ€“2030

9.3.5.2. Market Estimates & Forecast, by Types, 2022โ€“2030

9.3.5.3. Market Estimates & Forecast, by Application, 2022โ€“2030

9.3.6. UK

9.3.6.1. Market Estimates & Forecast, by Form, 2022โ€“2030

9.3.6.2. Market Estimates & Forecast, by Types, 2022โ€“2030

9.3.6.3. Market Estimates & Forecast, by Application, 2022โ€“2030

9.3.7. France

9.3.7.1. Market Estimates & Forecast, by Form, 2022โ€“2030

9.3.7.2. Market Estimates & Forecast, by Types, 2022โ€“2030

9.3.7.3. Market Estimates & Forecast, by Application, 2022โ€“2030

9.3.8. Spain

9.3.8.1. Market Estimates & Forecast, by Form, 2022โ€“2030

9.3.8.2. Market Estimates & Forecast, by Types, 2022โ€“2030

9.3.8.3. Market Estimates & Forecast, by Application, 2022โ€“2030

9.3.9. Italy

9.3.9.1. Market Estimates & Forecast, by Form, 2022โ€“2030

9.3.9.2. Market Estimates & Forecast, by Types, 2022โ€“2030

9.3.9.3. Market Estimates & Forecast, by Application, 2022โ€“2030

9.3.10. Rest of Europe

9.3.10.1. Market Estimates & Forecast, by Form, 2022โ€“2030

9.3.10.2. Market Estimates & Forecast, by Types, 2022โ€“2030

9.3.10.3. Market Estimates & Forecast, by Application, 2022โ€“2030

9.4. Asia-Pacific

9.4.1. Market Estimates & Forecast, by Form, 2022โ€“2030

9.4.2. Market Estimates & Forecast, by Types, 2022โ€“2030

9.4.3. Market Estimates & Forecast, by Application, 2022โ€“2030

9.4.4. Market Estimates & Forecast, by Country, 2022โ€“2030

9.4.5. China

9.4.5.1. Market Estimates & Forecast, by Form, 2022โ€“2030

9.4.5.2. Market Estimates & Forecast, by Types, 2022โ€“2030

9.4.5.3. Market Estimates & Forecast, by Application, 2022โ€“2030

9.4.6. Japan

9.4.6.1. Market Estimates & Forecast, by Form, 2022โ€“2030

9.4.6.2. Market Estimates & Forecast, by Types, 2022โ€“2030

9.4.6.3. Market Estimates & Forecast, by Application, 2022โ€“2030

9.4.7. India

9.4.7.1. Market Estimates & Forecast, by Form, 2022โ€“2030

9.4.7.2. Market Estimates & Forecast, by Types, 2022โ€“2030

9.4.7.3. Market Estimates & Forecast, by Application, 2022โ€“2030

9.4.8. Australia & New Zealand

9.4.8.1. Market Estimates & Forecast, by Form, 2022โ€“2030

9.4.8.2. Market Estimates & Forecast, by Types, 2022โ€“2030

9.4.8.3. Market Estimates & Forecast, by Application, 2022โ€“2030

9.4.9. Rest of Asia-Pacific

9.4.9.1. Market Estimates & Forecast, by Form, 2022โ€“2030

9.4.9.2. Market Estimates & Forecast, by Types, 2022โ€“2030

9.4.9.3. Market Estimates & Forecast, by Application, 2022โ€“2030

9.5. Rest of the World

9.5.1. Market Estimates & Forecast, by Form, 2022โ€“2030

9.5.2. Market Estimates & Forecast, by Types, 2022โ€“2030

9.5.3. Market Estimates & Forecast, by Application, 2022โ€“2030

9.5.4. Market Estimates & Forecast, by Region, 2022โ€“2030

9.5.5. South America

9.5.5.1. Market Estimates & Forecast, by Form, 2022โ€“2030

9.5.5.2. Market Estimates & Forecast, by Types, 2022โ€“2030

9.5.5.3. Market Estimates & Forecast, by Application, 2022โ€“2030

9.5.6. Middle East

9.5.6.1. Market Estimates & Forecast, by Form, 2022โ€“2030

9.5.6.2. Market Estimates & Forecast, by Types, 2022โ€“2030

9.5.6.3. Market Estimates & Forecast, by Application, 2022โ€“2030

9.5.7. Africa

9.5.7.1. Market Estimates & Forecast, by Form, 2022โ€“2030

9.5.7.2. Market Estimates & Forecast, by Types, 2022โ€“2030

9.5.7.3. Market Estimates & Forecast, by Application, 2022โ€“2030

10. COMPETITIVE LANDSCAPE

10.1. Introduction

10.2. Competitive Benchmarking

10.3. Development Share Analysis

10.4. Key Developments & Growth Strategies

11. COMPANY PROFILES

11.1. E.I. du Pont de Nemours and Company

11.1.1. Company Overview

11.1.2. Financial Overview

11.1.3. Products Offered

11.1.4. Key Developments

11.1.5. SWOT Analysis

11.1.6. Key Strategies

11.2. Archer Daniels Midland Company

11.2.1. Company Overview

11.2.2. Financial Overview

11.2.3. Products Offered

11.2.4. Key Developments

11.2.5. SWOT Analysis

11.2.6. Key Strategies

11.3. Cargill Inc.

11.3.1. Company Overview

11.3.2. Financial Overview

11.3.3. Products Offered

11.3.4. Key Developments

11.3.5. SWOT Analysis

11.3.6. Key Strategies

11.4. Chr. Hansen Holding A/S

11.4.1. Company Overview

11.4.2. Financial Overview

11.4.3. Products Offered

11.4.4. Key Developments

11.4.5. SWOT Analysis

11.4.6. Key Strategies

11.5. Kerry Group Plc

11.5.1. Company Overview

11.5.2. Financial Overview

11.5.3. Products Offered

11.5.4. Key Developments

11.5.5. SWOT Analysis

11.5.6. Key Strategies

11.6. BASF SE

11.6.1. Company Overview

11.6.2. Financial Overview

11.6.3. Products Offered

11.6.4. Key Developments

11.6.5. SWOT Analysis

11.6.6. Key Strategies

11.7. Novozymes A/S

11.7.1. Company Overview

11.7.2. Financial Overview

11.7.3. Products Offered

11.7.4. Key Developments

11.7.5. SWOT Analysis

11.7.6. Key Strategies

11.8. Tate & Lyle

11.8.1. Company Overview

11.8.2. Financial Overview

11.8.3. Products Offered

11.8.4. Key Developments

11.8.5. SWOT Analysis

11.8.6. Key Strategies

11.9. Danisco A/S

11.9.1. Company Overview

11.9.2. Financial Overview

11.9.3. Products Offered

11.9.4. Key Developments

11.9.5. SWOT Analysis

11.9.6. Key Strategies

11.10. Givaudan

11.10.1. Company Overview

11.10.2. Financial Overview

11.10.3. Products Offered

11.10.4. Key Developments

11.10.5. SWOT Analysis

11.10.6. Key Strategies

11.11. Brenntag AG

11.11.1. Company Overview

11.11.2. Financial Overview

11.11.3. Products Offered

11.11.4. Key Developments

11.11.5. SWOT Analysis

11.11.6. Key Strategies

11.12. Firmenich SA

11.12.1. Company Overview

11.12.2. Financial Overview

11.12.3. Products Offered

11.12.4. Key Developments

11.12.5. SWOT Analysis

11.12.6. Key Strategies

11.13. Associated British Foods plc

11.13.1. Company Overview

11.13.2. Financial Overview

11.13.3. Products Offered

11.13.4. Key Developments

11.13.5. SWOT Analysis

11.13.6. Key Strategies

11.14. International Flavors & Fragrances Inc.

11.14.1. Company Overview

11.14.2. Financial Overview

11.14.3. Products Offered

11.14.4. Key Developments

11.14.5. SWOT Analysis

11.14.6. Key Strategies

11.15. Foodchem International Corporation

11.15.1. Company Overview

11.15.2. Financial Overview

11.15.3. Products Offered

11.15.4. Key Developments

11.15.5. SWOT Analysis

11.15.6. Key Strategies

12. APPENDIX

12.1. General Forms & References

12.2. List of Abbreviation

LIST OF TABLES

Table 1 Global Organic Food Additives, by Region, 2022โ€“2030 (USD Million)

Table 3 Global Organic Food Additives, by Form,2022โ€“2030 (USD Million)

Table 4 Global Organic Food Additives, by Types, 2022โ€“2030 (USD Million)

Table 5 Global Organic Food Additives, by Application, 2022โ€“2030 (USD Million)

Table 6 North America: Organic Food Additives, by Country, 2022โ€“2030 (USD Million)

Table 8 North America: Organic Food Additives, by Form,2022โ€“2030 (USD Million)

Table 9 North America: Organic Food Additives, by Types, 2022โ€“2030 (USD Million)

Table 10 North America: Organic Food Additives, by Application, 2022โ€“2030 (USD Million)

Table 12 US: Organic Food Additives, by Form,2022โ€“2030 (USD Million)

Table 13 US: Organic Food Additives, by Types, 2022โ€“2030 (USD Million)

Table 14 US: Organic Food Additives, by Application, 2022โ€“2030 (USD Million)

Table 16 Canada: Organic Food Additives, by Form,2022โ€“2030 (USD Million)

Table 17 Canada: Organic Food Additives, by Types, 2022โ€“2030 (USD Million)

Table 18 Canada: Organic Food Additives, by Application, 2022โ€“2030 (USD Million)

Table 20 Mexico: Organic Food Additives, by Form,2022โ€“2030 (USD Million)

Table 21 Mexico: Organic Food Additives, by Types, 2022โ€“2030 (USD Million)

Table 22 Mexico: Organic Food Additives, by Application, 2022โ€“2030 (USD Million)

Table 23 Europe: Organic Food Additives, by Country, 2022โ€“2030 (USD Million)

Table 25 Europe: Organic Food Additives, by Form,2022โ€“2030 (USD Million)

Table 26 Europe: Organic Food Additives, by Types, 2022โ€“2030 (USD Million)

Table 27 Europe: Organic Food Additives, by Application, 2022โ€“2030 (USD Million)

Table 29 Germany: Organic Food Additives, by Form,2022โ€“2030 (USD Million)

Table 30 Germany: Organic Food Additives, by Types, 2022โ€“2030 (USD Million)

Table 31 Germany: Organic Food Additives, by Application, 2022โ€“2030 (USD Million)

Table 33 France: Organic Food Additives, by Form,2022โ€“2030 (USD Million)

Table 34 France: Organic Food Additives, by Types, 2022โ€“2030 (USD Million)

Table 35 France: Organic Food Additives, by Application, 2022โ€“2030 (USD Million)

Table 37 Italy: Organic Food Additives, by Form,2022โ€“2030 (USD Million)

Table 38 Italy: Organic Food Additives, by Types, 2022โ€“2030 (USD Million)

Table 39 Italy: Organic Food Additives, by Application, 2022โ€“2030 (USD Million)

Table 41 Spain: Organic Food Additives, by Form,2022โ€“2030 (USD Million)

Table 42 Spain: Organic Food Additives, by Types, 2022โ€“2030 (USD Million)

Table 43 Spain: Organic Food Additives, by Application, 2022โ€“2030 (USD Million)

Table 45 UK: Organic Food Additives, by Form,2022โ€“2030 (USD Million)

Table 46 UK: Organic Food Additives, by Types, 2022โ€“2030 (USD Million)

Table 47 UK: Organic Food Additives, by Application, 2022โ€“2030 (USD Million)

Table 49 Rest of Europe: Organic Food Additives, by Form,2022โ€“2030 (USD Million)

Table 50 Rest of Europe: Organic Food Additives, by Types, 2022โ€“2030 (USD Million)

Table 51 Rest of Europe: Organic Food Additives, by Application, 2022โ€“2030 (USD Million)

Table 52 Asia-Pacific: Organic Food Additives, by Country, 2022โ€“2030 (USD Million)

Table 54 Asia-Pacific: Organic Food Additives, by Form,2022โ€“2030 (USD Million)

Table 55 Asia-Pacific: Organic Food Additives, by Types, 2022โ€“2030 (USD Million)

Table 56 Asia-Pacific: Organic Food Additives, by Application, 2022โ€“2030 (USD Million)

Table 58 China: Organic Food Additives, by Form,2022โ€“2030 (USD Million)

Table 59 China: Organic Food Additives, by Types, 2022โ€“2030 (USD Million)

Table 60 China: Organic Food Additives, by Application, 2022โ€“2030 (USD Million)

Table 62 India: Organic Food Additives, by Form,2022โ€“2030 (USD Million)

Table 63 India: Organic Food Additives, by Types, 2022โ€“2030 (USD Million)

Table 64 India: Organic Food Additives, by Application, 2022โ€“2030 (USD Million)

Table 66 Japan: Organic Food Additives, by Form,2022โ€“2030 (USD Million)

Table 67 Japan: Organic Food Additives, by Types, 2022โ€“2030 (USD Million)

Table 68 Japan: Organic Food Additives, by Application, 2022โ€“2030 (USD Million)

Table 70 Australia & New Zealand: Organic Food Additives, by Form,2022โ€“2030 (USD Million)

Table 71 Australia & New Zealand: Organic Food Additives, by Types, 2022โ€“2030 (USD Million)

Table 72 Australia & New Zealand: Organic Food Additives, by Application, 2022โ€“2030 (USD Million)

Table 74 Rest of Asia-Pacific: Organic Food Additives, by Form,2022โ€“2030 (USD Million)

Table 75 Rest of Asia-Pacific: Organic Food Additives, by Types, 2022โ€“2030 (USD Million)

Table 76 Rest of Asia-Pacific: Organic Food Additives, by Application, 2022โ€“2030 (USD Million)

Table 77 Rest of the World (RoW): Organic Food Additives, by Country, 2022โ€“2030 (USD Million)

Table 79 Rest of the World (RoW): Organic Food Additives, by Form,2022โ€“2030 (USD Million)

Table 80 Rest of the World (RoW): Organic Food Additives, by Types, 2022โ€“2030 (USD Million)

Table 81 Rest of the World (RoW): Organic Food Additives, by Application, 2022โ€“2030 (USD Million)

Table 83 South America: Organic Food Additives, by Form,2022โ€“2030 (USD Million)

Table 84 South America: Organic Food Additives, by Types, 2022โ€“2030 (USD Million)

Table 85 South America: Organic Food Additives, by Application, 2022โ€“2030 (USD Million)

Table 87 Middle East: Organic Food Additives, by Form,2022โ€“2030 (USD Million)

Table 88 Middle East: Organic Food Additives, by Types, 2022โ€“2030 (USD Million)

Table 89 Middle East: Organic Food Additives, by Application, 2022โ€“2030 (USD Million)

Table 91 Africa: Organic Food Additives, by Form,2022โ€“2030 (USD Million)

Table 92 Africa: Organic Food Additives, by Types, 2022โ€“2030 (USD Million)

Table 93 Africa: Organic Food Additives, by Application, 2022โ€“2030 (USD Million)

LIST OF FIGURES

FIGURE 1 Global 
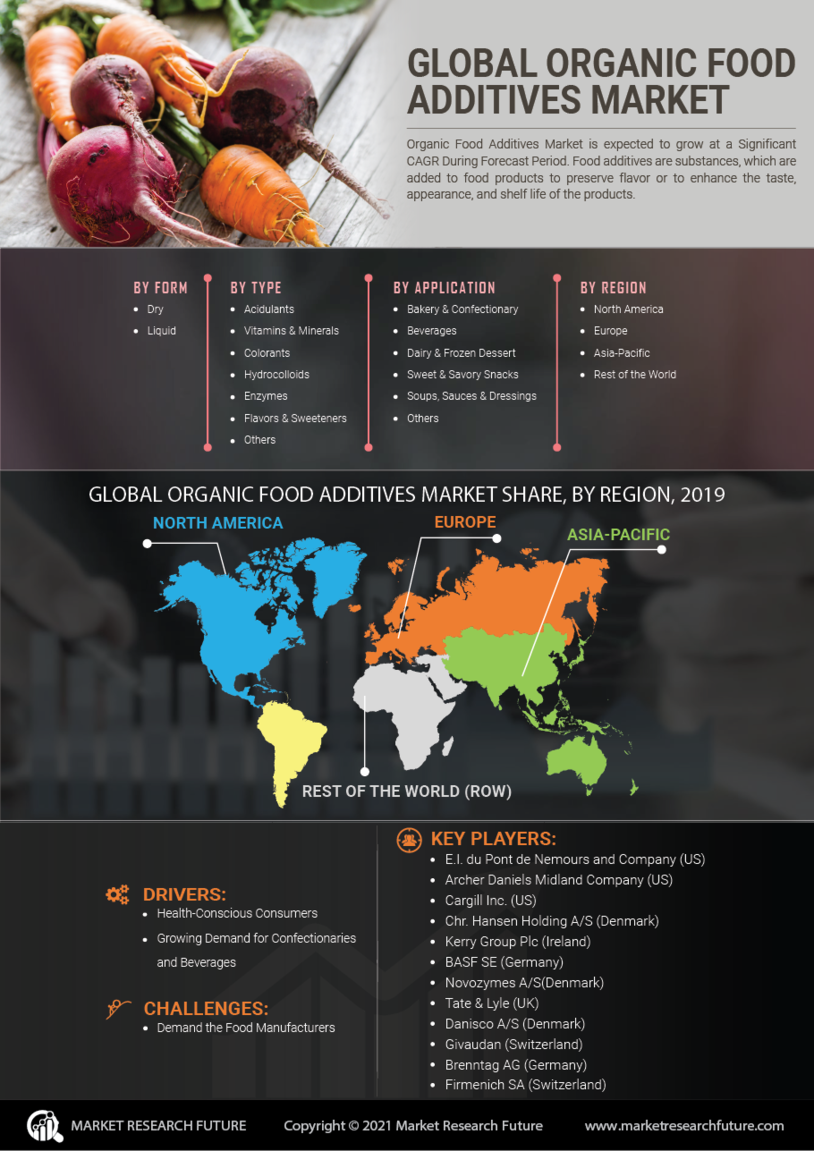
Organic Food Additives Market Segmentation

FIGURE 2 Forecast Research Methodology

FIGURE 3 Five Forces Analysis of the Global Organic Food Additives Market

FIGURE 4 Value Chain of the Global Organic Food Additives Market

FIGURE 5 Share of the Global Organic Food Additives Market in 2020, by Country (%)

FIGURE 6 Global Organic Food Additives Market, by Region, 2022โ€“2030,

FIGURE 7 Global Organic Food Additives Market Size, by Form, 2020

FIGURE 8 Share of the Global Organic Food Additives Market, by Form, 2022โ€“2030 (%)

FIGURE 9 Global Organic Food Additives Market Size, by Types, 2020

FIGURE 10 Share of the Global Organic Food Additives Market, by Types, 2022โ€“2030 (%)

FIGURE 11 Global Organic Food Additives Market Size, by Application, 2020

FIGURE 12 Share of the Global Organic Food Additives Market, by Application, 2022โ€“2030 (%)

Purchase Option
Single User $ 4,950
Multiuser License $ 5,950
Enterprise User $ 7,250
Compare Licenses
Tailored for You
  • Dedicated Research on any specifics segment or region.
  • Focused Research on specific players in the market.
  • Custom Report based only on your requirements.
  • Flexibility to add or subtract any chapter in the study.
  • Historic data from 2014 and forecasts outlook till 2040.
  • Flexibility of providing data/insights in formats (PDF, PPT, Excel).
  • Provide cross segmentation in applicable scenario/markets.