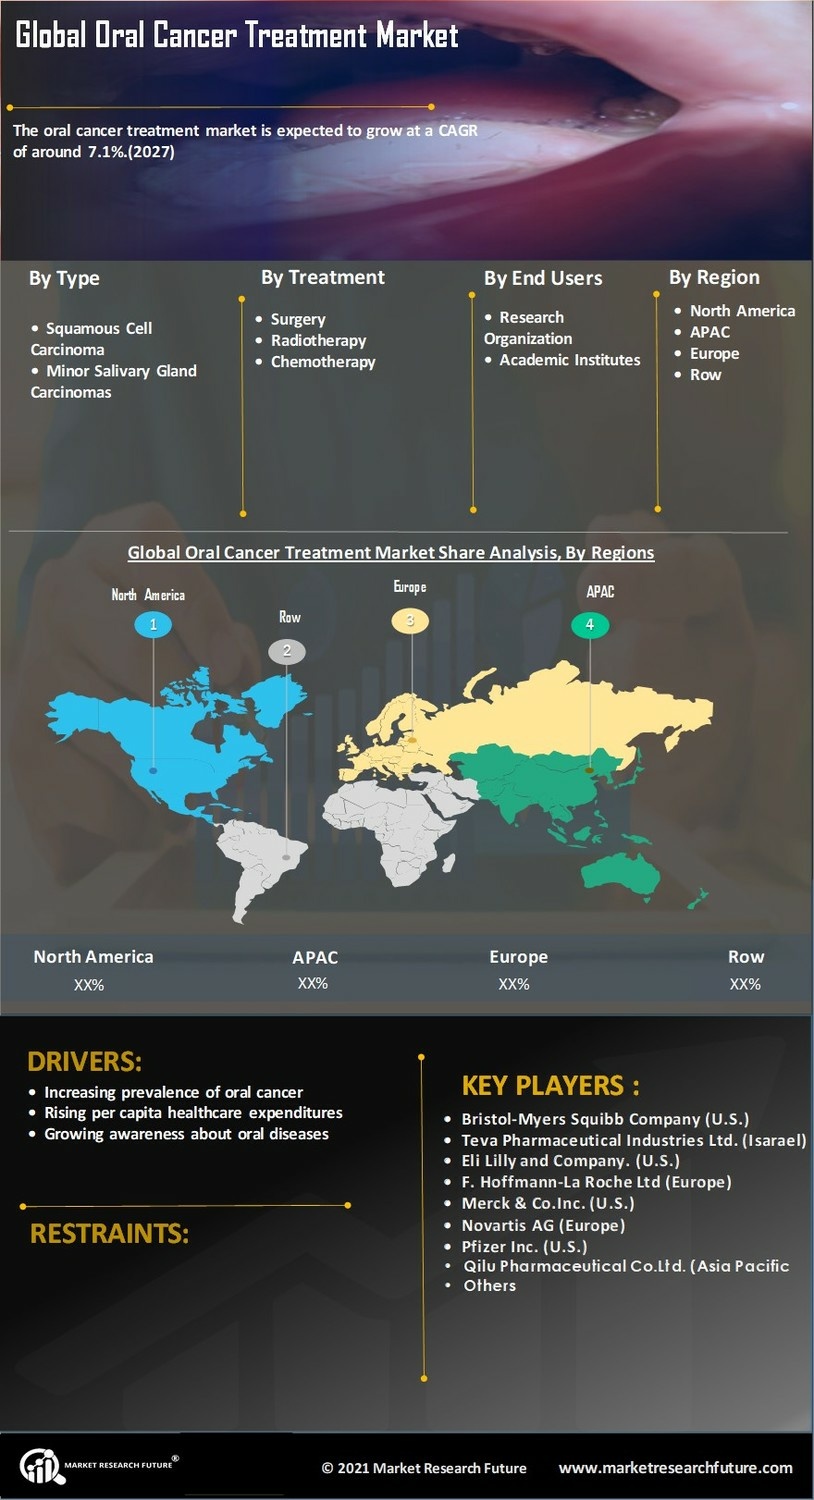
Certified Global Research Member
Isomar fd.webp Wcrc 57.webp
Key Questions Answered
  • Global Market Outlook
  • In-depth analysis of global and regional trends
  • Analyze and identify the major players in the market, their market share, key developments, etc.
  • To understand the capability of the major players based on products offered, financials, and strategies.
  • Identify disrupting products, companies, and trends.
  • To identify opportunities in the market.
  • Analyze the key challenges in the market.
  • Analyze the regional penetration of players, products, and services in the market.
  • Comparison of major playersโ€™ financial performance.
  • Evaluate strategies adopted by major players.
  • Recommendations
Why Choose Market Research Future?
  • Vigorous research methodologies for specific market.
  • Knowledge partners across the globe
  • Large network of partner consultants.
  • Ever-increasing/ Escalating data base with quarterly monitoring of various markets
  • Trusted by fortune 500 companies/startups/ universities/organizations
  • Large database of 5000+ markets reports.
  • Effective and prompt pre- and post-sales support.

Oral Cancer Treatment Market Research Report Information By Product Type (Squamous Cell Carcinoma, Verrucous Carcinoma, Minor Salivary Gland Carcinomas, Lymphomas), By Treatment (Surgery, Radiation Therapy, Targeted Therapy, Chemotherapy, Other Treatments), By Application (Hospitals And Clinics, Research Organization, Academic Institutes), And By Region (North America, Europe, Asia-Pacific, And Rest Of The World) โ€“ Market Forecast Till 2030


ID: MRFR/Pharma/1288-HCR | 90 Pages | Author: Kinjoll Dey| April 2024
Leading companies partner with us for data-driven Insights
client_1 client_2 client_3 client_4 client_5 client_6 client_7 client_8 client_9 client_10
Please fill in Business Email for Quick Response

TABLE OF CONTENT

Chapter 1. Report Prologue

Chapter 2. Market Introduction

2.1 Definition

2.2 Scope of the Study

2.2.1 Research Objective

2.2.2 Assumptions

2.2.3 Limitations

Chapter 3. Research Methodology

3.1 Introduction

3.2 Primary Research

3.3 Secondary research

3.4 Market Size Estimation

Chapter 4. Market Dynamics

4.1 Drivers

4.2 Restrains

4.3 Opportunities

4.4 Challenges

4.5 Macroeconomic Indicators

4.6 Technology Trends & Assessment

Chapter 5. Market Factor Analysis

5.1 Porters Five Forces Analysis

5.1.1 Bargaining Power of Suppliers

5.1.2 Bargaining Power of Buyers

5.1.3 Threat of New Entrants

5.1.4 Threat of Substitutes

5.1.5 Intensity of Rivalry

5.2 Value Chain Analysis

5.3 Investment Feasibility Analysis

5.4 Pricing Analysis

Chapter 6. Global Oral Cancer Treatment Market, by Type

6.1 Introduction

6.2 Squamous Cell Carcinoma

Market Estimates & Forecast, 2023-2030

6.3 Verrucous Carcinoma

Market Estimates & Forecast, 2023-2030

6.4 Minor Salivary Gland Carcinomas

Market Estimates & Forecast, 2023-2030

6.5 Lymphomas

Market Estimates & Forecast, 2023-2030

6.6 Others

Chapter 7. Global Oral Cancer Treatment Market, by Treatment

7.1 Introduction

7.2 Surgery

Market Estimates & Forecast, 2023-2030

7.2.1 Tumor Resection

7.2.2 Glossectomy

7.2.3 Laryngectomy

7.2.4 Mohs Micrographic Surgery

7.2.5 Others

7.3 Radiotherapy

Market Estimates & Forecast, 2023-2030

7.4 Chemotherapy

Market Estimates & Forecast, 2023-2030

7.4.1 Cisplatin

7.4.2 Carboplatin

7.4.3 5-fluorouracil (5-FU)

7.4.4 Others

7.5 Photodynamic Therapy (PDT)

Market Estimates & Forecast, 2023-2030

7.6 Others

Chapter 8. Global Oral Cancer Treatment Market, by End Users

8.1 Introduction

8.2 Hospitals & Clinics

Market Estimates & Forecast, 2023-2030

8.3 Research Organization

Market Estimates & Forecast, 2023-2030

8.4 Academic Institutes

Market Estimates & Forecast, 2023-2030

8.5 Others

Chapter 9. Global Oral Cancer Treatment Market, by Region

9.1 Introduction

9.2 America

9.2.1 North America

9.2.1.1 US

9.2.1.2 Canada

9.2.2 South America

9.3 Europe

9.3.1 Western Europe

9.3.1.1 Germany

9.3.1.2 France

9.3.1.3 Italy

9.3.1.4 Spain

9.3.1.5 U.K

9.3.1.6 Rest of Western Europe

9.3.2 Eastern Europe

9.4 Asia Pacific

9.4.1 Japan

9.4.2 China

9.4.3 India

9.4.4 Australia

9.4.5 Republic of Korea

9.4.6 Rest of Asia Pacific

9.5 The Middle East & Africa

9.5.1 United Arab Emirates

9.5.2 Saudi Arabia

9.5.3 Oman

9.5.4 Kuwait

9.5.5 Qatar

9.5.6 Rest of the Middle East & Africa

Chapter 10. Company Landscape

10.1 Introduction

10.2 Market Share Analysis

10.3 Key Development & Strategies

10.3.1 Key Developments

Chapter 11 Company Profiles

11.1 Bristol-Myers Squibb Company

11.1.1 Company Overview

11.1.2 Product Overview

11.1.3 Financials

11.2.4 Key Developments

11.1.5 SWOT Analysis

11.2 Qilu Pharmaceutical Co., Ltd.

11.2.1 Company Overview

11.2.2 Product Overview

11.2.3 Financial Overview

11.2.4 Key Developments

11.2.5 SWOT Analysis

11.3 Teva Pharmaceutical Industries Ltd.

11.3.1 Company Overview

11.3.2 Product Overview

11.3.3 Financial Overview

11.3.4 Key Development

11.3.5 SWOT Analysis

11.4 Eli Lilly and Company.

11.4.1 Company Overview

11.4.2 Product/Business Segment Overview

11.4.3 Financial Overview

11.4.4 Key Development

11.4.5 SWOT Analysis

11.5 F. Hoffmann-La Roche Ltd

11.5.1 Company Overview

11.5.2 Product Overview

11.5.3 Financial overview

11.5.4 Key Developments

11.5.5 SWOT Analysis

11.6 Merck & Co., Inc.

11.6.1 Company Overview

11.6.2 Product Overview

11.6.3 Financial Overview

11.6.4 Key Developments

11.6.5 SWOT Analysis

11.7 Novartis AG

11.7.1 Overview

11.7.2 Product Overview

11.7.3 Financials

11.7.4 Key Developments

11.7.5 SWOT Analysis

11.8 Pfizer Inc.

11.8.1 Overview

11.8.2 Product Overview

11.8.3 Financials

11.8.4 Key Developments

11.8.5 SWOT Analysis

11.9 Others

Chapter 12 MRFR Conclusion

12.1 Key Findings

12.1.1 From CEOโ€™s View Point

12.1.2 Unmet Needs of the Market

12.2 Key Companies to Watch

12.3 Prediction of Oral Cancer Industry

Chapter 13 Appendix

LIST OF TABLES

Table 1 Oral Cancer Treatment Industry Synopsis, 2023-2030

Table 2 Global Oral Cancer Treatment Market Estimates and Forecast, 2023-2030, (USD Million)

Table 3 Global Oral Cancer Treatment Market by Region, 2023-2030, (USD Million)

Table 4 Global Oral Cancer Treatment Market by Type, 2023-2030, (USD Million)

Table 5 Global Oral Cancer Treatment Market by Treatment, 2023-2030, (USD Million)

Table 6 Global Oral Cancer Treatment Market by End Users, 2023-2030, (USD Million)

Table 7 North America Oral Cancer Treatment Market by Type, 2023-2030, (USD Million)

Table 8 North America Oral Cancer Treatment by Treatment, 2023-2030, (USD Million)

Table 9 North America Oral Cancer Treatment by End Users, 2023-2030, (USD Million)

Table 10 U.S. Oral Cancer Treatment Market by Type, 2023-2030, (USD Million)

Table 11 U.S. Oral Cancer Treatment Market by Treatment, 2023-2030, (USD Million)

Table 12 U.S. Oral Cancer Treatment Market by End Users, 2023-2030, (USD Million)

Table 13 Canada Oral Cancer Treatment Market by Type, 2023-2030, (USD Million)

Table 14 Canada Oral Cancer Treatment Market by Treatment, 2023-2030, (USD Million)

Table 15 Canada Oral Cancer Treatment Market by End Users, 2023-2030, (USD Million)

Table 16 South America Oral Cancer Treatment Market by Type, 2023-2030, (USD Million)

Table 17 South America Oral Cancer Treatment Market by Treatment, 2023-2030, (USD Million)

Table 18 South America Oral Cancer Treatment Market by End Users, 2023-2030, (USD Million)

Table 19 Europe Oral Cancer Treatment Market by Type, 2023-2030, (USD Million)

Table 20 Europe Oral Cancer Treatment Market by Treatment, 2023-2030, (USD Million)

Table 21 Europe Oral Cancer Treatment Market by End Users, 2023-2030, (USD Million)

Table 22 Western Europe Oral Cancer Treatment Market by Type, 2023-2030, (USD Million)

Table 23 Western Europe Oral Cancer Treatment Market by Treatment, 2023-2030, (USD Million)

Table 24 Western Europe Oral Cancer Treatment Market by End Users, 2023-2030, (USD Million)

Table 25 Eastern Europe Oral Cancer Treatment Market by Type, 2023-2030, (USD Million)

Table 26 Eastern Europe Oral Cancer Treatment Market by Treatment, 2023-2030, (USD Million)

Table 27 Eastern Europe Oral Cancer Treatment Market by End Users, 2023-2030, (USD Million)

Table 28 Asia Pacific Oral Cancer Treatment Market by Type, 2023-2030, (USD Million)

Table 29 Asia Pacific Oral Cancer Treatment Market by Treatment, 2023-2030, (USD Million)

Table 30 Asia Pacific Oral Cancer Treatment Market by End Users, 2023-2030, (USD Million)

Table 31 Middle East & Africa Oral Cancer Treatment Market by Type, 2023-2030, (USD Million)

Table 32 Middle East & Africa Oral Cancer Treatment Market by Treatment, 2023-2030, (USD Million)

Table 33 Middle East & Africa Oral Cancer Treatment Market by End Users, 2023-2030, (USD Million)

LIST OF FIGURES

Figure 1 Research Process

Figure 2 Segmentation for Global Oral Cancer Treatment Market

Figure 3 Market Dynamics for Global Oral Cancer Treatment Market

Figure 4 Global Oral Cancer Treatment Market Share, by Type 2023

Figure 5 Global Oral Cancer Treatment Market Share, by Treatment 2023

Figure 6 Global Oral Cancer Treatment Market Share, by End Users, 2023

Figure 7 Global Oral Cancer Treatment Market Share, by Region, 2023

Figure 8 North America Oral Cancer Treatment Market Share, by Country, 2023

Figure 9 Europe Oral Cancer Treatment Market Share, by Country, 2023

Figure 10 Asia Pacific Oral Cancer Treatment Market Share, by Country, 2023

Figure 11 Middle East & Africa Oral Cancer Treatment Market Share, by Country, 2023

Figure 12 Global Oral Cancer Treatment Market: Company Share Analysis, 2023 (%)

Figure 13 Bristol-Myers Squibb Company: Key Financials

Figure 14 Bristol-Myers Squibb Company: Segmental Revenue

Figure 15 Bristol-Myers Squibb Company: Geographical Revenue

Figure 16 Qilu Pharmaceutical Co., Ltd.: Key Financials

Figure 17 Qilu Pharmaceutical Co., Ltd.: Segmental Revenue

Figure 18 Qilu Pharmaceutical Co., Ltd.: Geographical Revenue

Figure 19 Teva Pharmaceutical Industries Ltd.: Key Financials

Figure 20 Teva Pharmaceutical Industries Ltd.: Segmental Revenue

Figure 21 Teva Pharmaceutical Industries Ltd.: Geographical Revenue

Figure 22 Eli Lilly and Company.: Key Financials

Figure 23 Eli Lilly and Company.: Segmental Revenue

Figure 24 Eli Lilly and Company.: Geographical Revenue

Figure 25 F. Hoffmann-La Roche Ltd: Key Financials

Figure 26 F. Hoffmann-La Roche Ltd: Segmental Revenue

Figure 27 F. Hoffmann-La Roche Ltd: Geographical Revenue

Figure 28 Merck & Co., Inc.: Key Financials

Figure 29 Merck & Co., Inc.: Segmental Revenue

Figure 30 Merck & Co., Inc.: Geographical Revenue

Figure 31 Novartis AG: Key Financials

Figure 32 Novartis AG: Segmental Revenue

Figure 33 Novartis AG: Geographical Revenue

Figure 34 Pfizer Inc.: Key Financials

Figure 35 Pfizer Inc.: Segmental Revenue

Figure 36 Pfizer Inc.: Geographical Revenue

Purchase Option
Single User $ 4,950
Multiuser License $ 5,950
Enterprise User $ 7,250
Compare Licenses
Tailored for You
  • Dedicated Research on any specifics segment or region.
  • Focused Research on specific players in the market.
  • Custom Report based only on your requirements.
  • Flexibility to add or subtract any chapter in the study.
  • Historic data from 2014 and forecasts outlook till 2040.
  • Flexibility of providing data/insights in formats (PDF, PPT, Excel).
  • Provide cross segmentation in applicable scenario/markets.