Segmentation Quick Reference
| Dimension | Sub-Segments | Dominant Segment | Fastest Growing Segment |
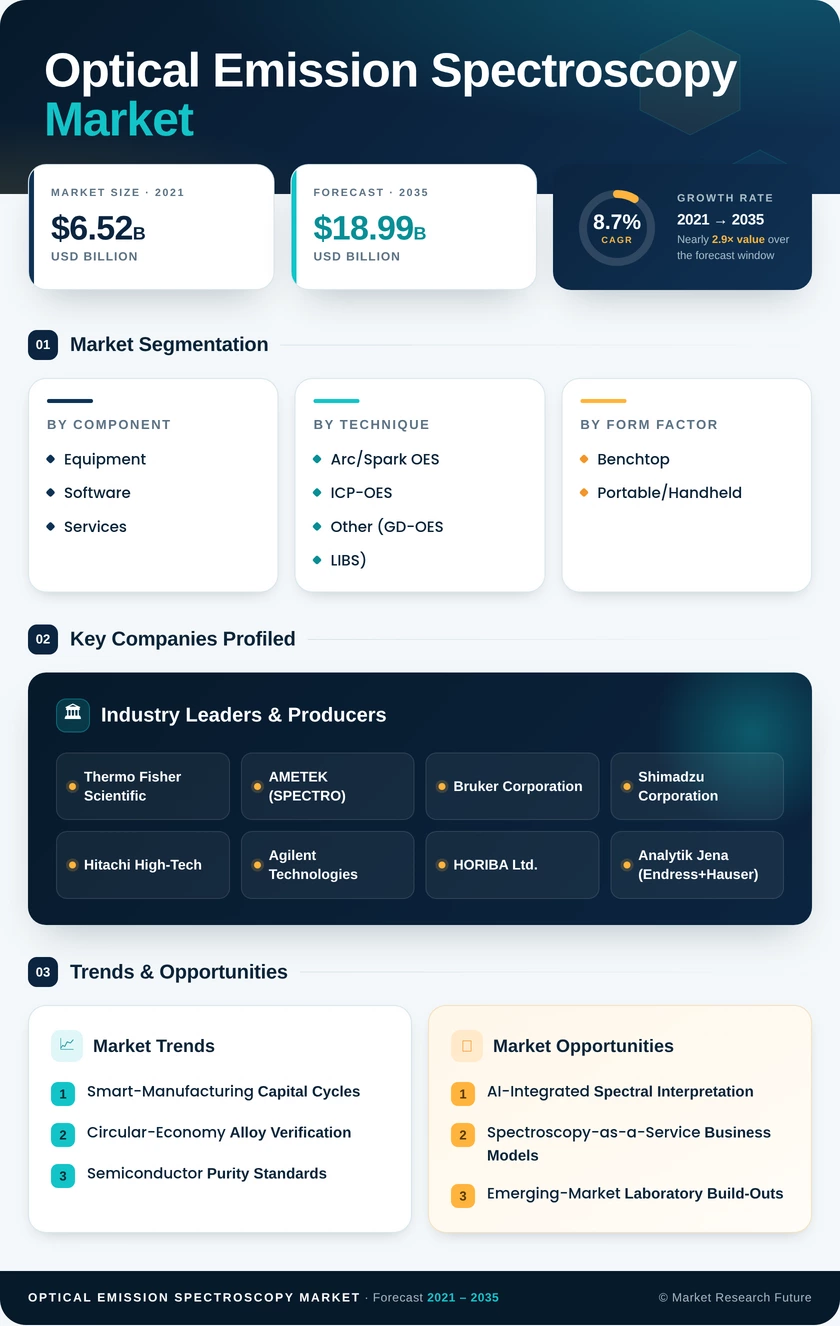
| Component | Equipment, Software, Services | Equipment | Services |
| Technique | Arc/Spark OES, ICP-OES, Other (GD-OES, LIBS) | Arc/Spark OES | ICP-OES |
| Form Factor | Benchtop, Portable/Handheld | Benchtop | Portable/Handheld |
| End-User | Metal Manufacturing & Foundry, Automotive & Transportation, Aerospace & Defence, Environmental Testing & Recycling, Others | Metal Manufacturing & Foundry | Environmental Testing & Recycling |
| Region | North America, Europe, Asia-Pacific, South America, Middle East & Africa | Asia-Pacific | North America |
Market Segmentation Overview
By Component
| Sub-Segment | Key Trend |
| Equipment | Capital replacement cycles driven by Industry 4.0 integration and next-gen detector upgrades |
| Software | AI-powered spectral interpretation and cloud-based data management gaining traction |
| Services | Multi-year calibration contracts and method-development consulting expanding as instrument fleets grow |
Equipment spending remains the primary revenue contributor, though the services segment is growing at a faster pace as laboratories seek outsourced calibration and compliance support to manage increasingly complex regulatory requirements.
By Technique
| Sub-Segment | Key Trend |
| Arc/Spark OES | Mainstay for solid-metal production testing; benefiting from automated sample changers |
| ICP-OES | Fastest-growing technique; driven by semiconductor, environmental, and pharmaceutical applications |
| Other (GD-OES, LIBS) | Niche growth in depth-profiling and remote field analysis |
Arc/Spark OES remains dominant due to its speed and simplicity for metals quality control, while ICP-OES is expanding rapidly as applications requiring liquid-phase trace analysis proliferate.
By Form Factor
| Sub-Segment | Key Trend |
| Benchtop | Preferred for laboratory precision and multi-element throughput |
| Portable/Handheld | Rapidly expanding for on-site scrap sorting, positive material identification, and field inspection |
Benchtop systems maintain the majority of installations, but portable devices are closing the performance gap and capturing an increasing share of new placements, particularly in recycling and field-testing applications.
By End-User
| Sub-Segment | Key Trend |
| Metal Manufacturing & Foundry | Largest end-user; reliant on melt-shop grade control and incoming-material verification |
| Automotive & Transportation | Lightweighting trends increasing demand for alloy-specific compositional analysis |
| Aerospace & Defence | Superalloy and titanium-alloy certification driving high-resolution instrument procurement |
| Environmental Testing & Recycling | Fastest-growing end-user; regulatory mandates on wastewater and circular-economy compliance |
| Others (Petrochemical, Pharma, Academic) | Steady demand from R&D institutions and process-industry quality labs |
Metal manufacturing is the foundational end-user, while environmental testing and recycling is the fastest-growing vertical, propelled by tightening global regulations on hazardous-metal emissions and mandatory recycled-content targets.