Segmentation Quick Reference
| Dimension | Sub-Segments | Dominant Segment | Fastest Growing Segment |
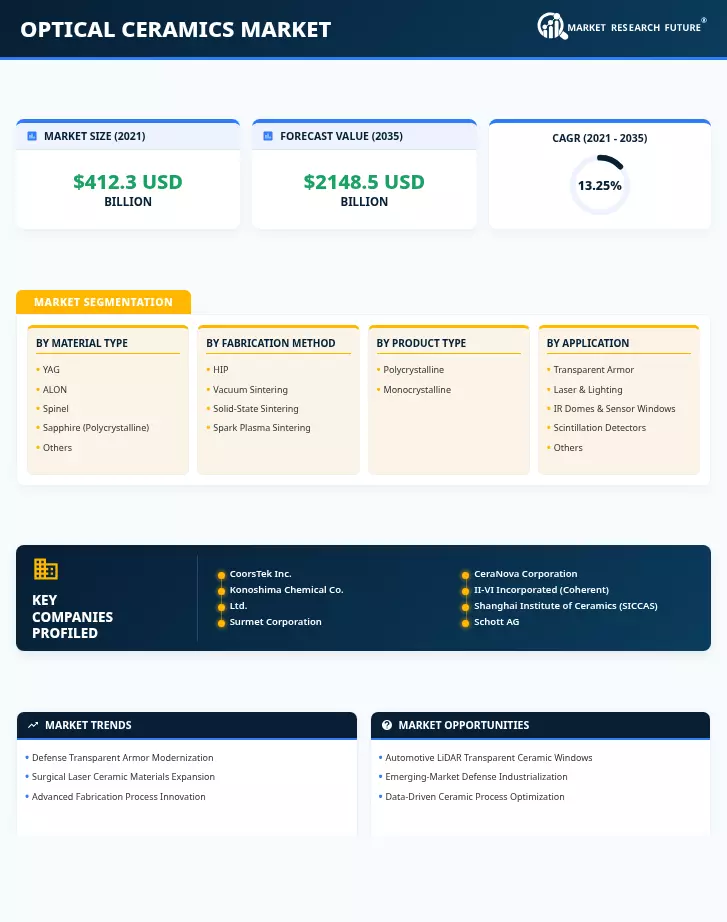
| Material Type | YAG, ALON, Spinel, Sapphire (Polycrystalline), Others | YAG (32.10% share, 2025) | ALON (13.75% CAGR) |
| Fabrication Method | HIP, Vacuum Sintering, Solid-State Sintering, Spark Plasma Sintering | HIP (43.50% share, 2025) | Spark Plasma Sintering (14.20% CAGR) |
| Product Type | Polycrystalline, Monocrystalline | Polycrystalline (72.40% share, 2025) | Monocrystalline (10.25% CAGR) |
| Application | Transparent Armor, Laser & Lighting, IR Domes & Sensor Windows, Scintillation Detectors, Others | Transparent Armor (USD 245.60 M, 2025) | Laser & Lighting (13.80% CAGR) |
| End-Use Industry | Aerospace & Defense, Healthcare, Energy & Industrial, Telecommunications, Others | Aerospace & Defense (42.30% share, 2025) | Healthcare (13.15% CAGR) |
| Geography | North America, Europe, Asia-Pacific, South America, Middle East & Africa | Asia-Pacific (40.50% share, 2025) | Middle East & Africa (11.75% CAGR) |
Market Segmentation Overview
By Material Type
| Sub-Segment | Key Trend |
| Yttrium Aluminum Garnet (YAG) | Expanding use in polycrystalline laser gain media for surgical and industrial applications |
| Aluminum Oxynitride (ALON) | Rapid defense adoption for transparent armor replacing legacy glass composites |
| Magnesium Aluminate Spinel | Growing ISR and missile dome demand across NATO and allied defense programs |
| Sapphire (Polycrystalline) | Consumer electronics and missile seeker dome applications are driving steady demand |
| Others (ZnS, ZnSe, MgF₂) | Specialized infrared and UV windows for niche scientific and defense applications |
YAG remains the material backbone of the Optical Ceramics Market owing to its dual utility in laser gain media and structural optics. ALON is closing the gap as defense procurement cycles shift decisively toward lighter, multispectral transparent armor solutions.
By Fabrication Method
| Sub-Segment | Key Trend |
| Hot Isostatic Pressing (HIP) | Preferred route for achieving theoretical-density ceramics in defense and aerospace |
| Vacuum Sintering | Cost-effective alternative gaining share in medical and industrial laser ceramics |
| Solid-State Sintering | Traditional process retaining share in standard-grade optical components |
| Spark Plasma Sintering (SPS) | Emerging rapid-processing technique for R&D prototyping and specialty parts |
HIP dominates because it delivers the lowest residual porosity, critical for defense optical ceramics demanding zero-defect optical performance. Vacuum sintering is the fastest-growing conventional method as medical OEMs prioritize cost-efficient laser ceramic materials production.
By Product Type
| Sub-Segment | Key Trend |
| Polycrystalline | Dominant format driven by scalable sintering and near-net-shape manufacturing |
| Monocrystalline | Retained premium in ultra-high-power and specialty laser applications |
Polycrystalline transparent ceramics have effectively democratized the Optical Ceramics Market by making high-performance optics accessible at an industrial scale. Monocrystalline variants serve as the performance ceiling for applications where grain boundary losses remain intolerable.
By Application
| Sub-Segment | Key Trend |
| Transparent Armor & Bullet-Resistant Windows | Largest application driven by global defense vehicle modernization |
| Laser & Lighting Components | Fastest-growing application supported by medical and industrial laser adoption |
| IR Domes & Sensor Windows | Steady growth from ISR platform proliferation and missile seeker upgrades |
| Scintillation Detectors | Niche growth in medical imaging and nuclear security scanning |
| Others | Emerging telecom and consumer electronics use cases |
Defense transparent armor anchors overall application demand, while laser and lighting applications represent the primary growth vector as healthcare and industrial sectors increase ceramic laser adoption rates.
By End-Use Industry
| Sub-Segment | Key Trend |
| Aerospace & Defense | Dominant end-use driven by transparent armor, IR domes, and sensor windows |
| Healthcare | Fastest-growing vertical as ceramic surgical lasers enter mainstream adoption |
| Energy & Industrial | Extreme-temperature monitoring and CSP applications driving steady demand |
| Telecommunications | Fiber amplifier and optical network components are creating new demand channels |
| Others (Consumer, Research) | Academic and consumer electronics applications are developing incrementally |
Aerospace and defense will continue to anchor the Optical Ceramics Market through 2035, but healthcare's accelerating growth rate signals a meaningful structural shift in demand composition over the coming decade.