×
  • Cat-intel
  • MedIntelliX
  • Resources
  • About Us
  • Hero Background
    English
    Chinese
    French
    Japanese
    Korean
    German
    Spanish

    Omega 3 Prescription Drugs Market Size

    ID: MRFR/Pharma/10635-HCR
    128 Pages
    Rahul Gotadki
    October 2025

    Omega 3 Prescription Drugs Market Research Report: Information by Drug (Vascepa, Lovaza and Others), by Application Type (Hypertriglyceridemia and Others), by Distribution Channel (Hospital Pharmacy, Retail Pharmacy and Online Pharmacy) and By Region (North America, Europe, Asia-Pacific, And Rest of the World) –Market Forecast Till 2035

    Share:
    Download PDF ×

    We do not share your information with anyone. However, we may send you emails based on your report interest from time to time. You may contact us at any time to opt-out.

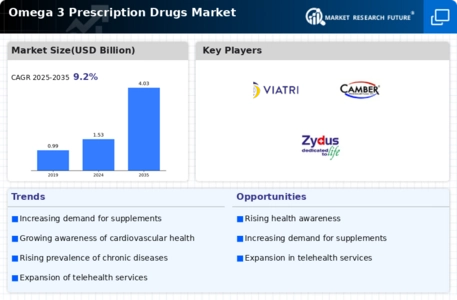
    Omega 3 Prescription Drugs Market Infographic
    Purchase Options

    Omega 3 Prescription Drugs Size

    Omega 3 Prescription Drugs Market Growth Projections and Opportunities

    The Pharmaceutical Omega-3 Prescription Drugs Market has a great role in the healthcare industry where it provides prescription medicines utilizing omega-3 fatty acids. Omega-3 fatty acids are contained in fish oil and some marine sources and have been known to have cardiovascular potential as well as anti-inflammatory benefits. The market has experienced tremendous growth due to increase in knowledge of the health gains related with having omega-3 fatty acids included in prescription drugs for different diseases.

    One of the major drivers behind the expansion of this market is that there is now a better appreciation of how omega-3 acids can benefit health: Several clinical studies suggest that regular intake could reduce triacylglycerol levels, reduce inflammation, and support overall heart function. In response, pharmaceutical companies have produced omegas rich drugs which help cardiovascular issues such as hypertriglyceridemia by providing patients with new choices on how they can manage their risks.

    The needs for novel and easily administrable dosage forms led to the provision of pharmaceutical grade preparations containing omega 3 drugs. These prescribed agents provide an assured amount of administered pure essential fats according to regulatory standards. Availability of these pharmaceutical grade omega 3 drugs enables healthcare professionals make dependable prescriptions for those patients with specific cardiovascular requirements.

    Geographically, Pharmaceutical Omega-3 Prescription Drugs Market showcases growth within regions highly burdened with cardiovascular diseases and actively involved in preventive care. North America, Europe, and Asia Pacific are major players within this market due to well-established pharmaceuticals industries presence robust healthcare facilities as well as increased awareness on need for omega 3 fatty acid consumption towards heart health.

    A significant trend observed within this market is diversification into non-cardiac indications: Some research suggests possible therapeutic applications involving mental health or cognitive functioning while others address joint pain or chronic inflammatory conditions. Therefore, drugmakers develop medications involving omega-three fatty acids specifically targeting depression disorders like rheumatoid arthritis or even Crohn’s disease thereby expanding its intervention range.

    The competitive landscape of the Pharmaceutical Omega-3 Prescription Drugs Market is characterized by the presence of pharmaceutical companies that are involved in research and development activities aimed at coming up with effective and well tolerated omega-3 formulations. These firms often perform clinical trials to ascertain safety as well as efficacy of their omega-3 prescription drugs used for a particular disease. Interactions with healthcare practitioners, academicians, amongst others continue to explore into the use of omega-3 fatty acids in medicine.
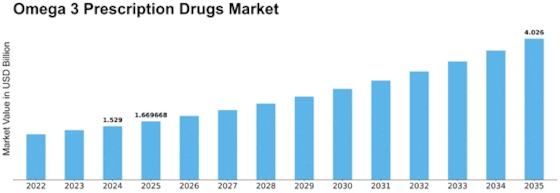
    Omega 3 Prescription Drugs Market Size Graph
    Author
    Rahul Gotadki
    Assistant Manager

    He holds an experience of about 7+ years in Market Research and Business Consulting, working under the spectrum of Life Sciences and Healthcare domains. Rahul conceptualizes and implements a scalable business strategy and provides strategic leadership to the clients. His expertise lies in market estimation, competitive intelligence, pipeline analysis, customer assessment, etc. In addition to the above, his other responsibility includes strategic tracking of high growth markets & advising clients on the potential areas of focus they could direct their business initiatives

    Leave a Comment

    FAQs

    What is the projected growth of the Omega 3 Prescription Drugs market?

    The Omega 3 Prescription Drugs market is the expected increase in total market value of 4.03 USD billion over a defined forecast period 2025–2035. It is driven by factors such as demand trends, technological advances, regulatory changes, and geographic expansion.

    What is the size of the Omega 3 Prescription Drugs market?

    Omega 3 Prescription Drugs market size was valued at approximately 1.53 billion USD in 2024. This figure will reach 4.03 billion USD covering all regions (America, Europe, Asia, MEA and ROW), focusing its segments / services / distribution channels till 2035.

    What is the CAGR of the Omega 3 Prescription Drugs market?

    Omega 3 Prescription Drugs market is expected to grow at a CAGR of 9.2% between 2025 and 2035.

    How much will the Omega 3 Prescription Drugs market be worth by 2035?

    Omega 3 Prescription Drugs market is expected to be worth of 4.03 billion USD, reflecting growth driven by usage, technology and global demands by the end of 2035.

    How will the Omega 3 Prescription Drugs market perform over the next 10 years?

    Over the next 10 years the Omega 3 Prescription Drugs market is expected to shift from usd billion 1.53 to 4.03 billion USD, led by adoption of advanced tech, demographic trends, regulatory approvals, with potential headwinds from 2025 to 2035.

    Which region held the largest market share in the Omega 3 prescription drugs market?

    North America had the largest share in the market

    Market Summary

    As per MRFR analysis, the Omega 3 Prescription Drugs Market Size was estimated at 1.529 USD Billion in 2024. The Omega 3 Prescription Drugs industry is projected to grow from 1.67 in 2025 to 4.026 by 2035, exhibiting a compound annual growth rate (CAGR) of 9.2 during the forecast period 2025 - 2035.

    Key Market Trends & Highlights

    The Omega 3 Prescription Drugs Market is experiencing a dynamic shift towards personalized medicine and innovative delivery systems.

    • Health consciousness is rising, driving demand for Omega 3 prescription drugs in North America and Asia-Pacific.
    • The personalized medicine approach is gaining traction, particularly in the hypertriglyceridemia segment, which remains the largest.
    • Innovative delivery systems are emerging, with Lovaza showing the fastest growth among Omega 3 products.
    • Market drivers include the increasing prevalence of cardiovascular diseases and a rising demand for preventive healthcare.

    Market Size & Forecast

    2024 Market Size 1.529 (USD Billion)
    2035 Market Size 4.026 (USD Billion)
    CAGR (2025 - 2035) 9.2%
    Largest Regional Market Share in 2024 North America

    Major Players

    <p>Amgen (US), Bristol-Myers Squibb (US), GlaxoSmithKline (GB), Pfizer (US), Bayer (DE), Novartis (CH), Sanofi (FR), Mylan (US), AstraZeneca (GB)</p>

    Market Trends

    The Omega 3 Prescription Drugs Market is currently experiencing a notable evolution, driven by increasing awareness regarding the health benefits associated with omega-3 fatty acids. These compounds are recognized for their potential to support cardiovascular health, reduce inflammation, and enhance cognitive function. As healthcare professionals increasingly recommend omega-3 supplements for various medical conditions, the demand for prescription formulations is likely to rise. This trend is further supported by ongoing research that continues to unveil the therapeutic potential of omega-3s, thereby expanding their applications in clinical settings. Moreover, the market landscape is characterized by a growing emphasis on personalized medicine. Patients are seeking tailored treatment options that align with their specific health needs, which may lead to the development of more specialized omega-3 formulations. Pharmaceutical companies are responding to this shift by investing in innovative delivery systems and formulations that enhance bioavailability and efficacy. As the Omega 3 Prescription Drugs Market continues to evolve, it appears poised for growth, driven by both consumer demand and advancements in scientific research.

    Rising Health Consciousness

    There is a growing trend of health awareness among consumers, leading to increased interest in omega-3 fatty acids. This heightened consciousness is prompting individuals to seek out prescription options that can provide health benefits, particularly for heart and brain health.

    Personalized Medicine Approach

    The shift towards personalized medicine is influencing the Omega 3 Prescription Drugs Market. Patients are increasingly looking for treatments tailored to their unique health profiles, which may drive the development of specialized omega-3 formulations.

    Innovative Delivery Systems

    Pharmaceutical companies are focusing on creating advanced delivery systems for omega-3 drugs. These innovations aim to improve the bioavailability and effectiveness of omega-3 supplements, making them more appealing to both healthcare providers and patients.

    Omega 3 Prescription Drugs Market Market Drivers

    Growing Interest in Nutraceuticals

    The rising interest in nutraceuticals is significantly influencing the Omega 3 Prescription Drugs Market. Consumers are increasingly seeking natural and dietary supplements that offer health benefits, and omega-3 fatty acids are at the forefront of this trend. This growing consumer preference is prompting pharmaceutical companies to explore omega-3 formulations that combine therapeutic effects with nutritional benefits. Market data suggests that the nutraceutical segment is expected to witness substantial growth, with omega-3 products playing a crucial role in this expansion. As awareness of the health benefits of omega-3s continues to spread, the market is likely to see a corresponding increase in demand for prescription omega-3 drugs.

    Advancements in Pharmaceutical Research

    Innovations in pharmaceutical research are propelling the Omega 3 Prescription Drugs Market forward. Recent studies have unveiled new formulations and delivery methods that enhance the bioavailability and efficacy of omega-3 fatty acids. These advancements not only improve patient compliance but also expand the therapeutic applications of omega-3 drugs. For instance, novel encapsulation techniques are being developed to protect omega-3s from oxidation, thereby increasing their stability and effectiveness. As a result, the market is likely to experience a surge in new product launches, further stimulating growth and attracting investment in omega-3 research and development.

    Regulatory Support for Omega-3 Products

    Regulatory bodies are increasingly recognizing the health benefits of omega-3 fatty acids, which is fostering growth in the Omega 3 Prescription Drugs Market. Recent approvals for omega-3-based prescription drugs by various health authorities have paved the way for broader acceptance and utilization in clinical settings. This regulatory support not only enhances consumer confidence but also encourages pharmaceutical companies to invest in omega-3 research and development. As a result, the market is anticipated to grow, with an expected increase in the number of approved omega-3 products, thereby expanding treatment options for patients.

    Rising Demand for Preventive Healthcare

    The shift towards preventive healthcare is another significant driver for the Omega 3 Prescription Drugs Market. As individuals become more proactive about their health, there is a growing inclination to utilize omega-3 supplements as a preventive measure against various health issues, including inflammation and chronic diseases. This trend is supported by a surge in health awareness campaigns and educational initiatives that emphasize the benefits of omega-3 fatty acids. Consequently, the market is expected to expand, with an estimated increase in sales volume projected to reach several billion dollars by 2027, as consumers prioritize preventive strategies in their healthcare regimens.

    Increasing Prevalence of Cardiovascular Diseases

    The rising incidence of cardiovascular diseases is a pivotal driver for the Omega 3 Prescription Drugs Market. As heart-related ailments continue to escalate, healthcare professionals increasingly recommend omega-3 fatty acids for their cardioprotective properties. Studies indicate that omega-3 supplementation can significantly reduce triglyceride levels and improve overall heart health. This growing awareness among patients and healthcare providers is likely to bolster the demand for omega-3 prescription drugs. Furthermore, the market is projected to witness a compound annual growth rate (CAGR) of approximately 7% over the next few years, reflecting the increasing reliance on these supplements as part of cardiovascular disease management.

    Market Segment Insights

    By Drug: Vascepa (Largest) vs. Lovaza (Fastest-Growing)

    <p>In the Omega 3 Prescription Drugs Market, the distribution of market share reveals that Vascepa holds a significant portion, firmly establishing itself as the largest player in this segment. Lovaza, on the other hand, although smaller in market share, is rapidly gaining traction. Other alternatives also contribute to the competitive landscape, but they remain niche compared to these two leading products. The variance in performance is largely driven by brand recognition and the clinical efficacy that has been consistently demonstrated by these drugs. Analyzing growth trends, Lovaza is emerging as the fastest-growing option, propelled by increasing prescriptions, supportive clinical data, and a growing awareness of omega-3 benefits among healthcare providers. The rising prevalence of cardiovascular diseases and the push for preventive drug therapies further fuel the demand for FDA-approved omega-3 prescriptions, particularly for Lovaza and Vascepa. This trend positions both products strongly within the evolving landscape of prescription drugs, enhancing their market relevance.</p>

    <p>Vascepa (Dominant) vs. Lovaza (Emerging)</p>

    <p>Vascepa has established itself as the dominant force in the Omega 3 Prescription Drugs Market due to its unique formulation and strong clinical backing for reducing triglyceride levels. It has forged a strong reputation as a reliable treatment option for patients with specific cardiovascular issues, leading to robust prescriptions among healthcare professionals. On the other hand, Lovaza represents an emerging player in this segment, benefiting from expanding acceptance and endorsement within clinical guidelines. Lovaza's appeal lies in its mix of omega-3 fatty acids derived from fish oil, making it a versatile choice for various cardiovascular applications. The competition between these two drugs shapes market dynamics, with both carving out significant consumer bases and driving innovations in omega-3 therapy.</p>

    By Application Type: Hypertriglyceridemia (Largest) vs. Others (Fastest-Growing)

    <p>The application type segment of the Omega 3 prescription drugs market is primarily dominated by the treatment of hypertriglyceridemia, which holds a substantial market share. This condition, characterized by elevated triglyceride levels in the blood, necessitates the use of Omega 3 drugs for effective management. In contrast, other applications encompassing various health conditions are experiencing increasing interest and utilization, gradually gaining traction in the market.</p>

    <p>Hypertriglyceridemia (Dominant) vs. Others (Emerging)</p>

    <p>Hypertriglyceridemia remains the dominant application type within the Omega 3 prescription drugs market, primarily due to the high prevalence of this condition and the proven efficacy of Omega 3 fatty acids in managing triglyceride levels. The increasing awareness of cardiovascular health and the benefits of Omega 3 in reducing heart disease risks significantly contribute to its sustained demand. On the other hand, the 'Others' category represents an emerging segment as it includes various other health indications where Omega 3 has shown potential benefits, such as inflammatory diseases and metabolic disorders. This rising interest is supported by ongoing research and clinical trials, which are validating the therapeutic effects of Omega 3 in these areas.</p>

    By Distribution Channel: Retail Pharmacy (Largest) vs. Online Pharmacy (Fastest-Growing)

    <p>In the Omega 3 Prescription Drugs Market, the distribution of market share among channels is quite revealing. Retail pharmacies hold the largest share, serving as the primary point of access for patients and healthcare providers alike. This is largely attributed to their established presence, accessibility, and the trust that consumers place in physical pharmacies for obtaining prescription medications. On the other hand, online pharmacies are rapidly gaining traction, catering to a growing segment of consumers seeking convenience and privacy in their healthcare choices.</p>

    <p>Retail Pharmacy (Dominant) vs. Online Pharmacy (Emerging)</p>

    <p>The Retail Pharmacy segment is characterized by its extensive network and customer loyalty, which fortifies its position in the Omega 3 Prescription Drugs Market. These pharmacies offer personalized services and face-to-face consultations, which enhances customer experience and adherence to prescriptions. In contrast, Online Pharmacies represent an emerging trend, driven by technological advancements and shifting consumer behaviors towards digital solutions. They offer advantages such as a wider product range, competitive pricing, and the ability to order from the comfort of home. As consumers become more tech-savvy and accustomed to e-commerce, the demand for online pharmacies is expected to surge, reshaping the distribution landscape.</p>

    Get more detailed insights about Omega 3 Prescription Drugs Market Research Report 2035

    Regional Insights

    By region, the study provides the market insights into North America, Europe, Asia-Pacific and Rest of the World. The North America Omega 3 Prescription Drugs Market dominated this market in 2022 (45.80%). Numerous top pharmaceutical companies engaged in the development of Omega-3 drugs are based in North America. These businesses make investments in marketing, clinical trials, and research and development, which propels the availability and uptake of prescription Omega-3 medications. Further, the U.S.

    Omega 3 prescription drugs market held the largest market share, and the Canada Omega 3 prescription drugs market was the fastest growing market in the North America region.

    Further, the major countries studied in the market report are The U.S., Canada, German, France, the UK, Italy, Spain, China, Japan, India, Australia, South Korea, and Brazil.

    Figure 2: OMEGA 3 PRESCRIPTION DRUGS MARKET SHARE BY REGION 2022 (USD Billion)

    OMEGA 3 PRESCRIPTION DRUGS MARKET SHARE BY REGION 2022

    Source: Secondary Research, Primary Research, Market Research Future Database and Analyst Review

    Europe Omega 3 prescription drugs market accounts for the second-largest market share. Europe has an aging population, just like many other developed regions. The aforementioned demographic trend necessitates healthcare interventions aimed at addressing age-related illnesses, like joint difficulties and cognitive loss, for which prescription Omega-3 medications are appropriate. Further, the German Omega 3 prescription drugs market held the largest market share, and the UK Omega 3 prescription drugs market was the fastest growing market in the European region.

    The Asia-Pacific Omega 3 Prescription Drugs Market is expected to grow at the fastest CAGR from 2023 to 2032. The middle class is growing as a result of the substantial economic growth occurring in the Asia Pacific area. The demand for Omega-3 prescription medications and supplements is being driven by this group's growing emphasis on health and wellness. Moreover, China’s Omega 3 prescription drugs market held the largest market share, and the Indian Omega 3 prescription drugs market was the fastest growing market in the Asia-Pacific region.

    Key Players and Competitive Insights

    Leading market players are investing heavily in research and development in order to expand their product lines, which will help the Omega 3 prescription drugs market, grow even more. Market participants are also undertaking a variety of strategic activities to expand their footprint, with important market developments including new product launches, contractual agreements, mergers and acquisitions, higher investments, and collaboration with other organizations. To expand and survive in a more competitive and rising market climate, Omega 3 prescription drugs industry must offer cost-effective items.

    Manufacturing locally to minimize operational costs is one of the key business tactics used by manufacturers in the Omega 3 prescription drugs industry to benefit clients and increase the market sector. In recent years, the Omega 3 prescription drugs industry has offered some of the most significant advantages to medicine. Major players in the Omega 3 prescription drugs market, including Abbott, Amarin Pharmaceuticals Ireland Ltd., GSK plc, Natrapharm, Inc. (Patriot Pharmaceutical Corp.), Viatris Inc., Grupo Ferrer Internacional, S.A., Camber Pharmaceuticals, Inc., Dr.

    Reddy’s Laboratories Ltd., Zydus Group, Hikma Pharmaceuticals PLC and others, are attempting to increase market demand by investing in research and development operations.

    The corporation Abbott Laboratories (Abbott) is in charge of the research, development, production, and marketing of a broad range of healthcare goods, including branded generic drugs, nutritional supplements for adults and children, and diagnostic equipment and tests. The company also sells medical equipment related to heart failure, electrophysiology, rhythm management, vascular and structural cardiac devices, and neuromodulation. The business also offers dietary supplements, minerals, and other nutritional products for sale. It maintains research and development facilities in the US, China, Colombia, India, Singapore, Spain, and the UK in addition to operating manufacturing facilities all over the world.

    Europe, Asia-Pacific, Africa, Latin America, the Middle East, and North America are among the regions in which the corporation offers its products. Abbott headquarters are in Abbott Park, Illinois, in the United States.

    Active pharmaceutical ingredients (APIs), proprietary products, generic formulations, and biosimilars are all produced and sold by pharmaceutical producer Dr. Reddy's Laboratories Ltd. (Dr. Reddy's). The corporation's generic drugs are prescribed to treat gastrointestinal issues, various cancer types, pain, cardiovascular ailments, central nervous system disorders, infectious diseases, and pediatric illnesses. The company also produces and markets generic biosimilar products. Among the goods in its pipeline are New Chemical Entities (NCEs) intended to treat bacterial infections, pain, inflammation, and metabolic issues. The company sells its products in Europe, Latin America, Asia, and the United States. Telangana, India's Hyderabad is home to Dr.

    Reddy's primary office.

    Key Companies in the Omega 3 Prescription Drugs Market market include

    Industry Developments

    In September 2024, Amarin Corporation showed its main research focus on heart disease risk reduction for diabetes patients with previous CABG surgery (REDUCE-IT analysis) and the anti-Lp(a) oxidation action of hyperglycemia. Other important efforts include the reduction of ischemic events in selected high risk patients and eicosapentaenoic acid A’s effects on the heart and other associated complications. VASCEPA, which is now used throughout the world in patients on statin therapy with uncontrolled cardiovascular risk, is VASCEPA’s claim to fame and a key component in improving the care of these patients.

    In July 2024, Amarin Corporation announced the National Health Systems of Portugal reimbursement of VAZKEPA (icosapent ethyl) for the prevention of cardiovascular events in patients with increased triacylglycerolemia and significant cardiovascular risk. With this decision, VAZKEPA becomes the eighth reimbursed product in Europe, which will allow sales to start in Portugal in August 2024. Cardiovascular disease accounts for 10.7% of the Portuguese population aged 45-79 years and accounts for 29% of mortality each year. This reimbursement supports Amarin's business objectives to increase the geographic reach of the European market and to help the overwhelmingly high burden cardiovascular health is facing.

    Future Outlook

    Omega 3 Prescription Drugs Market Future Outlook

    <p>The Omega 3 Prescription Drugs Market is projected to grow at a 9.2% CAGR from 2024 to 2035, driven by increasing health awareness and rising demand for cardiovascular health solutions.</p>

    New opportunities lie in:

    • <p>Development of personalized Omega 3 formulations for specific health conditions.</p>
    • <p>Expansion into emerging markets with tailored marketing strategies.</p>
    • <p>Partnerships with telehealth platforms for remote prescription services.</p>

    <p>By 2035, the Omega 3 Prescription Drugs Market is expected to be robust and diversified.</p>

    Market Segmentation

    Omega 3 Prescription Drugs Market Drug Outlook

    • Vascepa
    • Lovaza
    • Others

    Omega 3 Prescription Drugs Market Application Type Outlook

    • Hypertriglyceridemia
    • Others

    Omega 3 Prescription Drugs Market Distribution Channel Outlook

    • Hospital Pharmacy
    • Retail Pharmacy
    • Online Pharmacy

    Report Scope

    MARKET SIZE 20241.529(USD Billion)
    MARKET SIZE 20251.67(USD Billion)
    MARKET SIZE 20354.026(USD Billion)
    COMPOUND ANNUAL GROWTH RATE (CAGR)9.2% (2024 - 2035)
    REPORT COVERAGERevenue Forecast, Competitive Landscape, Growth Factors, and Trends
    BASE YEAR2024
    Market Forecast Period2025 - 2035
    Historical Data2019 - 2024
    Market Forecast UnitsUSD Billion
    Key Companies ProfiledMarket analysis in progress
    Segments CoveredMarket segmentation analysis in progress
    Key Market OpportunitiesGrowing demand for Omega 3 Prescription Drugs driven by increasing awareness of cardiovascular health benefits.
    Key Market DynamicsRising demand for Omega 3 prescription drugs driven by increasing awareness of cardiovascular health benefits and regulatory support.
    Countries CoveredNorth America, Europe, APAC, South America, MEA

    FAQs

    What is the projected growth of the Omega 3 Prescription Drugs market?

    The Omega 3 Prescription Drugs market is the expected increase in total market value of 4.03 USD billion over a defined forecast period 2025–2035. It is driven by factors such as demand trends, technological advances, regulatory changes, and geographic expansion.

    What is the size of the Omega 3 Prescription Drugs market?

    Omega 3 Prescription Drugs market size was valued at approximately 1.53 billion USD in 2024. This figure will reach 4.03 billion USD covering all regions (America, Europe, Asia, MEA and ROW), focusing its segments / services / distribution channels till 2035.

    What is the CAGR of the Omega 3 Prescription Drugs market?

    Omega 3 Prescription Drugs market is expected to grow at a CAGR of 9.2% between 2025 and 2035.

    How much will the Omega 3 Prescription Drugs market be worth by 2035?

    Omega 3 Prescription Drugs market is expected to be worth of 4.03 billion USD, reflecting growth driven by usage, technology and global demands by the end of 2035.

    How will the Omega 3 Prescription Drugs market perform over the next 10 years?

    Over the next 10 years the Omega 3 Prescription Drugs market is expected to shift from usd billion 1.53 to 4.03 billion USD, led by adoption of advanced tech, demographic trends, regulatory approvals, with potential headwinds from 2025 to 2035.

    Which region held the largest market share in the Omega 3 prescription drugs market?

    North America had the largest share in the market

    1. SECTION I: EXECUTIVE SUMMARY AND KEY HIGHLIGHTS
      1. | 1.1 EXECUTIVE SUMMARY
      2. | | 1.1.1 Market Overview
      3. | | 1.1.2 Key Findings
      4. | | 1.1.3 Market Segmentation
      5. | | 1.1.4 Competitive Landscape
      6. | | 1.1.5 Challenges and Opportunities
      7. | | 1.1.6 Future Outlook
    2. SECTION II: SCOPING, METHODOLOGY AND MARKET STRUCTURE
      1. | 2.1 MARKET INTRODUCTION
      2. | | 2.1.1 Definition
      3. | | 2.1.2 Scope of the study
      4. | | | 2.1.2.1 Research Objective
      5. | | | 2.1.2.2 Assumption
      6. | | | 2.1.2.3 Limitations
      7. | 2.2 RESEARCH METHODOLOGY
      8. | | 2.2.1 Overview
      9. | | 2.2.2 Data Mining
      10. | | 2.2.3 Secondary Research
      11. | | 2.2.4 Primary Research
      12. | | | 2.2.4.1 Primary Interviews and Information Gathering Process
      13. | | | 2.2.4.2 Breakdown of Primary Respondents
      14. | | 2.2.5 Forecasting Model
      15. | | 2.2.6 Market Size Estimation
      16. | | | 2.2.6.1 Bottom-Up Approach
      17. | | | 2.2.6.2 Top-Down Approach
      18. | | 2.2.7 Data Triangulation
      19. | | 2.2.8 Validation
    3. SECTION III: QUALITATIVE ANALYSIS
      1. | 3.1 MARKET DYNAMICS
      2. | | 3.1.1 Overview
      3. | | 3.1.2 Drivers
      4. | | 3.1.3 Restraints
      5. | | 3.1.4 Opportunities
      6. | 3.2 MARKET FACTOR ANALYSIS
      7. | | 3.2.1 Value chain Analysis
      8. | | 3.2.2 Porter's Five Forces Analysis
      9. | | | 3.2.2.1 Bargaining Power of Suppliers
      10. | | | 3.2.2.2 Bargaining Power of Buyers
      11. | | | 3.2.2.3 Threat of New Entrants
      12. | | | 3.2.2.4 Threat of Substitutes
      13. | | | 3.2.2.5 Intensity of Rivalry
      14. | | 3.2.3 COVID-19 Impact Analysis
      15. | | | 3.2.3.1 Market Impact Analysis
      16. | | | 3.2.3.2 Regional Impact
      17. | | | 3.2.3.3 Opportunity and Threat Analysis
    4. SECTION IV: QUANTITATIVE ANALYSIS
      1. | 4.1 Healthcare, BY Drug (USD Billion)
      2. | | 4.1.1 Vascepa
      3. | | 4.1.2 Lovaza
      4. | | 4.1.3 Others
      5. | 4.2 Healthcare, BY Application Type (USD Billion)
      6. | | 4.2.1 Hypertriglyceridemia
      7. | | 4.2.2 Others
      8. | 4.3 Healthcare, BY Distribution Channel (USD Billion)
      9. | | 4.3.1 Hospital Pharmacy
      10. | | 4.3.2 Retail Pharmacy
      11. | | 4.3.3 Online Pharmacy
      12. | 4.4 Healthcare, BY Region (USD Billion)
      13. | | 4.4.1 North America
      14. | | | 4.4.1.1 US
      15. | | | 4.4.1.2 Canada
      16. | | 4.4.2 Europe
      17. | | | 4.4.2.1 Germany
      18. | | | 4.4.2.2 UK
      19. | | | 4.4.2.3 France
      20. | | | 4.4.2.4 Russia
      21. | | | 4.4.2.5 Italy
      22. | | | 4.4.2.6 Spain
      23. | | | 4.4.2.7 Rest of Europe
      24. | | 4.4.3 APAC
      25. | | | 4.4.3.1 China
      26. | | | 4.4.3.2 India
      27. | | | 4.4.3.3 Japan
      28. | | | 4.4.3.4 South Korea
      29. | | | 4.4.3.5 Malaysia
      30. | | | 4.4.3.6 Thailand
      31. | | | 4.4.3.7 Indonesia
      32. | | | 4.4.3.8 Rest of APAC
      33. | | 4.4.4 South America
      34. | | | 4.4.4.1 Brazil
      35. | | | 4.4.4.2 Mexico
      36. | | | 4.4.4.3 Argentina
      37. | | | 4.4.4.4 Rest of South America
      38. | | 4.4.5 MEA
      39. | | | 4.4.5.1 GCC Countries
      40. | | | 4.4.5.2 South Africa
      41. | | | 4.4.5.3 Rest of MEA
    5. SECTION V: COMPETITIVE ANALYSIS
      1. | 5.1 Competitive Landscape
      2. | | 5.1.1 Overview
      3. | | 5.1.2 Competitive Analysis
      4. | | 5.1.3 Market share Analysis
      5. | | 5.1.4 Major Growth Strategy in the Healthcare
      6. | | 5.1.5 Competitive Benchmarking
      7. | | 5.1.6 Leading Players in Terms of Number of Developments in the Healthcare
      8. | | 5.1.7 Key developments and growth strategies
      9. | | | 5.1.7.1 New Product Launch/Service Deployment
      10. | | | 5.1.7.2 Merger & Acquisitions
      11. | | | 5.1.7.3 Joint Ventures
      12. | | 5.1.8 Major Players Financial Matrix
      13. | | | 5.1.8.1 Sales and Operating Income
      14. | | | 5.1.8.2 Major Players R&D Expenditure. 2023
      15. | 5.2 Company Profiles
      16. | | 5.2.1 Amgen (US)
      17. | | | 5.2.1.1 Financial Overview
      18. | | | 5.2.1.2 Products Offered
      19. | | | 5.2.1.3 Key Developments
      20. | | | 5.2.1.4 SWOT Analysis
      21. | | | 5.2.1.5 Key Strategies
      22. | | 5.2.2 Bristol-Myers Squibb (US)
      23. | | | 5.2.2.1 Financial Overview
      24. | | | 5.2.2.2 Products Offered
      25. | | | 5.2.2.3 Key Developments
      26. | | | 5.2.2.4 SWOT Analysis
      27. | | | 5.2.2.5 Key Strategies
      28. | | 5.2.3 GlaxoSmithKline (GB)
      29. | | | 5.2.3.1 Financial Overview
      30. | | | 5.2.3.2 Products Offered
      31. | | | 5.2.3.3 Key Developments
      32. | | | 5.2.3.4 SWOT Analysis
      33. | | | 5.2.3.5 Key Strategies
      34. | | 5.2.4 Pfizer (US)
      35. | | | 5.2.4.1 Financial Overview
      36. | | | 5.2.4.2 Products Offered
      37. | | | 5.2.4.3 Key Developments
      38. | | | 5.2.4.4 SWOT Analysis
      39. | | | 5.2.4.5 Key Strategies
      40. | | 5.2.5 Bayer (DE)
      41. | | | 5.2.5.1 Financial Overview
      42. | | | 5.2.5.2 Products Offered
      43. | | | 5.2.5.3 Key Developments
      44. | | | 5.2.5.4 SWOT Analysis
      45. | | | 5.2.5.5 Key Strategies
      46. | | 5.2.6 Novartis (CH)
      47. | | | 5.2.6.1 Financial Overview
      48. | | | 5.2.6.2 Products Offered
      49. | | | 5.2.6.3 Key Developments
      50. | | | 5.2.6.4 SWOT Analysis
      51. | | | 5.2.6.5 Key Strategies
      52. | | 5.2.7 Sanofi (FR)
      53. | | | 5.2.7.1 Financial Overview
      54. | | | 5.2.7.2 Products Offered
      55. | | | 5.2.7.3 Key Developments
      56. | | | 5.2.7.4 SWOT Analysis
      57. | | | 5.2.7.5 Key Strategies
      58. | | 5.2.8 Mylan (US)
      59. | | | 5.2.8.1 Financial Overview
      60. | | | 5.2.8.2 Products Offered
      61. | | | 5.2.8.3 Key Developments
      62. | | | 5.2.8.4 SWOT Analysis
      63. | | | 5.2.8.5 Key Strategies
      64. | | 5.2.9 AstraZeneca (GB)
      65. | | | 5.2.9.1 Financial Overview
      66. | | | 5.2.9.2 Products Offered
      67. | | | 5.2.9.3 Key Developments
      68. | | | 5.2.9.4 SWOT Analysis
      69. | | | 5.2.9.5 Key Strategies
      70. | 5.3 Appendix
      71. | | 5.3.1 References
      72. | | 5.3.2 Related Reports
    6. LIST OF FIGURES
      1. | 6.1 MARKET SYNOPSIS
      2. | 6.2 NORTH AMERICA MARKET ANALYSIS
      3. | 6.3 US MARKET ANALYSIS BY DRUG
      4. | 6.4 US MARKET ANALYSIS BY APPLICATION TYPE
      5. | 6.5 US MARKET ANALYSIS BY DISTRIBUTION CHANNEL
      6. | 6.6 CANADA MARKET ANALYSIS BY DRUG
      7. | 6.7 CANADA MARKET ANALYSIS BY APPLICATION TYPE
      8. | 6.8 CANADA MARKET ANALYSIS BY DISTRIBUTION CHANNEL
      9. | 6.9 EUROPE MARKET ANALYSIS
      10. | 6.10 GERMANY MARKET ANALYSIS BY DRUG
      11. | 6.11 GERMANY MARKET ANALYSIS BY APPLICATION TYPE
      12. | 6.12 GERMANY MARKET ANALYSIS BY DISTRIBUTION CHANNEL
      13. | 6.13 UK MARKET ANALYSIS BY DRUG
      14. | 6.14 UK MARKET ANALYSIS BY APPLICATION TYPE
      15. | 6.15 UK MARKET ANALYSIS BY DISTRIBUTION CHANNEL
      16. | 6.16 FRANCE MARKET ANALYSIS BY DRUG
      17. | 6.17 FRANCE MARKET ANALYSIS BY APPLICATION TYPE
      18. | 6.18 FRANCE MARKET ANALYSIS BY DISTRIBUTION CHANNEL
      19. | 6.19 RUSSIA MARKET ANALYSIS BY DRUG
      20. | 6.20 RUSSIA MARKET ANALYSIS BY APPLICATION TYPE
      21. | 6.21 RUSSIA MARKET ANALYSIS BY DISTRIBUTION CHANNEL
      22. | 6.22 ITALY MARKET ANALYSIS BY DRUG
      23. | 6.23 ITALY MARKET ANALYSIS BY APPLICATION TYPE
      24. | 6.24 ITALY MARKET ANALYSIS BY DISTRIBUTION CHANNEL
      25. | 6.25 SPAIN MARKET ANALYSIS BY DRUG
      26. | 6.26 SPAIN MARKET ANALYSIS BY APPLICATION TYPE
      27. | 6.27 SPAIN MARKET ANALYSIS BY DISTRIBUTION CHANNEL
      28. | 6.28 REST OF EUROPE MARKET ANALYSIS BY DRUG
      29. | 6.29 REST OF EUROPE MARKET ANALYSIS BY APPLICATION TYPE
      30. | 6.30 REST OF EUROPE MARKET ANALYSIS BY DISTRIBUTION CHANNEL
      31. | 6.31 APAC MARKET ANALYSIS
      32. | 6.32 CHINA MARKET ANALYSIS BY DRUG
      33. | 6.33 CHINA MARKET ANALYSIS BY APPLICATION TYPE
      34. | 6.34 CHINA MARKET ANALYSIS BY DISTRIBUTION CHANNEL
      35. | 6.35 INDIA MARKET ANALYSIS BY DRUG
      36. | 6.36 INDIA MARKET ANALYSIS BY APPLICATION TYPE
      37. | 6.37 INDIA MARKET ANALYSIS BY DISTRIBUTION CHANNEL
      38. | 6.38 JAPAN MARKET ANALYSIS BY DRUG
      39. | 6.39 JAPAN MARKET ANALYSIS BY APPLICATION TYPE
      40. | 6.40 JAPAN MARKET ANALYSIS BY DISTRIBUTION CHANNEL
      41. | 6.41 SOUTH KOREA MARKET ANALYSIS BY DRUG
      42. | 6.42 SOUTH KOREA MARKET ANALYSIS BY APPLICATION TYPE
      43. | 6.43 SOUTH KOREA MARKET ANALYSIS BY DISTRIBUTION CHANNEL
      44. | 6.44 MALAYSIA MARKET ANALYSIS BY DRUG
      45. | 6.45 MALAYSIA MARKET ANALYSIS BY APPLICATION TYPE
      46. | 6.46 MALAYSIA MARKET ANALYSIS BY DISTRIBUTION CHANNEL
      47. | 6.47 THAILAND MARKET ANALYSIS BY DRUG
      48. | 6.48 THAILAND MARKET ANALYSIS BY APPLICATION TYPE
      49. | 6.49 THAILAND MARKET ANALYSIS BY DISTRIBUTION CHANNEL
      50. | 6.50 INDONESIA MARKET ANALYSIS BY DRUG
      51. | 6.51 INDONESIA MARKET ANALYSIS BY APPLICATION TYPE
      52. | 6.52 INDONESIA MARKET ANALYSIS BY DISTRIBUTION CHANNEL
      53. | 6.53 REST OF APAC MARKET ANALYSIS BY DRUG
      54. | 6.54 REST OF APAC MARKET ANALYSIS BY APPLICATION TYPE
      55. | 6.55 REST OF APAC MARKET ANALYSIS BY DISTRIBUTION CHANNEL
      56. | 6.56 SOUTH AMERICA MARKET ANALYSIS
      57. | 6.57 BRAZIL MARKET ANALYSIS BY DRUG
      58. | 6.58 BRAZIL MARKET ANALYSIS BY APPLICATION TYPE
      59. | 6.59 BRAZIL MARKET ANALYSIS BY DISTRIBUTION CHANNEL
      60. | 6.60 MEXICO MARKET ANALYSIS BY DRUG
      61. | 6.61 MEXICO MARKET ANALYSIS BY APPLICATION TYPE
      62. | 6.62 MEXICO MARKET ANALYSIS BY DISTRIBUTION CHANNEL
      63. | 6.63 ARGENTINA MARKET ANALYSIS BY DRUG
      64. | 6.64 ARGENTINA MARKET ANALYSIS BY APPLICATION TYPE
      65. | 6.65 ARGENTINA MARKET ANALYSIS BY DISTRIBUTION CHANNEL
      66. | 6.66 REST OF SOUTH AMERICA MARKET ANALYSIS BY DRUG
      67. | 6.67 REST OF SOUTH AMERICA MARKET ANALYSIS BY APPLICATION TYPE
      68. | 6.68 REST OF SOUTH AMERICA MARKET ANALYSIS BY DISTRIBUTION CHANNEL
      69. | 6.69 MEA MARKET ANALYSIS
      70. | 6.70 GCC COUNTRIES MARKET ANALYSIS BY DRUG
      71. | 6.71 GCC COUNTRIES MARKET ANALYSIS BY APPLICATION TYPE
      72. | 6.72 GCC COUNTRIES MARKET ANALYSIS BY DISTRIBUTION CHANNEL
      73. | 6.73 SOUTH AFRICA MARKET ANALYSIS BY DRUG
      74. | 6.74 SOUTH AFRICA MARKET ANALYSIS BY APPLICATION TYPE
      75. | 6.75 SOUTH AFRICA MARKET ANALYSIS BY DISTRIBUTION CHANNEL
      76. | 6.76 REST OF MEA MARKET ANALYSIS BY DRUG
      77. | 6.77 REST OF MEA MARKET ANALYSIS BY APPLICATION TYPE
      78. | 6.78 REST OF MEA MARKET ANALYSIS BY DISTRIBUTION CHANNEL
      79. | 6.79 KEY BUYING CRITERIA OF HEALTHCARE
      80. | 6.80 RESEARCH PROCESS OF MRFR
      81. | 6.81 DRO ANALYSIS OF HEALTHCARE
      82. | 6.82 DRIVERS IMPACT ANALYSIS: HEALTHCARE
      83. | 6.83 RESTRAINTS IMPACT ANALYSIS: HEALTHCARE
      84. | 6.84 SUPPLY / VALUE CHAIN: HEALTHCARE
      85. | 6.85 HEALTHCARE, BY DRUG, 2024 (% SHARE)
      86. | 6.86 HEALTHCARE, BY DRUG, 2024 TO 2035 (USD Billion)
      87. | 6.87 HEALTHCARE, BY APPLICATION TYPE, 2024 (% SHARE)
      88. | 6.88 HEALTHCARE, BY APPLICATION TYPE, 2024 TO 2035 (USD Billion)
      89. | 6.89 HEALTHCARE, BY DISTRIBUTION CHANNEL, 2024 (% SHARE)
      90. | 6.90 HEALTHCARE, BY DISTRIBUTION CHANNEL, 2024 TO 2035 (USD Billion)
      91. | 6.91 BENCHMARKING OF MAJOR COMPETITORS
    7. LIST OF TABLES
      1. | 7.1 LIST OF ASSUMPTIONS
      2. | | 7.1.1
      3. | 7.2 North America MARKET SIZE ESTIMATES; FORECAST
      4. | | 7.2.1 BY DRUG, 2025-2035 (USD Billion)
      5. | | 7.2.2 BY APPLICATION TYPE, 2025-2035 (USD Billion)
      6. | | 7.2.3 BY DISTRIBUTION CHANNEL, 2025-2035 (USD Billion)
      7. | 7.3 US MARKET SIZE ESTIMATES; FORECAST
      8. | | 7.3.1 BY DRUG, 2025-2035 (USD Billion)
      9. | | 7.3.2 BY APPLICATION TYPE, 2025-2035 (USD Billion)
      10. | | 7.3.3 BY DISTRIBUTION CHANNEL, 2025-2035 (USD Billion)
      11. | 7.4 Canada MARKET SIZE ESTIMATES; FORECAST
      12. | | 7.4.1 BY DRUG, 2025-2035 (USD Billion)
      13. | | 7.4.2 BY APPLICATION TYPE, 2025-2035 (USD Billion)
      14. | | 7.4.3 BY DISTRIBUTION CHANNEL, 2025-2035 (USD Billion)
      15. | 7.5 Europe MARKET SIZE ESTIMATES; FORECAST
      16. | | 7.5.1 BY DRUG, 2025-2035 (USD Billion)
      17. | | 7.5.2 BY APPLICATION TYPE, 2025-2035 (USD Billion)
      18. | | 7.5.3 BY DISTRIBUTION CHANNEL, 2025-2035 (USD Billion)
      19. | 7.6 Germany MARKET SIZE ESTIMATES; FORECAST
      20. | | 7.6.1 BY DRUG, 2025-2035 (USD Billion)
      21. | | 7.6.2 BY APPLICATION TYPE, 2025-2035 (USD Billion)
      22. | | 7.6.3 BY DISTRIBUTION CHANNEL, 2025-2035 (USD Billion)
      23. | 7.7 UK MARKET SIZE ESTIMATES; FORECAST
      24. | | 7.7.1 BY DRUG, 2025-2035 (USD Billion)
      25. | | 7.7.2 BY APPLICATION TYPE, 2025-2035 (USD Billion)
      26. | | 7.7.3 BY DISTRIBUTION CHANNEL, 2025-2035 (USD Billion)
      27. | 7.8 France MARKET SIZE ESTIMATES; FORECAST
      28. | | 7.8.1 BY DRUG, 2025-2035 (USD Billion)
      29. | | 7.8.2 BY APPLICATION TYPE, 2025-2035 (USD Billion)
      30. | | 7.8.3 BY DISTRIBUTION CHANNEL, 2025-2035 (USD Billion)
      31. | 7.9 Russia MARKET SIZE ESTIMATES; FORECAST
      32. | | 7.9.1 BY DRUG, 2025-2035 (USD Billion)
      33. | | 7.9.2 BY APPLICATION TYPE, 2025-2035 (USD Billion)
      34. | | 7.9.3 BY DISTRIBUTION CHANNEL, 2025-2035 (USD Billion)
      35. | 7.10 Italy MARKET SIZE ESTIMATES; FORECAST
      36. | | 7.10.1 BY DRUG, 2025-2035 (USD Billion)
      37. | | 7.10.2 BY APPLICATION TYPE, 2025-2035 (USD Billion)
      38. | | 7.10.3 BY DISTRIBUTION CHANNEL, 2025-2035 (USD Billion)
      39. | 7.11 Spain MARKET SIZE ESTIMATES; FORECAST
      40. | | 7.11.1 BY DRUG, 2025-2035 (USD Billion)
      41. | | 7.11.2 BY APPLICATION TYPE, 2025-2035 (USD Billion)
      42. | | 7.11.3 BY DISTRIBUTION CHANNEL, 2025-2035 (USD Billion)
      43. | 7.12 Rest of Europe MARKET SIZE ESTIMATES; FORECAST
      44. | | 7.12.1 BY DRUG, 2025-2035 (USD Billion)
      45. | | 7.12.2 BY APPLICATION TYPE, 2025-2035 (USD Billion)
      46. | | 7.12.3 BY DISTRIBUTION CHANNEL, 2025-2035 (USD Billion)
      47. | 7.13 APAC MARKET SIZE ESTIMATES; FORECAST
      48. | | 7.13.1 BY DRUG, 2025-2035 (USD Billion)
      49. | | 7.13.2 BY APPLICATION TYPE, 2025-2035 (USD Billion)
      50. | | 7.13.3 BY DISTRIBUTION CHANNEL, 2025-2035 (USD Billion)
      51. | 7.14 China MARKET SIZE ESTIMATES; FORECAST
      52. | | 7.14.1 BY DRUG, 2025-2035 (USD Billion)
      53. | | 7.14.2 BY APPLICATION TYPE, 2025-2035 (USD Billion)
      54. | | 7.14.3 BY DISTRIBUTION CHANNEL, 2025-2035 (USD Billion)
      55. | 7.15 India MARKET SIZE ESTIMATES; FORECAST
      56. | | 7.15.1 BY DRUG, 2025-2035 (USD Billion)
      57. | | 7.15.2 BY APPLICATION TYPE, 2025-2035 (USD Billion)
      58. | | 7.15.3 BY DISTRIBUTION CHANNEL, 2025-2035 (USD Billion)
      59. | 7.16 Japan MARKET SIZE ESTIMATES; FORECAST
      60. | | 7.16.1 BY DRUG, 2025-2035 (USD Billion)
      61. | | 7.16.2 BY APPLICATION TYPE, 2025-2035 (USD Billion)
      62. | | 7.16.3 BY DISTRIBUTION CHANNEL, 2025-2035 (USD Billion)
      63. | 7.17 South Korea MARKET SIZE ESTIMATES; FORECAST
      64. | | 7.17.1 BY DRUG, 2025-2035 (USD Billion)
      65. | | 7.17.2 BY APPLICATION TYPE, 2025-2035 (USD Billion)
      66. | | 7.17.3 BY DISTRIBUTION CHANNEL, 2025-2035 (USD Billion)
      67. | 7.18 Malaysia MARKET SIZE ESTIMATES; FORECAST
      68. | | 7.18.1 BY DRUG, 2025-2035 (USD Billion)
      69. | | 7.18.2 BY APPLICATION TYPE, 2025-2035 (USD Billion)
      70. | | 7.18.3 BY DISTRIBUTION CHANNEL, 2025-2035 (USD Billion)
      71. | 7.19 Thailand MARKET SIZE ESTIMATES; FORECAST
      72. | | 7.19.1 BY DRUG, 2025-2035 (USD Billion)
      73. | | 7.19.2 BY APPLICATION TYPE, 2025-2035 (USD Billion)
      74. | | 7.19.3 BY DISTRIBUTION CHANNEL, 2025-2035 (USD Billion)
      75. | 7.20 Indonesia MARKET SIZE ESTIMATES; FORECAST
      76. | | 7.20.1 BY DRUG, 2025-2035 (USD Billion)
      77. | | 7.20.2 BY APPLICATION TYPE, 2025-2035 (USD Billion)
      78. | | 7.20.3 BY DISTRIBUTION CHANNEL, 2025-2035 (USD Billion)
      79. | 7.21 Rest of APAC MARKET SIZE ESTIMATES; FORECAST
      80. | | 7.21.1 BY DRUG, 2025-2035 (USD Billion)
      81. | | 7.21.2 BY APPLICATION TYPE, 2025-2035 (USD Billion)
      82. | | 7.21.3 BY DISTRIBUTION CHANNEL, 2025-2035 (USD Billion)
      83. | 7.22 South America MARKET SIZE ESTIMATES; FORECAST
      84. | | 7.22.1 BY DRUG, 2025-2035 (USD Billion)
      85. | | 7.22.2 BY APPLICATION TYPE, 2025-2035 (USD Billion)
      86. | | 7.22.3 BY DISTRIBUTION CHANNEL, 2025-2035 (USD Billion)
      87. | 7.23 Brazil MARKET SIZE ESTIMATES; FORECAST
      88. | | 7.23.1 BY DRUG, 2025-2035 (USD Billion)
      89. | | 7.23.2 BY APPLICATION TYPE, 2025-2035 (USD Billion)
      90. | | 7.23.3 BY DISTRIBUTION CHANNEL, 2025-2035 (USD Billion)
      91. | 7.24 Mexico MARKET SIZE ESTIMATES; FORECAST
      92. | | 7.24.1 BY DRUG, 2025-2035 (USD Billion)
      93. | | 7.24.2 BY APPLICATION TYPE, 2025-2035 (USD Billion)
      94. | | 7.24.3 BY DISTRIBUTION CHANNEL, 2025-2035 (USD Billion)
      95. | 7.25 Argentina MARKET SIZE ESTIMATES; FORECAST
      96. | | 7.25.1 BY DRUG, 2025-2035 (USD Billion)
      97. | | 7.25.2 BY APPLICATION TYPE, 2025-2035 (USD Billion)
      98. | | 7.25.3 BY DISTRIBUTION CHANNEL, 2025-2035 (USD Billion)
      99. | 7.26 Rest of South America MARKET SIZE ESTIMATES; FORECAST
      100. | | 7.26.1 BY DRUG, 2025-2035 (USD Billion)
      101. | | 7.26.2 BY APPLICATION TYPE, 2025-2035 (USD Billion)
      102. | | 7.26.3 BY DISTRIBUTION CHANNEL, 2025-2035 (USD Billion)
      103. | 7.27 MEA MARKET SIZE ESTIMATES; FORECAST
      104. | | 7.27.1 BY DRUG, 2025-2035 (USD Billion)
      105. | | 7.27.2 BY APPLICATION TYPE, 2025-2035 (USD Billion)
      106. | | 7.27.3 BY DISTRIBUTION CHANNEL, 2025-2035 (USD Billion)
      107. | 7.28 GCC Countries MARKET SIZE ESTIMATES; FORECAST
      108. | | 7.28.1 BY DRUG, 2025-2035 (USD Billion)
      109. | | 7.28.2 BY APPLICATION TYPE, 2025-2035 (USD Billion)
      110. | | 7.28.3 BY DISTRIBUTION CHANNEL, 2025-2035 (USD Billion)
      111. | 7.29 South Africa MARKET SIZE ESTIMATES; FORECAST
      112. | | 7.29.1 BY DRUG, 2025-2035 (USD Billion)
      113. | | 7.29.2 BY APPLICATION TYPE, 2025-2035 (USD Billion)
      114. | | 7.29.3 BY DISTRIBUTION CHANNEL, 2025-2035 (USD Billion)
      115. | 7.30 Rest of MEA MARKET SIZE ESTIMATES; FORECAST
      116. | | 7.30.1 BY DRUG, 2025-2035 (USD Billion)
      117. | | 7.30.2 BY APPLICATION TYPE, 2025-2035 (USD Billion)
      118. | | 7.30.3 BY DISTRIBUTION CHANNEL, 2025-2035 (USD Billion)
      119. | 7.31 PRODUCT LAUNCH/PRODUCT DEVELOPMENT/APPROVAL
      120. | | 7.31.1
      121. | 7.32 ACQUISITION/PARTNERSHIP
      122. | | 7.32.1

    Market Segmentation

    Omega 3 Prescription Drugs Outlook (USD Billion, 2018-2032)

    • Vascepa
    • Lovaza
    • Others

    Omega 3 Prescription Drugs Application Outlook (USD Billion, 2018-2032)

    • Hypertriglyceridemia
    • Others

    Omega 3 Prescription Drugs Distribution Channel Outlook (USD Billion, 2018-2032)

    • Hospital Pharmacy
    • Retail Pharmacy
    • Online Pharmacy

    Omega 3 Prescription Drugs Regional Outlook (USD Billion, 2018-2032)

    • North America Outlook (USD Billion, 2018-2032)

      • Omega 3 Prescription Drugs By Drug

        • Vascepa
        • Lovaza
        • Others
      • Omega 3 Prescription Drugs By Application

        • Hypertriglyceridemia
        • Others
      • Omega 3 Prescription Drugs By Distribution Channel

        • Hospital Pharmacy
        • Retail Pharmacy
        • Online Pharmacy
      • US Outlook (USD Billion, 2018-2032)

      • Omega 3 Prescription Drugs By Drug

        • Vascepa
        • Lovaza
        • Others
      • Omega 3 Prescription Drugs By Application

        • Hypertriglyceridemia
        • Others
      • Omega 3 Prescription Drugs By Distribution Channel

        • Hospital Pharmacy
        • Retail Pharmacy
        • Online Pharmacy
      • Canada Outlook (USD Billion, 2018-2032)

      • Omega 3 Prescription Drugs By Drug

        • Vascepa
        • Lovaza
        • Others
      • Omega 3 Prescription Drugs By Application

        • Hypertriglyceridemia
        • Others
      • Omega 3 Prescription Drugs By Distribution Channel

        • Hospital Pharmacy
        • Retail Pharmacy
        • Online Pharmacy
    • Europe Outlook (USD Billion, 2018-2032)

      • Omega 3 Prescription Drugs By Drug

        • Vascepa
        • Lovaza
        • Others
      • Omega 3 Prescription Drugs By Application

        • Hypertriglyceridemia
        • Others
      • Omega 3 Prescription Drugs By Distribution Channel

        • Hospital Pharmacy
        • Retail Pharmacy
        • Online Pharmacy
      • Germany Outlook (USD Billion, 2018-2032)

      • Omega 3 Prescription Drugs By Drug

        • Vascepa
        • Lovaza
        • Others
      • Omega 3 Prescription Drugs By Application

        • Hypertriglyceridemia
        • Others
      • Omega 3 Prescription Drugs By Distribution Channel

        • Hospital Pharmacy
        • Retail Pharmacy
        • Online Pharmacy
      • France Outlook (USD Billion, 2018-2032)

      • Omega 3 Prescription Drugs By Drug

        • Vascepa
        • Lovaza
        • Others
      • Omega 3 Prescription Drugs By Application

        • Hypertriglyceridemia
        • Others
      • Omega 3 Prescription Drugs By Distribution Channel

        • Hospital Pharmacy
        • Retail Pharmacy
        • Online Pharmacy
      • UK Outlook (USD Billion, 2018-2032)

      • Omega 3 Prescription Drugs By Drug

        • Vascepa
        • Lovaza
        • Others
      • Omega 3 Prescription Drugs By Application

        • Hypertriglyceridemia
        • Others
      • Omega 3 Prescription Drugs By Distribution Channel

        • Hospital Pharmacy
        • Retail Pharmacy
        • Online Pharmacy
      • Italy Outlook (USD Billion, 2018-2032)

      • Omega 3 Prescription Drugs By Drug

        • Vascepa
        • Lovaza
        • Others
      • Omega 3 Prescription Drugs By Application

        • Hypertriglyceridemia
        • Others
      • Omega 3 Prescription Drugs By Distribution Channel

        • Hospital Pharmacy
        • Retail Pharmacy
        • Online Pharmacy
      • Spain Outlook (USD Billion, 2018-2032)

      • Omega 3 Prescription Drugs By Drug

        • Vascepa
        • Lovaza
        • Others
      • Omega 3 Prescription Drugs By Application

        • Hypertriglyceridemia
        • Others
      • Omega 3 Prescription Drugs By Distribution Channel

        • Hospital Pharmacy
        • Retail Pharmacy
        • Online Pharmacy
      • Rest Of Europe Outlook (USD Billion, 2018-2032)

      • Omega 3 Prescription Drugs By Drug

        • Vascepa
        • Lovaza
        • Others
      • Omega 3 Prescription Drugs By Application

        • Hypertriglyceridemia
        • Others
      • Omega 3 Prescription Drugs By Distribution Channel

        • Hospital Pharmacy
        • Retail Pharmacy
        • Online Pharmacy
    • Asia-Pacific Outlook (USD Billion, 2018-2032)

      • Omega 3 Prescription Drugs By Drug

        • Vascepa
        • Lovaza
        • Others
      • Omega 3 Prescription Drugs By Application

        • Hypertriglyceridemia
        • Others
      • Omega 3 Prescription Drugs By Distribution Channel

        • Hospital Pharmacy
        • Retail Pharmacy
        • Online Pharmacy
      • China Outlook (USD Billion, 2018-2032)

      • Omega 3 Prescription Drugs By Drug

        • Vascepa
        • Lovaza
        • Others
      • Omega 3 Prescription Drugs By Application

        • Hypertriglyceridemia
        • Others
      • Omega 3 Prescription Drugs By Distribution Channel

        • Hospital Pharmacy
        • Retail Pharmacy
        • Online Pharmacy
      • Japan Outlook (USD Billion, 2018-2032)

      • Omega 3 Prescription Drugs By Drug

        • Vascepa
        • Lovaza
        • Others
      • Omega 3 Prescription Drugs By Application

        • Hypertriglyceridemia
        • Others
      • Omega 3 Prescription Drugs By Distribution Channel

        • Hospital Pharmacy
        • Retail Pharmacy
        • Online Pharmacy
      • India Outlook (USD Billion, 2018-2032)

      • Omega 3 Prescription Drugs By Drug

        • Vascepa
        • Lovaza
        • Others
      • Omega 3 Prescription Drugs By Application

        • Hypertriglyceridemia
        • Others
      • Omega 3 Prescription Drugs By Distribution Channel

        • Hospital Pharmacy
        • Retail Pharmacy
        • Online Pharmacy
      • Australia Outlook (USD Billion, 2018-2032)

      • Omega 3 Prescription Drugs By Drug

        • Vascepa
        • Lovaza
        • Others
      • Omega 3 Prescription Drugs By Application

        • Hypertriglyceridemia
        • Others
      • Omega 3 Prescription Drugs By Distribution Channel

        • Hospital Pharmacy
        • Retail Pharmacy
        • Online Pharmacy
      • Rest of Asia-Pacific Outlook (USD Billion, 2018-2032)

      • Omega 3 Prescription Drugs By Drug

        • Vascepa
        • Lovaza
        • Others
      • Omega 3 Prescription Drugs By Application

        • Hypertriglyceridemia
        • Others
      • Omega 3 Prescription Drugs By Distribution Channel

        • Hospital Pharmacy
        • Retail Pharmacy
        • Online Pharmacy
    • Rest of the World Outlook (USD Billion, 2018-2032)

      • Omega 3 Prescription Drugs By Drug

        • Vascepa
        • Lovaza
        • Others
      • Omega 3 Prescription Drugs By Application

        • Hypertriglyceridemia
        • Others
      • Omega 3 Prescription Drugs By Distribution Channel

        • Hospital Pharmacy
        • Retail Pharmacy
        • Online Pharmacy
      • Middle East Outlook (USD Billion, 2018-2032)

      • Omega 3 Prescription Drugs By Drug

        • Vascepa
        • Lovaza
        • Others
      • Omega 3 Prescription Drugs By Application

        • Hypertriglyceridemia
        • Others
      • Omega 3 Prescription Drugs By Distribution Channel

        • Hospital Pharmacy
        • Retail Pharmacy
        • Online Pharmacy
      • Africa Outlook (USD Billion, 2018-2032)

      • Omega 3 Prescription Drugs By Drug

        • Vascepa
        • Lovaza
        • Others
      • Omega 3 Prescription Drugs By Application

        • Hypertriglyceridemia
        • Others
      • Omega 3 Prescription Drugs By Distribution Channel

        • Hospital Pharmacy
        • Retail Pharmacy
        • Online Pharmacy
      • Latin America Outlook (USD Billion, 2018-2032)

      • Omega 3 Prescription Drugs By Drug

        • Vascepa
        • Lovaza
        • Others
      • Omega 3 Prescription Drugs By Application

        • Hypertriglyceridemia
        • Others
      • Omega 3 Prescription Drugs By Distribution Channel

        • Hospital Pharmacy
        • Retail Pharmacy
        • Online Pharmacy
    Infographic

    Free Sample Request

    Kindly complete the form below to receive a free sample of this Report

    Get Free Sample

    Customer Strories

    “I am very pleased with how market segments have been defined in a relevant way for my purposes (such as "Portable Freezers & refrigerators" and "last-mile"). In general the report is well structured. Thanks very much for your efforts.”

    Victoria Milne

    Founder
    Case Study
    Chemicals and Materials

    Compare Licence

    ×
    Features License Type
    Single User Multiuser License Enterprise User
    Price $4,950 $5,950 $7,250
    Maximum User Access Limit 1 User Upto 10 Users Unrestricted Access Throughout the Organization
    Free Customization
    Direct Access to Analyst
    Deliverable Format
    Platform Access
    Discount on Next Purchase 10% 15% 15%
    Printable Versions