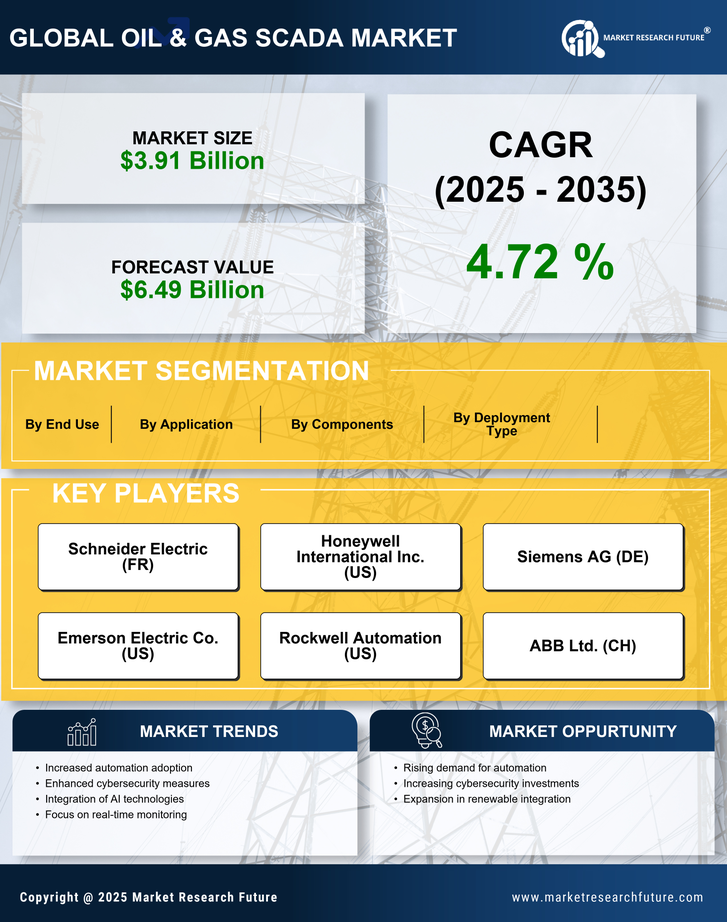
Certified Global Research Member
Isomar fd.webp Wcrc 57.webp
Key Questions Answered
  • Global Market Outlook
  • In-depth analysis of global and regional trends
  • Analyze and identify the major players in the market, their market share, key developments, etc.
  • To understand the capability of the major players based on products offered, financials, and strategies.
  • Identify disrupting products, companies, and trends.
  • To identify opportunities in the market.
  • Analyze the key challenges in the market.
  • Analyze the regional penetration of players, products, and services in the market.
  • Comparison of major playersโ€™ financial performance.
  • Evaluate strategies adopted by major players.
  • Recommendations
Why Choose Market Research Future?
  • Vigorous research methodologies for specific market.
  • Knowledge partners across the globe
  • Large network of partner consultants.
  • Ever-increasing/ Escalating data base with quarterly monitoring of various markets
  • Trusted by fortune 500 companies/startups/ universities/organizations
  • Large database of 5000+ markets reports.
  • Effective and prompt pre- and post-sales support.

Oil & Gas SCADA Market Research Report By Architecture (Hardware, Software and Services), By Sector (Upstream, Midstream and Downstream) and By Region (Asia-Pacific, North America, Europe and the Middle East & Africa) - Industry Forecast till 2032


ID: MRFR/SEM/6453-HCR | 111 Pages | Author: Anshula Mandaokar| April 2024
Leading companies partner with us for data-driven Insights
client_1 client_2 client_3 client_4 client_5 client_6 client_7 client_8 client_9 client_10
Please fill in Business Email for Quick Response

Table of Contents

1 Executive Summary

2 Market Introduction

2.1 Market Definition

2.2 Scope of the Study

2.3 Market Structure

3 Research Methodology

3.1 Primary Research

3.2 Secondary Research

3.3 Market Size Estimation

3.4 Forecast Model

3.5 List of Assumptions

3.6 Limitations of the Study

4 Market Insights

5 Market Dynamics

5.1 Introduction

5.2 Market Drivers

5.3 Market Restraints

5.4 Market Opportunities

5.5 Value Chain/Supply Chain Analysis

5.6 Porterโ€™s Five Forces Analysis

5.6.1 Threat of New Entrants

5.6.2 Bargaining Power of Buyers

5.6.3 Bargaining Power of Suppliers

5.6.4 Threat of Substitutes

5.6.5 Competitive Rivalry

6 Global Oil & Gas SCADA Market, by Architecture

6.1 Introduction

6.2 Hardware

6.2.1 Market Estimates & Forecast, 2024โ€“2032

6.2.2 Market Estimates & Forecast, by Region/Country, 2024โ€“2032

6.3 Software

6.3.1 Market Estimates & Forecast, 2024โ€“2032

6.3.2 Market Estimates & Forecast, by Region/Country, 2024โ€“2032

6.3.3 Cloud-Based Solutions

6.3.3.1 Market Estimates & Forecast, 2024โ€“2032

6.3.3.2 Market Estimates & Forecast, by Region/Country, 2024โ€“2032

6.3.4 Other Software Solutions

6.3.4.1 Market Estimates & Forecast, 2024โ€“2032

6.3.4.2 Market Estimates & Forecast, by Region/Country, 2024โ€“2032

6.4 Services

6.4.1 Market Estimates & Forecast, 2024โ€“2032

6.4.2 Market Estimates & Forecast, by Region/Country, 2024โ€“2032

7 Global Oil & Gas SCADA Market, by Sector

7.1 Introduction

7.2 Upstream

7.2.1 Market Estimates & Forecast, 2024โ€“2032

7.2.2 Market Estimates & Forecast, by Region/Country, 2024โ€“2032

7.3 Midstream

7.3.1 Market Estimates & Forecast, 2024โ€“2032

7.3.2 Market Estimates & Forecast, by Region/Country, 2024โ€“2032

7.4 Downstream

7.4.1 Market Estimates & Forecast, 2024โ€“2032

7.4.2 Market Estimates & Forecast, by Region/Country, 2024โ€“2032

8 Global Oil & Gas SCADA Market, by Region

8.1 Introduction

8.2 North America

8.2.1 Market Estimates & Forecast, by Architecture, 2024โ€“2032

8.2.2 Market Estimates & Forecast, by Sector, 2024โ€“2032

8.2.3 Market Estimates & Forecast, by Country, 2024โ€“2032

8.2.4 US

8.2.4.1 Market Estimates & Forecast, by Architecture, 2024โ€“2032

8.2.4.2 Market Estimates & Forecast, by Sector, 2024โ€“2032

8.2.5 Canada

8.2.5.1 Market Estimates & Forecast, by Architecture, 2024โ€“2032

8.2.5.2 Market Estimates & Forecast, by Sector, 2024โ€“2032

8.2.6 Mexico

8.2.6.1 Market Estimates & Forecast, by Architecture, 2024โ€“2032

8.2.6.2 Market Estimates & Forecast, by Sector, 2024โ€“2032

8.3 Europe

8.3.1 Market Estimates & Forecast, by Architecture, 2024โ€“2032

8.3.2 Market Estimates & Forecast, by Sector, 2024โ€“2032

8.3.3 Market Estimates & Forecast, by Country, 2024โ€“2032

8.3.4 Russia

8.3.4.1 Market Estimates & Forecast, by Architecture, 2024โ€“2032

8.3.4.2 Market Estimates & Forecast, by Sector, 2024โ€“2032

8.3.5 Germany

8.3.5.1 Market Estimates & Forecast, by Architecture, 2024โ€“2032

8.3.5.2 Market Estimates & Forecast, by Sector, 2024โ€“2032

8.3.6 UK

8.3.6.1 Market Estimates & Forecast, by Architecture, 2024โ€“2032

8.3.6.2 Market Estimates & Forecast, by Sector, 2024โ€“2032

8.3.7 Italy

8.3.7.1 Market Estimates & Forecast, by Architecture, 2024โ€“2032

8.3.7.2 Market Estimates & Forecast, by Sector, 2024โ€“2032

8.3.8 Rest of Europe

8.3.8.1 Market Estimates & Forecast, by Architecture, 2024โ€“2032

8.3.8.2 Market Estimates & Forecast, by Sector, 2024โ€“2032

8.4 Asia-Pacific

8.4.1 Market Estimates & Forecast, by Architecture, 2024โ€“2032

8.4.2 Market Estimates & Forecast, by Sector, 2024โ€“2032

8.4.3 Market Estimates & Forecast, by Country, 2024โ€“2032

8.4.4 China

8.4.4.1 Market Estimates & Forecast, by Architecture, 2024โ€“2032

8.4.4.2 Market Estimates & Forecast, by Sector, 2024โ€“2032

8.4.5 India

8.4.5.1 Market Estimates & Forecast, by Architecture, 2024โ€“2032

8.4.5.2 Market Estimates & Forecast, by Sector, 2024โ€“2032

8.4.6 Australia

8.4.6.1 Market Estimates & Forecast, by Architecture, 2024โ€“2032

8.4.6.2 Market Estimates & Forecast, by Sector, 2024โ€“2032

8.4.7 Japan

8.4.7.1 Market Estimates & Forecast, by Architecture, 2024โ€“2032

8.4.7.2 Market Estimates & Forecast, by Sector, 2024โ€“2032

8.4.8 Rest of Asia-Pacific

8.4.8.1 Market Estimates & Forecast, by Architecture, 2024โ€“2032

8.4.8.2 Market Estimates & Forecast, by Sector, 2024โ€“2032

8.5 Middle East & Africa

8.5.1 Market Estimates & Forecast, by Architecture, 2024โ€“2032

8.5.2 Market Estimates & Forecast, by Sector, 2024โ€“2032

8.5.3 Market Estimates & Forecast, by Country, 2024โ€“2032

8.5.4 Saudi Arabia

8.5.4.1 Market Estimates & Forecast, by Architecture, 2024โ€“2032

8.5.4.2 Market Estimates & Forecast, by Sector, 2024โ€“2032

8.5.5 UAE

8.5.5.1 Market Estimates & Forecast, by Architecture, 2024โ€“2032

8.5.5.2 Market Estimates & Forecast, by Sector, 2024โ€“2032

8.5.6 South Africa

8.5.6.1 Market Estimates & Forecast, by Architecture, 2024โ€“2032

8.5.6.2 Market Estimates & Forecast, by Sector, 2024โ€“2032

8.5.7 Rest of the Middle East & Africa

8.5.7.1 Market Estimates & Forecast, by Architecture, 2024โ€“2032

8.5.7.2 Market Estimates & Forecast, by Sector, 2024โ€“2032

8.6 South America

8.6.1 Market Estimates & Forecast, by Architecture, 2024โ€“2032

8.6.2 Market Estimates & Forecast, by Sector, 2024โ€“2032

8.6.3 Market Estimates & Forecast, by Country, 2024โ€“2032

8.6.4 Brazil

8.6.4.1 Market Estimates & Forecast, by Architecture, 2024โ€“2032

8.6.4.2 Market Estimates & Forecast, by Sector, 2024โ€“2032

8.6.5 Argentina

8.6.5.1 Market Estimates & Forecast, by Architecture, 2024โ€“2032

8.6.5.2 Market Estimates & Forecast, by Sector, 2024โ€“2032

8.6.6 Rest of South America

8.6.6.1 Market Estimates & Forecast, by Architecture, 2024โ€“2032

8.6.6.2 Market Estimates & Forecast, by Sector, 2024โ€“2032

9 Competitive Landscape

9.1 Competitive Scenario

9.2 Competitive Benchmarking of the Global Oil & Gas SCADA Market

9.3 Major Growth Key Strategies in the Global Oil & Gas SCADA Market

9.4 Market Share Analysis: Global Oil & Gas SCADA Market

9.5 ABB: The Leading Player in Terms of Number of Developments in the Global Oil & Gas SCADA Market

9.6 Product Development

9.7 Mergers & Acquisitions

9.8 Contracts & Agreements

9.9 Expansions & Investments

10 Company Profile

10.1 ABB (Switzerland)

10.1.1 Company Overview

10.1.2 Product/Services Offered

10.1.3 Financial Overview

10.1.4 Key Developments

10.1.5 Key Strategies

10.1.6 SWOT Analysis

10.2 General Electric (US)

10.2.1 Company Overview

10.2.2 Product/Services Offered

10.2.3 Financial Overview

10.2.4 Key Developments

10.2.5 Key Strategies

10.2.6 SWOT Analysis

10.3 Schneider Electric SE (France)

10.3.1 Company Overview

10.3.2 Product/Services Offered

10.3.3 Financial Overview

10.3.4 Key Developments

10.3.5 Key Strategies

10.3.6 SWOT Analysis

10.4 Siemens (Germany)

10.4.1 Company Overview

10.4.2 Product/Services Offered

10.4.3 Financial Overview

10.4.4 Key Developments

10.4.5 Key Strategies

10.4.6 SWOT Analysis

10.5 Rockwell Automation, Inc. (US)

10.5.1 Company Overview

10.5.2 Product/Services Offered

10.5.3 Financial Overview

10.5.4 Key Developments

10.5.5 Key Strategies

10.5.6 SWOT Analysis

10.6 Larsen & Toubro Limited (India)

10.6.1 Company Overview

10.6.2 Product/Services Offered

10.6.3 Financial Overview

10.6.4 Key Developments

10.6.5 Key Strategies

10.6.6 SWOT Analysis

10.7 Mitsubishi Electric Corporation (Japan)

10.7.1 Company Overview

10.7.2 Product/Services Offered

10.7.3 Financial Overview

10.7.4 Key Developments

10.7.5 Key Strategies

10.7.6 SWOT Analysis

10.8 Yokogawa Electric Corporation (Japan)

10.8.1 Company Overview

10.8.2 Product/Services Offered

10.8.3 Financial Overview

10.8.4 Key Developments

10.8.5 Key Strategies

10.8.6 SWOT Analysis

10.9 Emerson Electric Co. (US)

10.9.1 Company Overview

10.9.2 Product/Services Offered

10.9.3 Financial Overview

10.9.4 Key Developments

10.9.5 Key Strategies

10.9.6 SWOT Analysis

10.10 Honeywell International Inc. (US)

10.10.1 Company Overview

10.10.2 Product/Services Offered

10.10.3 Financial Overview

10.10.4 Key Developments

10.10.5 Key Strategies

10.10.6 SWOT Analysis

10.11 PSI AG (Germany)

10.11.1 Company Overview

10.11.2 Product/Services Offered

10.11.3 Financial Overview

10.11.4 Key Developments

10.11.5 Key Strategies

10.11.6 SWOT Analysis

10.12 Technipfmc, Plc (UK)

10.12.1 Company Overview

10.12.2 Product/Services Offered

10.12.3 Financial Overview

10.12.4 Key Developments

10.12.5 Key Strategies

10.12.6 SWOT Analysis

10.13 International Business Machines Corporation (IBM) (US)

10.13.1 Company Overview

10.13.2 Product/Services Offered

10.13.3 Financial Overview

10.13.4 Key Developments

10.13.5 Key Strategies

10.13.6 SWOT Analysis

11 Appendix

11.1 References

11.2 Related Reports

11.3 List of Abbreviations

List of Tables

Table 1 Global Oil & Gas SCADA Market, by Architecture, 2024โ€“2032 (USD Million)

Table 2 Global Oil & Gas SCADA Market, by Sector, 2024โ€“2032 (USD Million)

Table 3 Global Oil & Gas SCADA Market, by Region, 2024โ€“2032 (USD Million)

Table 4 North America: Oil & Gas SCADA Market, by Country, 2024โ€“2032 (USD Million)

Table 5 North America: Oil & Gas SCADA Market, by Architecture, 2024โ€“2032 (USD Million)

Table 6 North America: Oil & Gas SCADA Market, by Sector, 2024โ€“2032 (USD Million)

Table 7 US: Oil & Gas SCADA Market, by Architecture, 2024โ€“2032 (USD Million)

Table 8 Mexico: Oil & Gas SCADA Market, by Architecture, 2024โ€“2032 (USD Million)

Table 9 Mexico: Oil & Gas SCADA Market, by Sector, 2024โ€“2032 (USD Million)

Table 10 Europe: Oil & Gas SCADA Market, by Country, 2024โ€“2032 (USD Million)

Table 11 Europe: Oil & Gas SCADA Market, by Architecture, 2024โ€“2032 (USD Million)

Table 12 Europe: Oil & Gas SCADA Market, by Sector, 2024โ€“2032 (USD Million)

Table 13 Russia: Oil & Gas SCADA Market, by Architecture, 2024โ€“2032 (USD Million)

Table 14 Russia: Oil & Gas SCADA Market, by Sector, 2024โ€“2032 (USD Million)

Table 15 Germany: Oil & Gas SCADA Market, by Architecture, 2024โ€“2032 (USD Million)

Table 16 Germany: Oil & Gas SCADA Market, by Sector, 2024โ€“2032 (USD Million)

Table 17 UK: Oil & Gas SCADA Market, by Architecture, 2024โ€“2032 (USD Million)

Table 18 UK: Oil & Gas SCADA Market, by Sector, 2024โ€“2032 (USD Million)

Table 19 Italy: Oil & Gas SCADA Market, by Architecture, 2024โ€“2032 (USD Million)

Table 20 Italy: Oil & Gas SCADA Market, by Sector, 2024โ€“2032 (USD Million)

Table 21 Rest of Europe: Oil & Gas SCADA Market, by Architecture, 2024โ€“2032 (USD Million)

Table 22 Rest of Europe: Oil & Gas SCADA Market, by Sector, 2024โ€“2032 (USD Million)

Table 23 Asia-Pacific: Oil & Gas SCADA Market, by Country, 2024โ€“2032 (USD Million)

Table 24 Asia-Pacific: Oil & Gas SCADA Market, by Architecture, 2024โ€“2032 (USD Million)

Table 25 Asia-Pacific: Oil & Gas SCADA Market, by Sector, 2024โ€“2032 (USD Million)

Table 26 China: Oil & Gas SCADA Market, by Architecture, 2024โ€“2032 (USD Million)

Table 27 China: Oil & Gas SCADA Market, by Sector, 2024โ€“2032 (USD Million)

Table 28 India: Oil & Gas SCADA Market, by Architecture, 2024โ€“2032 (USD Million)

Table 29 India: Oil & Gas SCADA Market, by Sector, 2024โ€“2032 (USD Million)

Table 30 JAPAN: Oil & Gas SCADA Market, by Architecture, 2024โ€“2032 (USD Million)

Table 31 JAPAN: Oil & Gas SCADA Market, by Sector, 2024โ€“2032 (USD Million)

Table 32 Australia: Oil & Gas SCADA Market, by Architecture, 2024โ€“2032 (USD Million)

Table 33 Australia: Oil & Gas SCADA Market, by Sector, 2024โ€“2032 (USD Million)

Table 34 Rest of Asia-Pacific: Oil & Gas SCADA Market, by Architecture, 2024โ€“2032 (USD Million)

Table 35 Rest of Asia-Pacific: Oil & Gas SCADA Market, by Sector, 2024โ€“2032 (USD Million)

Table 36 Middle East & Africa: Oil & Gas SCADA Market, by Country, 2024โ€“2032 (USD Million)

Table 37 Middle East & Africa: Oil & Gas SCADA Market, by Architecture, 2024โ€“2032 (USD Million)

Table 38 Middle East & Africa: Oil & Gas SCADA Market, by Sector, 2024โ€“2032 (USD Million)

Table 39 Saudi Arabia: Oil & Gas SCADA Market, by Architecture, 2024โ€“2032 (USD Million)

Table 40 Saudi Arabia: Oil & Gas SCADA Market, by Sector, 2024โ€“2032 (USD Million)

Table 41 UAE: Oil & Gas SCADA Market, by Architecture, 2024โ€“2032 (USD Million)

Table 42 UAE: Oil & Gas SCADA Market, by Sector, 2024โ€“2032 (USD Million)

Table 43 South Africa: Oil & Gas SCADA Market, by Architecture, 2024โ€“2032 (USD Million)

Table 44 South Africa: Oil & Gas SCADA Market, by Sector, 2024โ€“2032 (USD Million)

Table 45 Rest of the Middle East & Africa: Oil & Gas SCADA Market, by Architecture, 2024โ€“2032 (USD Million)

Table 46 Rest of the Middle East & Africa: Oil & Gas SCADA Market, by Sector, 2024โ€“2032 (USD Million)

Table 47 South America: Oil & Gas SCADA Market, by Country, 2024โ€“2032 (USD Million)

Table 48 South America: Oil & Gas SCADA Market, by Architecture, 2024โ€“2032 (USD Million)

Table 49 South America: Oil & Gas SCADA Market, by Sector, 2024โ€“2032 (USD Million)

Table 50 Brazil: Oil & Gas SCADA Market, by Architecture, 2024โ€“2032 (USD Million)

Table 51 Brazil: Oil & Gas SCADA Market, by Sector, 2024โ€“2032 (USD Million)

Table 52 Argentina: Oil & Gas SCADA Market, by Architecture, 2024โ€“2032 (USD Million)

Table 53 Argentina: Oil & Gas SCADA Market, by Sector, 2024โ€“2032 (USD Million)

Table 54 Venezuela: Oil & Gas SCADA Market, by Architecture, 2024โ€“2032 (USD Million)

Table 55 Venezuela: Oil & Gas SCADA Market, by Sector, 2024โ€“2032 (USD Million)

Table 56 Rest of South America: Oil & Gas SCADA Market, by Architecture, 2024โ€“2032 (USD Million)

Table 57 Rest of South America: Oil & Gas SCADA Market, by Sector, 2024โ€“2032 (USD Million)

List of Figures

Figure 1 Research Process of MRFR

Figure 2 Top-Down and Bottom-Up Approach

Figure 3 Market Dynamics

Figure 4 Impact Analysis: Market Drivers

Figure 5 Impact Analysis: Market Restraints

Figure 6 Porterโ€™s Five Forces Analysis

Figure 7 Value Chain Analysis

Figure 8 Global Oil & Gas SCADA Market Share, by Sector, 2024(%)

Figure 9 Global Oil & Gas SCADA Market, by Sector, 2024โ€“2032 (USD Million)

Figure 10 Global Oil & Gas SCADA Market Share, by Architecture, 2024(%)

Figure 11 Global Oil & Gas SCADA Market, by Architecture, 2024โ€“2032 (USD Million)

Figure 12 Global Oil & Gas SCADA Market Share (%), by Region, 2020

Figure 13 Global Oil & Gas SCADA Market, by Region, 2024โ€“2032 (USD Million)

Figure 14 North America: Oil & Gas SCADA Market Share (%), 2020

Figure 15 North America: Oil & Gas SCADA Market, by Country, 2024โ€“2032 (USD Million)

Figure 16 Europe: Oil & Gas SCADA Market Share (%), 2024

Figure 17 Europe: Oil & Gas SCADA Market, by Country, 2024โ€“2032 (USD Million)

Figure 18 Asia-Pacific: Oil & Gas SCADA Market Share (%), 2020

Figure 19 Asia-Pacific: Oil & Gas SCADA Market, by Country, 2024โ€“2032 (USD Million)

Figure 20 Middle East & Africa: Oil & Gas SCADA Market Share (%), 2020

Figure 21 Middle East & Africa: Oil & Gas SCADA Market, by Region, 2024โ€“2032 (USD Million)

Figure 22 South America: Oil & Gas SCADA Market Share (%), 2020

Figure 23 South America: Oil & Gas SCADA Market, by Region, 2024โ€“2032 (USD Million)

Purchase Option
Single User $ 4,950
Multiuser License $ 5,950
Enterprise User $ 7,250
Compare Licenses
Tailored for You
  • Dedicated Research on any specifics segment or region.
  • Focused Research on specific players in the market.
  • Custom Report based only on your requirements.
  • Flexibility to add or subtract any chapter in the study.
  • Historic data from 2014 and forecasts outlook till 2040.
  • Flexibility of providing data/insights in formats (PDF, PPT, Excel).
  • Provide cross segmentation in applicable scenario/markets.