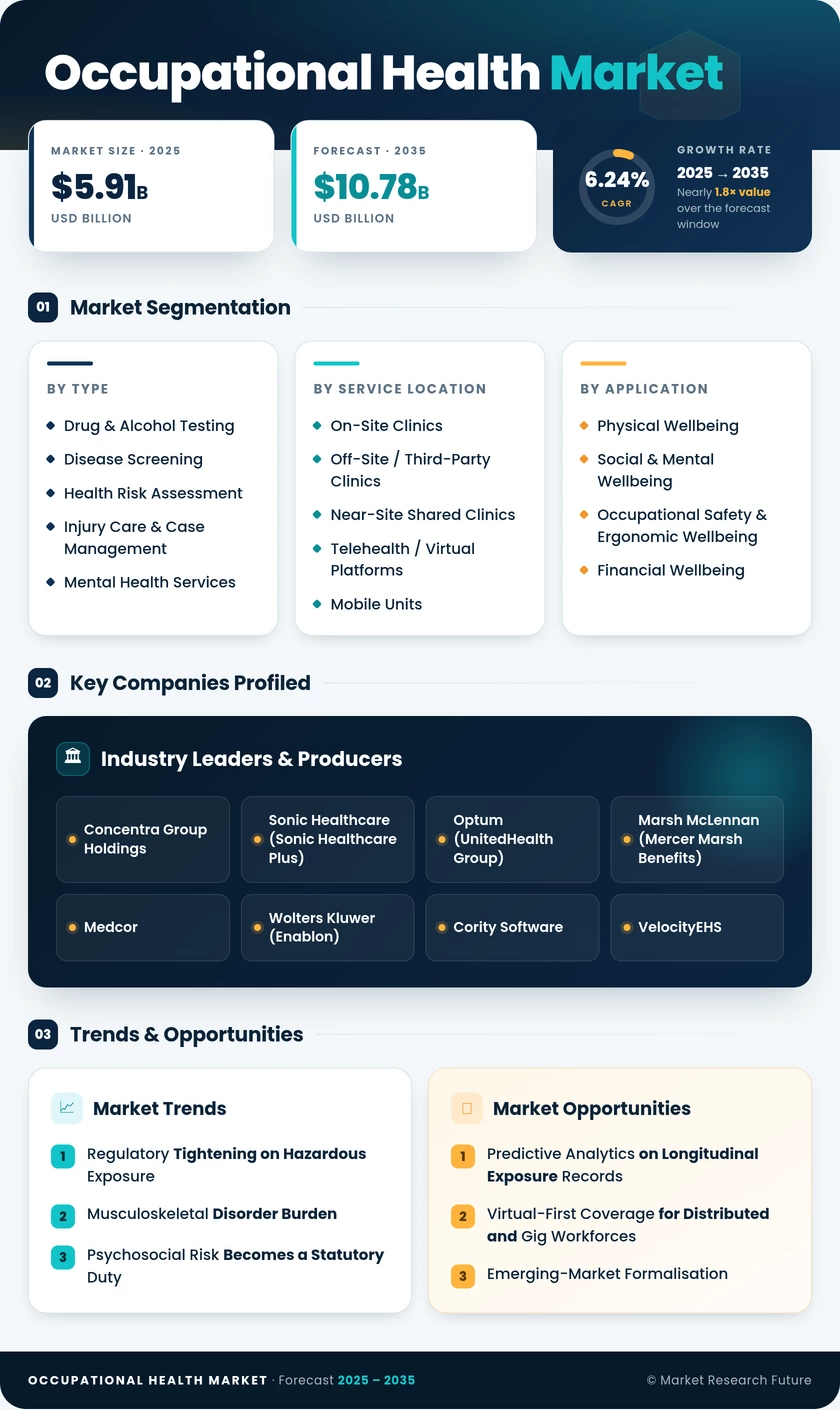
Occupational Health Market (2026 - 2035)

ID: MRFR/HC/41434-HCR 200 Pages Rahul Gotadki Last Updated: September 17, 2026
Occupational Health Market Research Report By Service Type (Health Screening, Wellness Programs, Occupational Safety Training, Drug Testing, Telehealth Services), By Industry (Manufacturing, Construction, Healthcare, Transportation, Education), By End User (Small Enterprises, Medium Enterprises, Large Enterprises), By Geographic Scope (North America, Europe, Asia Pacific, Latin America, Middle East and Africa) and By Regional (North America, Europe, South America, Asia Pacific, Middle East and Africa) - Growth & Industry Forecast 2025 To 2035
Occupational Health Market
Market Size
Forecast Period2026-2035
CAGR (2026-2035)6.24%
2025 Market SizeUSD 5.91 Billion
2035 Market SizeUSD 10.78 Billion
Key Players
Concentra Group Holdings
Sonic Healthcare
Optum
Marsh McLennan
Medcor
Wolters Kluwer
Opportunities
  • Predictive Analytics on Longitudinal Exposure Records
  • Virtual-First Coverage for Distributed and Gig Workforces
  • Emerging-Market Formalisation
  1. 1 Market Overview |
    1. 1.1 Study Assumptions & Market Definition |
    2. 1.2 Scope of the Study |
    3. 1.3 Research Methodology |
    4. 1.4 Market Summary
  2. 2 Key Report Takeaways |
    1. 2.1 By Service Type |
    2. 2.2 By Service Location and Application |
    3. 2.3 By Geography
  3. 3 Market Size & Forecast (2021–2035) |
    1. 3.1 Historical Market Size (2021–2024) |
    2. 3.2 Base Year Assessment (2025) |
    3. 3.3 Forecast Market Size (2026–2035) |
    4. 3.4 Year-over-Year Growth Analysis
  4. 4 Driver Impact Analysis |
    1. 4.1 Regulatory Tightening on Hazardous Exposure |
    2. 4.2 Musculoskeletal Disorder Burden |
    3. 4.3 Psychosocial Risk Becomes a Statutory Duty |
    4. 4.4 Telehealth Economics for Distributed Workforces
  5. 5 Restraints Impact Analysis |
    1. 5.1 Clinician Supply Constraints |
    2. 5.2 Health Data Privacy and Consent |
    3. 5.3 Small Employer Affordability
  6. 6 Opportunity Analysis |
    1. 6.1 Predictive Analytics on Longitudinal Exposure Records |
    2. 6.2 Virtual-First Coverage for Distributed Workforces |
    3. 6.3 Emerging-Market Formalisation |
    4. 6.4 Integrated Return-to-Work Case Management |
    5. 6.5 Heat and Climate-Related Health Programmes |
    6. 6.6 Industry Value Chain Analysis |
    7. 6.7 Porter's Five Forces Analysis
  7. 7 Regional Analysis |
    1. 7.1 North America | |
      1. 7.1.1 US | |
      2. 7.1.2 Canada | |
      3. 7.1.3 Mexico |
    2. 7.2 Europe | |
      1. 7.2.1 Germany | |
      2. 7.2.2 UK | |
      3. 7.2.3 France | |
      4. 7.2.4 Italy | |
      5. 7.2.5 Spain | |
      6. 7.2.6 Nordic Countries | |
      7. 7.2.7 Russia | |
      8. 7.2.8 Rest of Europe |
    3. 7.3 Asia-Pacific | |
      1. 7.3.1 China | |
      2. 7.3.2 India | |
      3. 7.3.3 Japan | |
      4. 7.3.4 South Korea | |
      5. 7.3.5 ASEAN | |
      6. 7.3.6 Rest of Asia-Pacific |
    4. 7.4 South America | |
      1. 7.4.1 Brazil | |
      2. 7.4.2 Argentina | |
      3. 7.4.3 Rest of South America |
    5. 7.5 Middle East & Africa | |
      1. 7.5.1 Saudi Arabia | |
      2. 7.5.2 UAE | |
      3. 7.5.3 South Africa | |
      4. 7.5.4 Egypt | |
      5. 7.5.5 Rest of Middle East & Africa
  8. 8 Future Outlook (2026–2035) |
    1. 8.1 AI-Assisted Clinical Triage |
    2. 8.2 Platform Economics and Provider Margins |
    3. 8.3 Outcome-Based Contracting |
    4. 8.4 Climate Adaptation as a Service Category
  9. 9 Segmentation Analysis |
    1. 9.1 By Service Type | |
      1. 9.1.1 Disease Screening | |
      2. 9.1.2 Drug & Alcohol Testing | |
      3. 9.1.3 Health Risk Assessment | |
      4. 9.1.4 Injury Care & Case Management | |
      5. 9.1.5 Mental Health Services | |
      6. 9.1.6 Vaccination & Immunisation | |
      7. 9.1.7 Primary Care & Treatment Services | |
      8. 9.1.8 Ergonomic & Physical Wellness Services | |
      9. 9.1.9 Return-to-Work & Disability Management Services | |
      10. 9.1.10 Other Services |
    2. 9.2 By Service Location | |
      1. 9.2.1 On-Site Clinics | |
      2. 9.2.2 Near-Site Shared Clinics | |
      3. 9.2.3 Off-Site / Third-Party Clinics | |
      4. 9.2.4 Telehealth / Virtual Occupational Health | |
      5. 9.2.5 Mobile Health Units |
    3. 9.3 By Application | |
      1. 9.3.1 Physical Wellbeing | |
      2. 9.3.2 Social & Mental Wellbeing | |
      3. 9.3.3 Chemical & Biological Exposure Management | |
      4. 9.3.4 Chronic Disease Management | |
      5. 9.3.5 Preventive & Lifestyle Management | |
      6. 9.3.6 Emergency & Trauma Manangement |
    4. 9.4 By Organisation Size | |
      1. 9.4.1 Micro (<10 Employees) | |
      2. 9.4.2 Small (10–249 Employees) | |
      3. 9.4.3 Large (250–4,999 Employees) | |
      4. 9.4.4 Very Large (≥5,000 Employees)
  10. 10 Competitive Landscape |
    1. 10.1 Market Concentration Analysis (2026) |
    2. 10.2 Competitive Benchmarking Matrix |
    3. 10.3 Company Profiles | |
      1. 10.3.1 Concentra Group Holdings | |
      2. 10.3.2 Sonic Healthcare | |
      3. 10.3.3 Optum (UnitedHealth Group) | |
      4. 10.3.4 Marsh McLennan (Mercer Marsh Benefits) | |
      5. 10.3.5 Medcor | |
      6. 10.3.6 Wolters Kluwer (Enablon) | |
      7. 10.3.7 Cority Software | |
      8. 10.3.8 VelocityEHS | |
      9. 10.3.9 Medigold Health | |
      10. 10.3.10 Axiom Medical | |
      11. 10.3.11 Examinetics
  11. 11 Recent Developments & News (2023–2025)
  12. 12 Report Scope & Methodology |
    1. 12.1 Study Period & Base Year |
    2. 12.2 Valuation Currency & Conversion |
    3. 12.3 Abbreviations
  13. 13 Detailed Sources & Citations
  14. 14 Frequently Asked Questions
  15. 15 LIST OF TABLES |
  16. TABLE 1 Global Occupational Health Market Size & Forecast, by Revenue (USD Billion), 2021–2035 |
  17. TABLE 2 Global Occupational Health Market — Year-over-Year Growth Analysis, 2021–2035 |
  18. TABLE 3 Driver Impact Analysis Matrix, 2026–2035 |
  19. TABLE 4 Restraint Impact Analysis Matrix, 2026–2035 |
  20. TABLE 5 Global Market Size, by Region, 2021–2035 (USD Billion) |
  21. TABLE 6 North America Market Size, by Country, 2021–2035 (USD Billion) |
  22. TABLE 7 Europe Market Size, by Country, 2021–2035 (USD Billion) |
  23. TABLE 8 Asia-Pacific Market Size, by Country, 2021–2035 (USD Billion) |
  24. TABLE 9 South America Market Size, by Country, 2021–2035 (USD Billion) |
  25. TABLE 10 Middle East & Africa Market Size, by Country, 2021–2035 (USD Billion) |
  26. TABLE 11 Global Market Size, by Service Type, 2021–2035 (USD Billion) |
  27. TABLE 12 Global Market Size, by Service Location, 2021–2035 (USD Billion) |
  28. TABLE 13 Global Market Size, by Application, 2021–2035 (USD Billion) |
  29. TABLE 14 Global Market Size, by Organisation Size, 2021–2035 (USD Billion) |
  30. TABLE 15 North America Market Size, by Service Type, 2021–2035 (USD Billion) |
  31. TABLE 16 Europe Market Size, by Service Type, 2021–2035 (USD Billion) |
  32. TABLE 17 Asia-Pacific Market Size, by Service Type, 2021–2035 (USD Billion) |
  33. TABLE 18 South America Market Size, by Service Location, 2021–2035 (USD Billion) |
  34. TABLE 19 Middle East & Africa Market Size, by Application, 2021–2035 (USD Billion) |
  35. TABLE 20 Competitive Benchmarking Matrix, 2026 |
  36. TABLE 21 Company Profiles — Key Players |
  37. TABLE 22 Recent Developments & Strategic Announcements, 2023–2025 |
  38. TABLE 23 Report Scope & Methodology Summary |
  39. TABLE 24 Detailed Sources & Citations Index
  40. 16 LIST OF FIGURES |
  41. FIGURE 1 Market Dynamics — Drivers, Restraints, and Opportunities Overview |
  42. FIGURE 2 Industry Value Chain Analysis |
  43. FIGURE 3 Porter's Five Forces Analysis |
  44. FIGURE 4 Global Market Size Trend, 2021–2035 (USD Billion) |
  45. FIGURE 5 Year-over-Year Growth Rate Trend, 2022–2035 (%) |
  46. FIGURE 6 Market Share by Service Type, 2025 vs 2035 (%) |
  47. FIGURE 7 Market Share by Service Location, 2025 vs 2035 (%) |
  48. FIGURE 8 Market Share by Application, 2025 vs 2035 (%) |
  49. FIGURE 9 Market Share by Organisation Size, 2025 vs 2035 (%) |
  50. FIGURE 10 Regional Market Share Distribution, 2025 (%) |
  51. FIGURE 11 Regional CAGR Comparison, 2026–2035 (%) |
  52. FIGURE 12 North America Country-Level Share Distribution, 2025 (%) |
  53. FIGURE 13 Europe Country-Level Share Distribution, 2025 (%) |
  54. FIGURE 14 Asia-Pacific Country-Level Share Distribution, 2025 (%) |
  55. FIGURE 15 Competitive Landscape — Estimated Revenue Share Positioning, 2026 |
  56. FIGURE 16 Strategic Positioning Quadrant — Clinical Scale vs Digital Capability

Segmentation Quick Reference

DimensionSub-SegmentsDominant SegmentFastest Growing Segment
By Service TypeDisease Screening; Drug & Alcohol Testing; Health Risk Assessment; Injury Care & Case Management; Mental Health Services; Vaccination & Immunisation; Other ServicesDrug & Alcohol TestingMental Health Services
By Service LocationOn-Site Clinics; Near-Site Shared Clinics; Off-Site / Third-Party Clinics; Telehealth / Virtual Platforms; Mobile UnitsOn-Site ClinicsTelehealth / Virtual Platforms
By ApplicationPhysical Wellbeing; Social & Mental Wellbeing; Occupational Safety & Ergonomic Wellbeing; Financial WellbeingPhysical WellbeingSocial & Mental Wellbeing
By Organisation SizeMicro (<10); Small (10–249); Large (250–4,999); Very Large (≥5,000)Large (250–4,999)Micro (<10)
By GeographyNorth America; Europe; Asia-Pacific; South America; Middle East & AfricaNorth AmericaAsia-Pacific


Market Segmentation Overview

By Service Type

Sub-SegmentKey Trend
Disease ScreeningShift from annual batch campaigns toward continuous risk-stratified surveillance
Drug & Alcohol TestingOral fluid and hair testing gain ground over urine panels for reduced adulteration risk.
Health Risk AssessmentBiometric capture increasingly automated through kiosks and connected devices.
Injury Care & Case ManagementEarly-intervention triage compresses average claim duration.
Mental Health ServicesStatutory psychosocial risk assessment converts pilots into enterprise contracts.
Vaccination & ImmunisationEmployer-hosted campaigns extend beyond influenza to travel and hepatitis programmes.
Other ServicesErgonomic consulting and travel medicine bundled into broader retainers.


Service type remains the primary axis on which providers differentiate. Mandated categories deliver revenue stability while discretionary categories deliver growth, and the most defensible portfolios combine both so that compliance work funds the client relationship through which wellbeing services are then sold.

By Service Location

Sub-SegmentKey Trend
On-Site ClinicsScope broadening from injury care into primary care and chronic disease management
Near-Site Shared ClinicsMulti-employer cost pooling makes dedicated capacity viable for mid-sized firms.
Off-Site / Third-Party ClinicsNetwork density and appointment lead time become the competitive variables.
Telehealth / Virtual PlatformsAsynchronous triage front-ends physical capacity rather than replacing it
Mobile UnitsSensor-equipped vehicles bring audiometry and spirometry to dispersed sites.


Delivery location increasingly reflects workforce geography rather than employer preference. Hybrid architectures — a virtual front door routing to physical capacity when clinically necessary — are becoming the default design for employers with more than a handful of sites.

By Application

Sub-SegmentKey Trend
Physical WellbeingPredictive musculoskeletal screening displaces reactive physiotherapy referral.
Social & Mental WellbeingBuyers demand validated clinical outcomes rather than engagement metrics.
Occupational Safety & Ergonomic WellbeingComputer-vision posture analysis scales assessment beyond sampled audits.
Financial WellbeingPositioned as a stress-reduction lever tied to retention outcomes


Application-level demand tracks what employers can measure. Categories with clean links to absence data and claim cost attract budget most readily, which is why physical and ergonomic wellbeing retain the largest allocations while mental health investment scales only as measurement practice matures.

By Organisation Size

Sub-SegmentKey Trend
Micro (<10 Employees)Per-employee-per-month subscription products remove the affordability barrier.
Small (10–249 Employees)Insurer incentives and supply-chain audits pull firms into voluntary provision.
Large (250–4,999 Employees)Statutory thresholds plus HR capacity sustain the deepest programme spend
Very Large (≥5,000 Employees)Multi-country standardisation drives platform consolidation and global tenders.


Organisation size determines both buying process and product form. Enterprise buyers run formal tenders with outcome clauses and multi-year terms, while the small and micro tiers buy productised subscriptions through digital channels — two distinct go-to-market motions that few providers currently serve equally well.




Download PDF ×

We do not share your information with anyone. However, we may send you emails based on your report interest from time to time. You may contact us at any time to opt-out.