ID: MRFR/F-B & N/3439-HCR | 110 Pages | Author: Varsha More | December 2023
Table of Content
Chapter 1. Methodology and Scope
1.1. Research Methodology
1.1.1 Initial Data Exploration
1.1.2 Statistical Modelling and Forecast
1.1.3 Industry Insights and Validation
1.2. Data Sources
Chapter 2. Executive Summary
2.1. Nutritional bars Industry Market Synopsis, 2023β2030
2.1.1 Business Trends
2.1.2 Product Type Trends
2.1.3 Product Flavor Trends
2.1.4 Product Distribution channel Trends
Chapter 3 Nutritional bars market Industry Insights
3.1 Industry Segmentation
3.2 Industry Size and Forecast
3.3 Industry Ecosystem Analysis
3.4 Industry Impact forces
3.4.1 Growth Drivers
3.4.1.1 Growing demand of portable convenience nutritional
3.4.1.2 Increasing health conscious population
3.4.2 Industry Pitfalls & Challenges
3.4.2.1 Large number of product substitutes available
3.4.2.2 High sugar content in the product
3.5 Growth Potential Analysis
3.6 Company Market Share Analysis, 2022
3.7 Porterβs analysis
3.8 PESTEL analysis
Chapter 4 Nutritional bars market by Type Insights
4.1 Global Nutritional bars Market Volume Share by Type, 2023β2030
4.1.1 Protein bars
4.1.1.1 Market Estimates & Forecast, 2023β2030
4.1.2 Meal-replacement bars
4.1.2.1 Market Estimates & Forecast, 2023β2030
4.1.3 Snacks bars
4.1.3.1 Market Estimates & Forecast, 2023β2030
4.1.4 Whole food bars
4.1.4.1 Market Estimates & Forecast, 2023β2030
4.1.5 Others
4.1.5.1 Market Estimates & Forecast, 2023β2030
Chapter 5 Nutritional bars market by Flavor Insights
5.1 Global Nutritional bars Market Volume Share by Flavor, 2023β2030
5.1.1 Chocolate
5.1.1.1 Market Estimates & Forecast, 2023β2030
5.1.2 Fruits
5.1.2.1 Market Estimates & Forecast, 2023β2030
5.1.3 Peanut butter
5.1.3.1 Market Estimates & Forecast, 2023β2030
5.1.4 Savoury
5.1.4.1 Market Estimates & Forecast, 2023β2030
5.1.5 Spices
5.1.5.1 Market Estimates & Forecast, 2023β2030
5.1.6 Others
5.1.6.1 Market Estimates & Forecast, 2023β2030
Chapter 6 Nutritional bars market by Distribution channel Insights
6.1 Global Nutritional bars Market Volume Share by Distribution channel, 2023β2030
6.1.1 Store-Based
6.1.1.1 Market Estimates & Forecast, 2023β2030
6.1.1.2 Market Estimates & Forecast by Region, 2023β2030
6.1.2 Non-Store Based
6.1.2.1 Market Estimates & Forecast, 2023β2030
6.1.2.2 Market Estimates & Forecast by Region, 2023β2030
Chapter 7 Nutritional bars market Regional Insights
7.1 Nutritional bars Market Volume Share by Region, 2023β2030.
7.2 North America
7.2. A Market Estimates & Forecast, 2023β2030
7.2. B Market Estimates & Forecast, by Type, 2023β2030
7.2. C Market Estimates & Forecast, by Flavor, 2023β2030
7.2. D Market Estimates & Forecast, by Distribution channel, 2023β2030
7.2.1 U.S.
7.2.1.1 Market Estimates & Forecast, 2023β2030
7.2.1.2 Market Estimates & Forecast, by Type, 2023β2030
7.2.1.3 Market Estimates & Forecast, by Flavor, 2023β2030
7.2.1.4 Market Estimates & Forecast, by Distribution channel, 2023β2030
7.2.2 Canada
7.2.2.1 Market Estimates & Forecast, 2023β2030
7.2.2.2 Market Estimates & Forecast, by Type, 2023β2030
7.2.2.3 Market Estimates & Forecast, by Flavor, 2023β2030
7.2.2.4 Market Estimates & Forecast, by Distribution channel, 2023β2030
7.2.3 Mexico
7.2.3.1 Market Estimates & Forecast, 2023β2030
7.2.3.2 Market Estimates & Forecast, by Type, 2023β2030
7.2.3.3 Market Estimates & Forecast, by Flavor, 2023β2030
7.2.3.4 Market Estimates & Forecast, by Distribution channel, 2023β2030
7.3 Europe
7.3. A Market Estimates & Forecast, 2023β2030
7.3. B Market Estimates & Forecast, by Type, 2023β2030
7.3. C Market Estimates & Forecast, by Flavor, 2023β2030
7.3. D Market Estimates & Forecast, by Distribution channel, 2023β2030
7.3.1 Germany
7.3.1.1 Market Estimates & Forecast, 2023β2030
7.3.1.2 Market Estimates & Forecast, by Type, 2023β2030
7.3.1.3 Market Estimates & Forecast, by Flavor, 2023β2030
7.3.1.4 Market Estimates & Forecast, by Distribution channel, 2023β2030
7.3.2 U.K
7.3.2.1 Market Estimates & Forecast, 2023β2030
7.3.2.2 Market Estimates & Forecast, by Type, 2023β2030
7.3.2.3 Market Estimates & Forecast, by Flavor, 2023β2030
7.3.2.4 Market Estimates & Forecast, by Distribution channel, 2023β2030
7.3.3 France
7.3.3.1 Market Estimates & Forecast, 2023β2030
7.3.3.2 Market Estimates & Forecast, by Type, 2023β2030
7.3.3.3 Market Estimates & Forecast, by Flavor, 2023β2030
7.3.3.4 Market Estimates & Forecast, by Distribution channel, 2023β2030
7.3.4 Italy
7.3.4.1 Market Estimates & Forecast, 2023β2030
7.3.4.2 Market Estimates & Forecast, by Type, 2023β2030
7.3.4.3 Market Estimates & Forecast, by Flavor, 2023β2030
7.3.4.4 Market Estimates & Forecast, by Distribution channel, 2023β2030
7.4 Asia Pacific
7.4. A Market Estimates & Forecast, 2023β2030
7.4. B Market Estimates & Forecast, by Type, 2023β2030
7.4. C Market Estimates & Forecast, by Flavor, 2023β2030
7.4. D Market Estimates & Forecast, by Distribution channel, 2023β2030
7.4.1 China
7.4.1.1 Market Estimates & Forecast, 2023β2030
7.4.1.2 Market Estimates & Forecast, by Type, 2023β2030
7.4.1.3 Market Estimates & Forecast, by Flavor, 2023β2030
7.4.1.4 Market Estimates & Forecast, by Distribution channel, 2023β2030
7.4.2 India
7.4.2.1 Market Estimates & Forecast, 2023β2030
7.4.2.2 Market Estimates & Forecast, by Type, 2023β2030
7.4.2.3 Market Estimates & Forecast, by Flavor, 2023β2030
7.4.2.4 Market Estimates & Forecast, by Distribution channel, 2023β2030
7.4.3 Japan
7.4.3.1 Market Estimates & Forecast, 2023β2030
7.4.3.2 Market Estimates & Forecast, by Type, 2023β2030
7.4.3.3 Market Estimates & Forecast, by Flavor, 2023β2030
7.4.3.4 Market Estimates & Forecast, by Distribution channel, 2023β2030
7.5 RoW
7.5. A Market Estimates & Forecast, 2023β2030
7.5. B Market Estimates & Forecast, by Type, 2023β2030
7.5. C Market Estimates & Forecast, by Flavor, 2023β2030
7.5. D Market Estimates & Forecast, by Distribution channel, 2023β2030
Chapter 8 Competitor Profile
8.1 Atkins Nutritionals, Inc. (U.S.)
8.1.1 Business Overview
8.1.2 Financial Data
8.1.3 Product Landscape
8.1.4 Key Developments
8.1.5 Business Strategy
8.1.6 SWOT Analysis
8.2 Clif Bar & Company. (U.S.)
8.2.1 Business Overview
8.2.2 Financial Data
8.2.3 Product Landscape
8.2.4 Key Developments
8.2.5 Business Strategy
8.2.6 SWOT Analysis
8.3 General Mills Inc. (U.S.)
8.3.1 Business Overview
8.3.2 Financial Data
8.3.3 Product Landscape
8.3.4 Key Developments
8.3.5 Business Strategy
8.3.6 SWOT Analysis
8.4 Kellogg Co. (U.S.)
8.4.1 Business Overview
8.4.2 Financial Data
8.4.3 Product Landscape
8.4.4 Key Developments
8.4.5 Business Strategy
8.4.6 SWOT Analysis
8.5 Kashi Company (U.S.)
8.5.1 Business Overview
8.5.2 Financial Data
8.5.3 Product Landscape
8.5.4 Key Developments
8.5.5 Business Strategy
8.5.6 SWOT Analysis
8.6 Quaker Oats Company (U.S.)
8.6.1 Business Overview
8.6.2 Financial Data
8.6.3 Product Landscape
8.6.4 Key Developments
8.6.5 Business Strategy
8.6.6 SWOT Analysis
8.7 Mars Incorporated (U.S.)
8.7.1 Business Overview
8.7.2 Financial Data
8.7.3 Product Landscape
8.7.4 Key Developments
8.7.5 Business Strategy
8.7.6 SWOT Analysis
Data Tables
TABLE 1 PESTLE ANALYSIS β U.S.
TABLE 2 PESTLE ANALYSIS- JAPAN
TABLE 3 PESTLE ANALYSIS- CHINA
TABLE 4 PESTLE ANALYSIS- FRANCE
TABLE 5 PESTLE ANALYSIS- GERMANY
TABLE 6 KEY SUPPLIERS OF NUTRITIONAL BARS MARKET
TABLE 7 GLOBAL MARKET FOR NUTRITIONAL BARS MARKET, BY TYPE, (2023β2030), USD MILLION
TABLE 8 GLOBAL MARKET FOR NUTRITIONAL BARS MARKET, BY FLAVOR, (2023β2030), USD MILLION
TABLE 9 GLOBAL MARKET FOR NUTRITIONAL BARS MARKET, BY DISTRIBUTION CHANNEL, (2023β2030), USD MILLION
TABLE 10 GLOBAL NUTRITIONAL BARS MARKET SALES AND GROWTH RATE (2023β2030) USD MILLION
TABLE 11 GLOBAL MARKET FOR NUTRITIONAL BARS MARKET TOP 5 COUNTRIES
TABLE 12 GLOBAL MARKET FOR NUTRITIONAL BARS MARKET TOP COMPANIES-USD MILLION
TABLE 13 NORTH AMERICAN GLOBAL MARKET FOR NUTRITIONAL BARS MARKET, BY TYPE, (2023β2030) USD MILLION
TABLE 14 NORTH AMERICAN MARKET FOR NUTRITIONAL BARS MARKET, BY FLAVOR, (2023β2030), USD MILLION
TABLE 15 NORTH AMERICAN MARKET FOR NUTRITIONAL BARS MARKET, BY DISTRIBUTION CHANNEL, (2023β2030), USD MILLION
TABLE 16 EUROPEAN GLOBAL MARKET FOR NUTRITIONAL BARS MARKET, BY TYPE, (2023β2030) USD MILLION
TABLE 17 EUROPEAN MARKET FOR NUTRITIONAL BARS MARKET, BY FLAVOR, (2023β2030), USD MILLION
TABLE 18 EUROPEAN MARKET FOR NUTRITIONAL BARS MARKET, BY DISTRIBUTION CHANNEL, (2023β2030), USD MILLION
TABLE 19 APAC GLOBAL MARKET FOR NUTRITIONAL BARS MARKET, BY TYPE, (2023β2030) USD MILLION
TABLE 20 APAC MARKET FOR NUTRITIONAL BARS MARKET, BY FLAVOR, (2023β2030), USD MILLION
TABLE 21 APAC MARKET FOR NUTRITIONAL BARS MARKET, BY DISTRIBUTION CHANNEL, (2023β2030), USD MILLION
TABLE 22 REST OF THE WORLD MARKET FOR NUTRITIONAL BARS MARKET, BY TYPE, (2023β2030) USD MILLION
TABLE 23 REST OF THE WORLD MARKET FOR NUTRITIONAL BARS MARKET, BY FLAVOR, (2023β2030), USD MILLION
TABLE 24 REST OF THE WORLD MARKET FOR NUTRITIONAL BARS MARKET, BY DISTRIBUTION CHANNEL, (2023β2030), USD MILLION
TABLE 25 COMPETITIVE LANDSCAPING BASED ON FINACIALS DURING THE YEAR 2022β
Charts & Figures
LIST OF FIGURES
FIGURE 1 RESEARCH METHODOLOGY
FIGURE 2 PRIMARY DATA ANALYSIS APPROACH
FIGURE 3 SECONDARY DATA ANALYSIS APPROACH
FIGURE 4 TRENDS IN NUTRITIONAL BARS MARKET IMPORTS 2022
FIGURE 5 GROWTH RATE IN NUTRITIONAL BARS MARKET IMPORTS 2022
FIGURE 6 NUTRITIONAL BARS MARKET IMPORTS MARKET SHARE BY TOP 5 IMPORTERS (2022)
FIGURE 7 TRENDS IN NUTRITIONAL BARS MARKET EXPORTS 2022
FIGURE 8 GROWTH RATE NUTRITIONAL BARS MARKET EXPORTS 2022
FIGURE 9 NUTRITIONAL BARS MARKET EXPORTS MARKET SHARE BY TOP 5 EXPORTERS (2022)
FIGURE 10 VALUE CHAIN ANALYSIS
FIGURE 11 COST ANALYSIS: NUTRITIONAL BARS MARKET
FIGURE 12 PORTERβS FIVE FORCES ANALYSIS
FIGURE 13 GLOBAL MARKET FOR NUTRITIONAL BARS MARKET TRENDS BY TYPE
FIGURE 14 GLOBAL MARKET FOR NUTRITIONAL BARS MARKET TRENDS BY FLAVOR
FIGURE 15 GLOBAL MARKET FOR NUTRITIONAL BARS MARKET TRENDS BY DISTRIBUTION CHANNEL
FIGURE 16 FINANCIALS
Nutritional Bar Market Segmentation
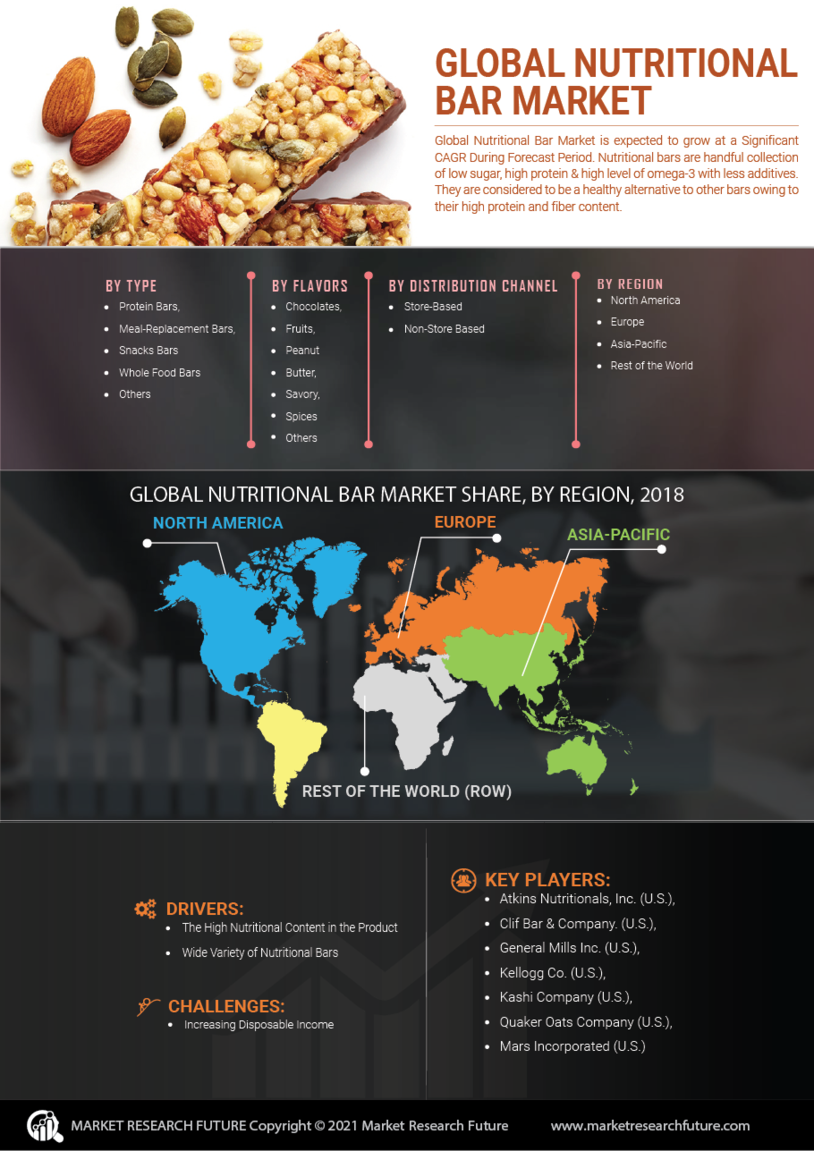
Nutritional Bar Type Outlook (USD Billion, 2019-2030)
Protein Bars
Snack Bars
Whole Foods Car
Meal Replacement Card
Others
Nutritional Bar Flavours Outlook (USD Billion, 2019-2030)
Chocolate
Peanut Butter
Fruits
Spices
Others
Nutritional Bar Distribution Channel Outlook (USD Billion, 2019-2030)
Store-Based
Non-Store-Based
Nutritional Bar Regional Outlook (USD Billion, 2019-2030)
North America Outlook (USD Billion, 2019-2030)
North America Nutritional Bar by Type
Protein Bars
Snack Bars
Whole Foods Car
Meal Replacement Card
Others
North America Nutritional Bar by Flavours
Chocolate
Peanut Butter
Fruits
Spices
Others
North America Nutritional Bar by Distribution Channel
Store-Based
Non-Store-Based
US Outlook (USD Billion, 2019-2030)
US Nutritional Bar by Type
Protein Bars
Snack Bars
Whole Foods Car
Meal Replacement Card
Others
US Nutritional Bar by Flavours
Chocolate
Peanut Butter
Fruits
Spices
Others
US Nutritional Bar by Distribution Channel
Store-Based
Non-Store-Based
CANADA Outlook (USD Billion, 2019-2030)
Canada Nutritional Bar by Type
Protein Bars
Snack Bars
Whole Foods Car
Meal Replacement Card
Others
Canada Nutritional Bar by Flavours
Chocolate
Peanut Butter
Fruits
Spices
Others
Canada Nutritional Bar by Distribution Channel
Store-Based
Non-Store-Based
Europe Outlook (USD Billion, 2019-2030)
Europe Nutritional Bar by Type
Protein Bars
Snack Bars
Whole Foods Car
Meal Replacement Card
Others
Europe Nutritional Bar by Flavours
Chocolate
Peanut Butter
Fruits
Spices
Others
Europe Nutritional Bar by Distribution Channel
Store-Based
Non-Store-Based
Germany Outlook (USD Billion, 2019-2030)
Germany Nutritional Bar by Type
Protein Bars
Snack Bars
Whole Foods Car
Meal Replacement Card
Others
Germany Nutritional Bar by Flavours
Chocolate
Peanut Butter
Fruits
Spices
Others
Germany Nutritional Bar by Distribution Channel
Store-Based
Non-Store-Based
France Outlook (USD Billion, 2019-2030)
France Nutritional Bar by Type
Protein Bars
Snack Bars
Whole Foods Car
Meal Replacement Card
Others
France Nutritional Bar by Flavours
Chocolate
Peanut Butter
Fruits
Spices
Others
France Nutritional Bar by Distribution Channel
Store-Based
Non-Store-Based
UK Outlook (USD Billion, 2019-2030)
UK Nutritional Bar by Type
Protein Bars
Snack Bars
Whole Foods Car
Meal Replacement Card
Others
UK Nutritional Bar by Flavours
Chocolate
Peanut Butter
Fruits
Spices
Others
UK Nutritional Bar by Distribution Channel
Store-Based
Non-Store-Based
ITALY Outlook (USD Billion, 2019-2030)
Italy Nutritional Bar by Type
Protein Bars
Snack Bars
Whole Foods Car
Meal Replacement Card
Others
Italy Nutritional Bar by Flavours
Chocolate
Peanut Butter
Fruits
Spices
Others
Italy Nutritional Bar by Distribution Channel
Store-Based
Non-Store-Based
SPAIN Outlook (USD Billion, 2019-2030)
Spain Nutritional Bar by Type
Protein Bars
Snack Bars
Whole Foods Car
Meal Replacement Card
Others
Spain Nutritional Bar by Flavours
Chocolate
Peanut Butter
Fruits
Spices
Others
Spain Nutritional Bar by Distribution Channel
Store-Based
Non-Store-Based
Rest Of Europe Outlook (USD Billion, 2019-2030)
Rest of Europe Nutritional Bar by Type
Protein Bars
Snack Bars
Whole Foods Car
Meal Replacement Card
Others
Rest of Europe Nutritional Bar by Flavours
Chocolate
Peanut Butter
Fruits
Spices
Others
Rest of Europe Nutritional Bar by Distribution Channel
Store-Based
Non-Store-Based
Asia-Pacific Outlook (USD Billion, 2019-2030)
Asia-Pacific Nutritional Bar by Type
Protein Bars
Snack Bars
Whole Foods Car
Meal Replacement Card
Others
Asia-Pacific Nutritional Bar by Flavours
Chocolate
Peanut Butter
Fruits
Spices
Others
Asia-Pacific Nutritional Bar by Distribution Channel
Store-Based
Non-Store-Based
China Outlook (USD Billion, 2019-2030)
China Nutritional Bar by Type
Protein Bars
Snack Bars
Whole Foods Car
Meal Replacement Card
Others
China Nutritional Bar by Flavours
Chocolate
Peanut Butter
Fruits
Spices
Others
China Nutritional Bar by Distribution Channel
Store-Based
Non-Store-Based
Japan Outlook (USD Billion, 2019-2030)
Japan Nutritional Bar by Type
Protein Bars
Snack Bars
Whole Foods Car
Meal Replacement Card
Others
Japan Nutritional Bar by Flavours
Chocolate
Peanut Butter
Fruits
Spices
Others
Japan Nutritional Bar by Distribution Channel
Store-Based
Non-Store-Based
India Outlook (USD Billion, 2019-2030)
India Nutritional Bar by Type
Protein Bars
Snack Bars
Whole Foods Car
Meal Replacement Card
Others
India Nutritional Bar by Flavours
Chocolate
Peanut Butter
Fruits
Spices
Others
India Nutritional Bar by Distribution Channel
Store-Based
Non-Store-Based
Australia Outlook (USD Billion, 2019-2030)
Australia Nutritional Bar by Type
Protein Bars
Snack Bars
Whole Foods Car
Meal Replacement Card
Others
Australia Nutritional Bar by Flavours
Chocolate
Peanut Butter
Fruits
Spices
Others
Australia Nutritional Bar by Distribution Channel
Store-Based
Non-Store-Based
Rest of Asia-Pacific Outlook (USD Billion, 2019-2030)
Rest of Asia-Pacific Nutritional Bar by Type
Protein Bars
Snack Bars
Whole Foods Car
Meal Replacement Card
Others
Rest of Asia-Pacific Nutritional Bar by Flavours
Chocolate
Peanut Butter
Fruits
Spices
Others
Rest of Asia-Pacific Nutritional Bar by Distribution Channel
Store-Based
Non-Store-Based
Rest of the World Outlook (USD Billion, 2019-2030)
Rest of the World Nutritional Bar by Type
Protein Bars
Snack Bars
Whole Foods Car
Meal Replacement Card
Others
Rest of the World Nutritional Bar by Flavours
Chocolate
Peanut Butter
Fruits
Spices
Others
Rest of the World Nutritional Bar by Distribution Channel
Store-Based
Non-Store-Based
Middle East Outlook (USD Billion, 2019-2030)
Middle East Nutritional Bar by Type
Protein Bars
Snack Bars
Whole Foods Car
Meal Replacement Card
Others
Middle East Nutritional Bar by Flavours
Chocolate
Peanut Butter
Fruits
Spices
Others
Middle East Nutritional Bar by Distribution Channel
Store-Based
Non-Store-Based
Africa Outlook (USD Billion, 2019-2030)
Africa Nutritional Bar by Type
Protein Bars
Snack Bars
Whole Foods Car
Meal Replacement Card
Others
Africa Nutritional Bar by Flavours
Chocolate
Peanut Butter
Fruits
Spices
Others
Africa Nutritional Bar by Distribution Channel
Store-Based
Non-Store-Based
Latin America Outlook (USD Billion, 2019-2030)
Latin America Nutritional Bar by Type
Protein Bars
Snack Bars
Whole Foods Car
Meal Replacement Card
Others
Latin America Nutritional Bar by Flavours
Chocolate
Peanut Butter
Fruits
Spices
Others
Latin America Nutritional Bar by Distribution Channel
Store-Based
Non-Store-Based
Research Methodology on Nutritional Bar Market
Introduction
The purpose of this research project is to analyze the Nutritional Bar Market and explore the factors influencing the market in this segment. Nutritional bars are snacks or meal replacements made from a combination of proteins, carbohydrates, fats, vitamins and other nutrients. They have gained popularity in recent years as a convenient and potentially healthy snack or meal substitute.
Nutrition bars have traditionally been used by athletes and bodybuilders to supplement their diets and aid in muscle recovery after intensive workouts. However, in the last few years, nutrition bars have seen a rapid increase in popularity among the general public as people increasingly view them as healthier, convenient snacks. This is due to the multitude of flavours and dietary preferences that these bars can cater to, making them appealing and accessible to a wide range of people.
This report examines the Nutritional Bar Market segment and attempts to understand the key factors driving the market. In doing so, the report will analyze the competitive landscape of the market, the pricing of the products and the strategic alliances of the key players. The report will also evaluate the various distribution channels and the research, development and innovation trends prevailing in the Nutritional Bar Market.
Research Methodology
This report will use a variety of primary and secondary research methodologies to develop an in-depth understanding of the trends, forces and dynamics at play in the Nutritional Bar Market.
Primary research methodology employs interviews, surveys and panel discussions. Interviews with nutrition industry experts from companies, distributors and other related entities will be conducted to gain an understanding of the market, its products, pricing and distribution. Surveys were distributed to the general public to gain an understanding of the market dynamics from a consumer perspective. Panel discussions conducted with nutrition experts, industry leaders and other market observers will provide valuable insights into the Nutritional Bar Market.
The secondary research methodology involves extensive data mining and analysis of published data, journals, articles and reports. This forms the basis of the report, providing opinions and views of external experts on various aspects of the market. Market databases and reports are used to analyze the trends in the Nutritional Bar Market and to predict future market size and development. In addition, company websites and public financial information are used to gain insights into the strategies and performance of the key players in the market.
The data collected from the primary and secondary research methods will be synthesized to come up with a comprehensive overview of the Nutritional Bar Market. This will involve analyzing the strengths and weaknesses of the key players, understanding the pricing structure and evaluating the distribution channels used. Additionally, current trends and macro-issues influencing the market will be discussed in detail.
Finally, the report develops comprehensive market forecasts for the Nutritional Bar Market segment. These forecasts are based on the data collected through primary and secondary research, historical trends and industry projections. Extensive sensitivity analyses will be conducted to understand the various factors that could potentially influence the market in the future.
Conclusion
This comprehensive research project provides insights into the Nutritional Bar Market segment and the factors influencing the segmentβs performance. In doing so, it will provide valuable information to industry players, analysts, investors and other stakeholders to help them understand the market and make informed decisions.