Non Lethal Weapons Market Segmentation
Non Lethal Weapons Market By End-User Industry (USD Billion, 2025-2035)
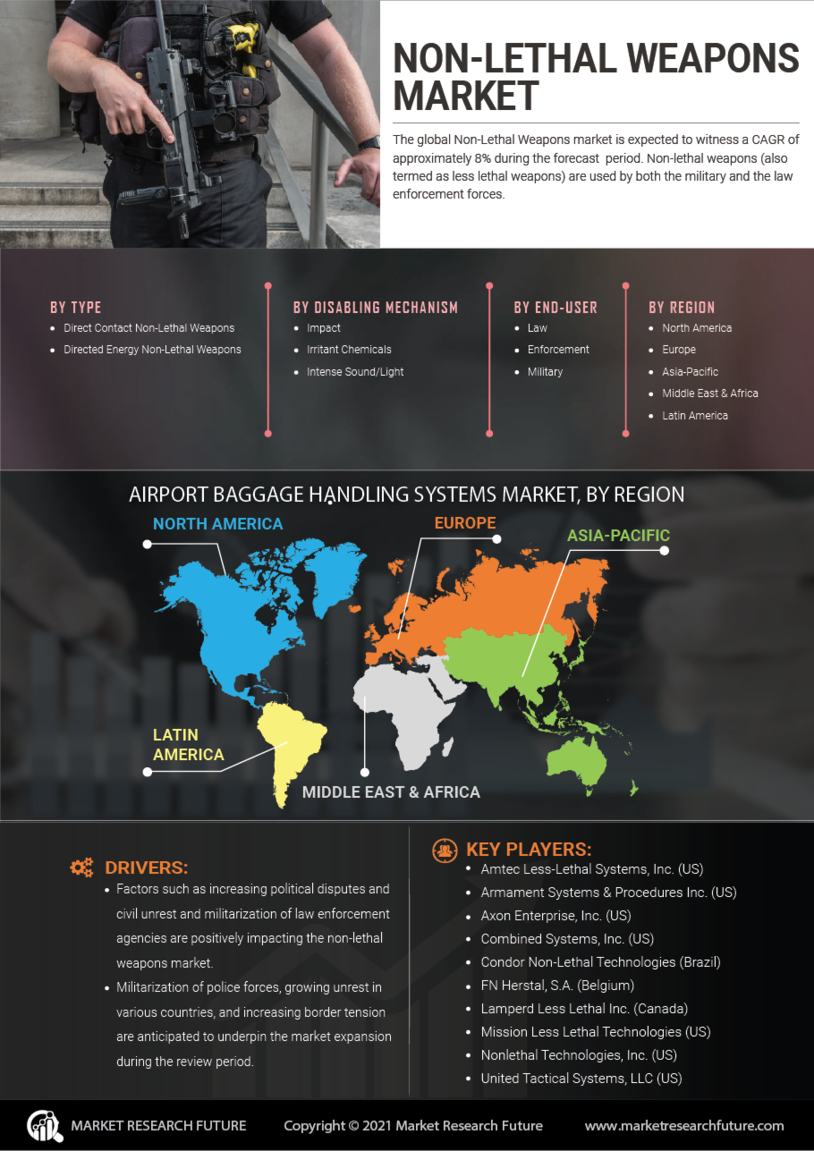
- Military
- Law Enforcement
Non Lethal Weapons Market By Product Types (USD Billion, 2025-2035)
- Direct Contact Weapons
- Directed Energy Weapons
Non Lethal Weapons Market By Market Non Lethal Weapons Market (USD Billion, 2025-2035)
- Electromagnetic
- Mechanical
- Kinetic
- Chemicals