Next Generation Computing Market
ID: MRFR/ICT/10696-CR
128 Pages
Ankit Gupta
Last Updated: March 31, 2026
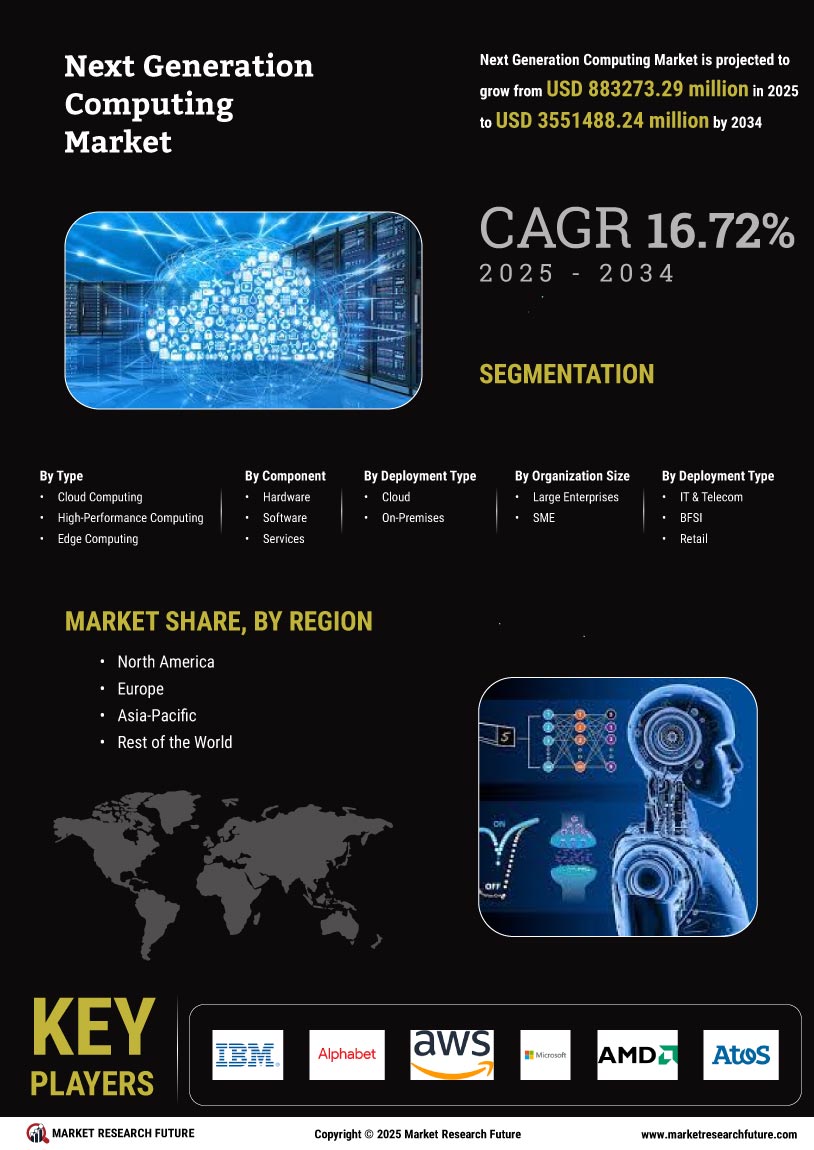
Next Generation Computing Market Size, Share and Trends Analysis Report By Computing Type (Cloud Computing, High-Performance Computing, Edge Computing, Energy Efficiency Computing, Memory-Driven Computing, Neuromorphic computing, Optical Computing, Quantum Computing, Approximate and Probabilistic Computing, and Others), By Component (Hardware, Software, and Services), By Deployment Type (Cloud and On-Premises), By Organization Size (Large Enterprises and SME), By End-Use (IT & Telecom, BFSI, Retail, Healthcare, Aerospace & Defense,, Manufacturing, Energy & Utilities, Media & Entertainment, Automotive & Transportation, and Other End-Use) –Market Forecast Till 2035