Segmentation Quick Reference
| Dimension | Sub-Segments | Dominant Segment (2025) | Fastest Growing Segment (2026–2035) |
| Chip Type | Digital, Analog, Mixed-Signal | Digital | Mixed-Signal |
| Architecture | Spiking Neural Network, ReRAM-Based, Phase-Change-Memory | Spiking Neural Network | Phase-Change-Memory |
| End-User Industry | Neuromorphic Chip Market, Consumer Electronics, Automotive (ADAS/AV), Other Industries | Neuromorphic Chip Market | Consumer Electronics |
| Deployment Model | Edge Devices, Data-Centre / Cloud | Edge Devices | Data-Centre / Cloud |
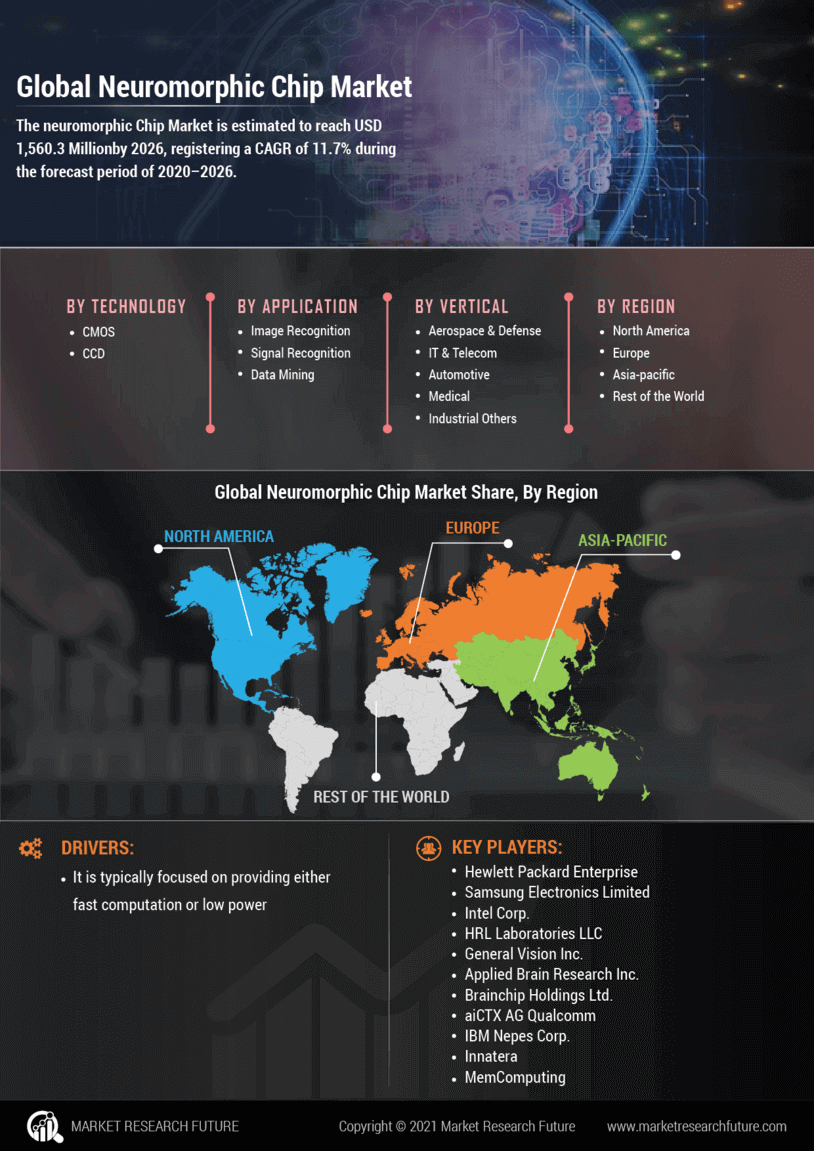
| Geography | North America, Europe, Asia-Pacific, South America, Middle East & Africa | North America | Asia-Pacific |
Market Segmentation Overview
By Chip Type
| Sub-Segment | Key Trend |
| Digital | Leverages mature CMOS EDA flows; dominant platform for defense and research applications. |
| Analog | Lowest power consumption per inference; adoption in always-on wearable sensors |
| Mixed-Signal | Combines analog compute-in-memory with digital control logic; fastest-growing chip type. |
Digital neuromorphic processors benefit from the broadest software ecosystem and established fabrication processes, making them the default choice for institutions prioritizing programmability. Mixed-signal designs are gaining ground as foundries release dedicated process design kits that enable analog synaptic arrays with digital neuron control, delivering the best energy-accuracy trade-off for edge inference.
By Architecture
| Sub-Segment | Key Trend |
| Spiking Neural Network | Flexible neuron models, supported by decades of academic research and open-source simulators |
| ReRAM-Based Architectures | Non-volatile weight storage; suited to write-once, read-many inference workloads |
| Phase-Change-Memory Architectures | Multi-bit precision; strong endurance characteristics for iterative weight updates |
Spiking neural network architectures remain the most widely adopted framework due to extensive academic tooling and neuroscience alignment. ReRAM-based designs have carved a growing niche in inference-only edge deployments where weights are static and read latency is critical.
By End-User Industry
| Sub-Segment | Key Trend |
| Neuromorphic Chip Market | High-ASP contracts; SWaP-constrained autonomous platforms drive premium demand |
| Consumer Electronics | Volume play; smartphone and wearable OEMs seeking sub-milliwatt always-on sensing |
| Automotive (ADAS / AV) | Perception co-processing complements GPU-based central compute in zone architectures. |
| Other Industries | Industrial IoT, healthcare diagnostics, and smart agriculture edge deployments |
Defense and aerospace procurement anchors current revenue, while consumer electronics is positioned to become the volume driver as always-on sensing moves from premium to mainstream smartphone tiers.
By Deployment Model
| Sub-Segment | Key Trend |
| Edge Devices | Natural technology fit; latency, privacy, and power constraints favor neuromorphic silicon |
| Data-Centre / Cloud | Emerging use case: analog in-memory arrays piloted for energy-efficient inference at scale |
Edge deployment dominates today's installed base, but data-center adoption is accelerating as hyperscalers seek alternatives to GPU-heavy inference clusters for recommendation and anomaly-detection workloads.