Segmentation Quick Reference
| Dimension | Sub-Segments | Dominant Segment | Fastest Growing Segment |
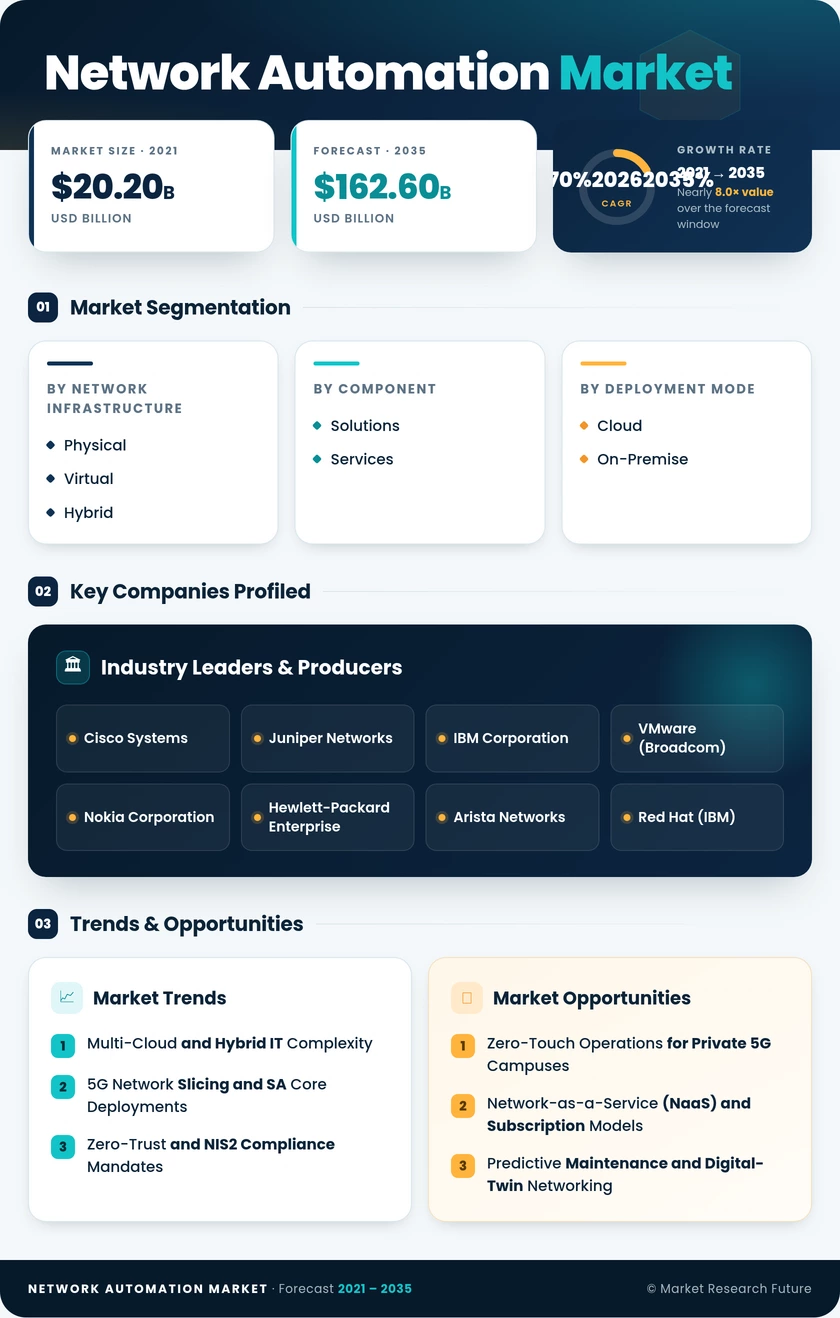
| Network Infrastructure | Physical, Virtual, Hybrid | Hybrid (49.50% share, 2025) | Virtual (20.50% CAGR) |
| Component | Solutions, Services | Solutions (57.50% share, 2025) | Services (17.80% CAGR) |
| Deployment Mode | Cloud, On-Premise | On-Premise (60.20% share, 2025) | Cloud (22.30% CAGR) |
| Organization Size | Large Enterprises, Small and Medium Enterprises | Large Enterprises (72.50% share, 2025) | SMEs (20.60% CAGR) |
| End-User Industry | IT and Telecom, Banking and Financial Services, Manufacturing, Healthcare, Others | IT and Telecom (31.80% share, 2025) | Healthcare (19.90% CAGR) |
| Geography | North America, Europe, Asia-Pacific, South America, Middle East & Africa | North America (41.50% share, 2025) | Asia-Pacific (19.70% CAGR) |
Market Segmentation Overview
By Network Infrastructure
| Sub-Segment | Key Trend |
| Physical | Legacy campus refresh cycles are driving hardware-level automation adoption |
| Virtual | Cloud-native and container-orchestrated networks are accelerating virtual network growth |
| Hybrid | Multi-cloud orchestration requires unified policy management across mixed environments |
Hybrid network infrastructure remains the default enterprise deployment model as organizations balance predictable on-premises performance with the scalability of software-defined overlays. Virtual architectures are gaining ground rapidly as Kubernetes-native networking and service meshes become standard in cloud-first organizations.
By Component
| Sub-Segment | Key Trend |
| Solutions | Platform consolidation toward unified automation suites with AI-embedded analytics |
| Services | Rising demand for managed automation services and implementation consulting |
Solutions continue to command the majority of spending as enterprises seek integrated platforms that combine provisioning, assurance, and analytics. The services segment is growing faster as automation complexity demands specialized professional and managed service engagements.
By Deployment Mode
| Sub-Segment | Key Trend |
| Cloud | SaaS-delivered automation platforms are removing infrastructure overhead for faster time to value |
| On-Premise | Data-sovereignty mandates and latency-sensitive workloads sustaining on-premises demand |
On-premise installations retain the largest share due to regulatory requirements in banking, defense, and healthcare verticals. Cloud deployment is the fastest-growing mode as SaaS platforms reduce the total cost of ownership and simplify multi-site automation rollouts.
By Organization Size
| Sub-Segment | Key Trend |
| Large Enterprises | Complex multi-site, multi-vendor environments driving full-stack automation investment |
| Small and Medium Enterprises | NaaS subscription models are lowering adoption barriers for resource-constrained organizations |
Large enterprises account for the majority of the market given their sprawling device estates and multi-vendor complexity. SMEs represent the faster-growing segment as NaaS and OpEx-based consumption models make enterprise-grade automation accessible without heavy capital investment.
By End-User Industry
| Sub-Segment | Key Trend |
| IT and Telecom | 5G rollout and hyperscaler infrastructure are driving the largest share of automation spend |
| Banking and Financial Services | Zero-trust mandates and transaction-latency optimization are fueling adoption |
| Manufacturing | Industry 4.0 campus networks require real-time, deterministic network automation |
| Healthcare | Telehealth expansion and connected medical-device security are creating new demand |
| Others | Government, energy, retail, and education verticals are contributing incremental growth |
IT and telecom operators remain the largest buyers of network automation platforms due to the sheer scale and complexity of their infrastructure. Healthcare is emerging as the fastest-growing vertical, driven by the proliferation of connected medical devices and stringent compliance frameworks requiring automated security enforcement.