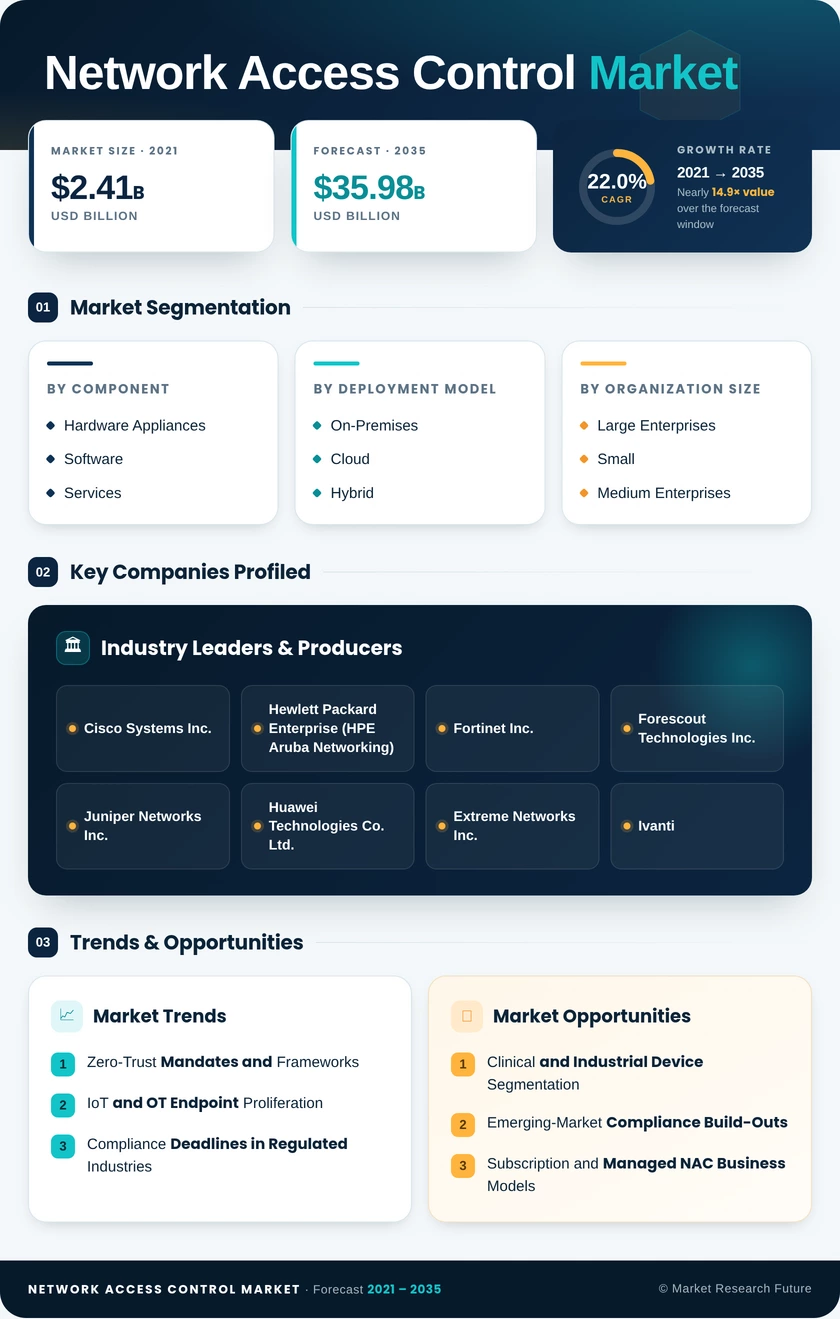
Network Access Control Market (2026 - 2035)

ID: MRFR/ICT/29768-HCR 100 Pages Nirmit Biswas Last Updated: October 24, 2026
Network Access Control Market Size, Share and Research Report: By Technology (Identity and Access Management, Network Access Control Solutions, Behavioral Analytics, Artificial Intelligence-Based Access Control, Cloud-Based NAC Solutions), By Deployment Model (On-Premises, Cloud, Hybrid), By Security Type (Endpoint Security, Network Security, Application Security), By End User (Large Enterprises, Small and Medium Enterprises, Government Organizations, Educational Institutions) and By Regional - Industry Forecast to 2035
Network Access Control Market
Market Size
Forecast Period2026-2035
CAGR (2026-2035)22.0%
2025 Market SizeUSD 4.93 Billion
2035 Market SizeUSD 35.98 Billion
Key Players
Cisco Systems Inc.
Hewlett Packard Enterprise
Fortinet Inc.
Forescout Technologies Inc.
Juniper Networks Inc.
Huawei Technologies Co. Ltd.
Opportunities
  • Clinical and Industrial Device Segmentation
  • Emerging-Market Compliance Build-Outs
  • Subscription and Managed NAC Business Models
  1. 1 SECTION I: EXECUTIVE SUMMARY AND KEY HIGHLIGHTS
    1. 1.1 EXECUTIVE SUMMARY
      1. 1.1.1 Market Overview
      2. 1.1.2 Key Findings
      3. 1.1.3 Market Segmentation
      4. 1.1.4 Competitive Landscape
      5. 1.1.5 Challenges and Opportunities
      6. 1.1.6 Future Outlook
  2. 2 SECTION II: SCOPING, METHODOLOGY AND MARKET STRUCTURE
    1. 2.1 MARKET INTRODUCTION
      1. 2.1.1 Definition
      2. 2.1.2 Scope of the study
        1. 2.1.2.1 Research Objective
        2. 2.1.2.2 Assumption
        3. 2.1.2.3 Limitations
    2. 2.2 RESEARCH METHODOLOGY
      1. 2.2.1 Overview
      2. 2.2.2 Data Mining
      3. 2.2.3 Secondary Research
      4. 2.2.4 Primary Research
        1. 2.2.4.1 Primary Interviews and Information Gathering Process
        2. 2.2.4.2 Breakdown of Primary Respondents
      5. 2.2.5 Forecasting Model
      6. 2.2.6 Market Size Estimation
        1. 2.2.6.1 Bottom-Up Approach
        2. 2.2.6.2 Top-Down Approach
      7. 2.2.7 Data Triangulation
      8. 2.2.8 Validation
  3. 3 SECTION III: QUALITATIVE ANALYSIS
    1. 3.1 MARKET DYNAMICS
      1. 3.1.1 Overview
      2. 3.1.2 Drivers
      3. 3.1.3 Restraints
      4. 3.1.4 Opportunities
    2. 3.2 MARKET FACTOR ANALYSIS
      1. 3.2.1 Value chain Analysis
      2. 3.2.2 Porter's Five Forces Analysis
        1. 3.2.2.1 Bargaining Power of Suppliers
        2. 3.2.2.2 Bargaining Power of Buyers
        3. 3.2.2.3 Threat of New Entrants
        4. 3.2.2.4 Threat of Substitutes
        5. 3.2.2.5 Intensity of Rivalry
      3. 3.2.3 COVID-19 Impact Analysis
        1. 3.2.3.1 Market Impact Analysis
        2. 3.2.3.2 Regional Impact
        3. 3.2.3.3 Opportunity and Threat Analysis
  4. 4 SECTION IV: QUANTITATIVE ANALYSIS
    1. 4.1 Information and Communications Technology, BY Technology (USD Billion)
      1. 4.1.1 Identity and Access Management
      2. 4.1.2 Network Access Control Solutions
      3. 4.1.3 Behavioral Analytics
      4. 4.1.4 Artificial Intelligence-Based Access Control
      5. 4.1.5 Cloud-Based NAC Solutions
    2. 4.2 Information and Communications Technology, BY Deployment Model (USD Billion)
      1. 4.2.1 On-Premises
      2. 4.2.2 Cloud
      3. 4.2.3 Hybrid
    3. 4.3 Information and Communications Technology, BY Security Type (USD Billion)
      1. 4.3.1 Endpoint Security
      2. 4.3.2 Network Security
      3. 4.3.3 Application Security
    4. 4.4 Information and Communications Technology, BY End User (USD Billion)
      1. 4.4.1 Large Enterprises
      2. 4.4.2 Small and Medium Enterprises
      3. 4.4.3 Government Organizations
      4. 4.4.4 Educational Institutions
    5. 4.5 Information and Communications Technology, BY Region (USD Billion)
      1. 4.5.1 North America
        1. 4.5.1.1 US
        2. 4.5.1.2 Canada
      2. 4.5.2 Europe
        1. 4.5.2.1 Germany
        2. 4.5.2.2 UK
        3. 4.5.2.3 France
        4. 4.5.2.4 Russia
        5. 4.5.2.5 Italy
        6. 4.5.2.6 Spain
        7. 4.5.2.7 Rest of Europe
      3. 4.5.3 APAC
        1. 4.5.3.1 China
        2. 4.5.3.2 India
        3. 4.5.3.3 Japan
        4. 4.5.3.4 South Korea
        5. 4.5.3.5 Malaysia
        6. 4.5.3.6 Thailand
        7. 4.5.3.7 Indonesia
        8. 4.5.3.8 Rest of APAC
      4. 4.5.4 South America
        1. 4.5.4.1 Brazil
        2. 4.5.4.2 Mexico
        3. 4.5.4.3 Argentina
        4. 4.5.4.4 Rest of South America
      5. 4.5.5 MEA
        1. 4.5.5.1 GCC Countries
        2. 4.5.5.2 South Africa
        3. 4.5.5.3 Rest of MEA
  5. 5 SECTION V: COMPETITIVE ANALYSIS
    1. 5.1 Competitive Landscape
      1. 5.1.1 Overview
      2. 5.1.2 Competitive Analysis
      3. 5.1.3 Market share Analysis
      4. 5.1.4 Major Growth Strategy in the Information and Communications Technology
      5. 5.1.5 Competitive Benchmarking
      6. 5.1.6 Leading Players in Terms of Number of Developments in the Information and Communications Technology
      7. 5.1.7 Key developments and growth strategies
        1. 5.1.7.1 New Product Launch/Service Deployment
        2. 5.1.7.2 Merger & Acquisitions
        3. 5.1.7.3 Joint Ventures
      8. 5.1.8 Major Players Financial Matrix
        1. 5.1.8.1 Sales and Operating Income
        2. 5.1.8.2 Major Players R&D Expenditure. 2023
    2. 5.2 Company Profiles
      1. 5.2.1 Cisco Systems (US)
        1. 5.2.1.1 Financial Overview
        2. 5.2.1.2 Products Offered
        3. 5.2.1.3 Key Developments
        4. 5.2.1.4 SWOT Analysis
        5. 5.2.1.5 Key Strategies
      2. 5.2.2 Aruba Networks (US)
        1. 5.2.2.1 Financial Overview
        2. 5.2.2.2 Products Offered
        3. 5.2.2.3 Key Developments
        4. 5.2.2.4 SWOT Analysis
        5. 5.2.2.5 Key Strategies
      3. 5.2.3 Fortinet (US)
        1. 5.2.3.1 Financial Overview
        2. 5.2.3.2 Products Offered
        3. 5.2.3.3 Key Developments
        4. 5.2.3.4 SWOT Analysis
        5. 5.2.3.5 Key Strategies
      4. 5.2.4 Palo Alto Networks (US)
        1. 5.2.4.1 Financial Overview
        2. 5.2.4.2 Products Offered
        3. 5.2.4.3 Key Developments
        4. 5.2.4.4 SWOT Analysis
        5. 5.2.4.5 Key Strategies
      5. 5.2.5 Hewlett Packard Enterprise (US)
        1. 5.2.5.1 Financial Overview
        2. 5.2.5.2 Products Offered
        3. 5.2.5.3 Key Developments
        4. 5.2.5.4 SWOT Analysis
        5. 5.2.5.5 Key Strategies
      6. 5.2.6 Extreme Networks (US)
        1. 5.2.6.1 Financial Overview
        2. 5.2.6.2 Products Offered
        3. 5.2.6.3 Key Developments
        4. 5.2.6.4 SWOT Analysis
        5. 5.2.6.5 Key Strategies
      7. 5.2.7 Juniper Networks (US)
        1. 5.2.7.1 Financial Overview
        2. 5.2.7.2 Products Offered
        3. 5.2.7.3 Key Developments
        4. 5.2.7.4 SWOT Analysis
        5. 5.2.7.5 Key Strategies
      8. 5.2.8 Check Point Software Technologies (IL)
        1. 5.2.8.1 Financial Overview
        2. 5.2.8.2 Products Offered
        3. 5.2.8.3 Key Developments
        4. 5.2.8.4 SWOT Analysis
        5. 5.2.8.5 Key Strategies
      9. 5.2.9 Forescout Technologies (US)
        1. 5.2.9.1 Financial Overview
        2. 5.2.9.2 Products Offered
        3. 5.2.9.3 Key Developments
        4. 5.2.9.4 SWOT Analysis
        5. 5.2.9.5 Key Strategies
    3. 5.3 Appendix
      1. 5.3.1 References
      2. 5.3.2 Related Reports
  6. 6 LIST OF FIGURES
    1. 6.1 MARKET SYNOPSIS
    2. 6.2 NORTH AMERICA MARKET ANALYSIS
    3. 6.3 US MARKET ANALYSIS BY TECHNOLOGY
    4. 6.4 US MARKET ANALYSIS BY DEPLOYMENT MODEL
    5. 6.5 US MARKET ANALYSIS BY SECURITY TYPE
    6. 6.6 US MARKET ANALYSIS BY END USER
    7. 6.7 CANADA MARKET ANALYSIS BY TECHNOLOGY
    8. 6.8 CANADA MARKET ANALYSIS BY DEPLOYMENT MODEL
    9. 6.9 CANADA MARKET ANALYSIS BY SECURITY TYPE
    10. 6.10 CANADA MARKET ANALYSIS BY END USER
    11. 6.11 EUROPE MARKET ANALYSIS
    12. 6.12 GERMANY MARKET ANALYSIS BY TECHNOLOGY
    13. 6.13 GERMANY MARKET ANALYSIS BY DEPLOYMENT MODEL
    14. 6.14 GERMANY MARKET ANALYSIS BY SECURITY TYPE
    15. 6.15 GERMANY MARKET ANALYSIS BY END USER
    16. 6.16 UK MARKET ANALYSIS BY TECHNOLOGY
    17. 6.17 UK MARKET ANALYSIS BY DEPLOYMENT MODEL
    18. 6.18 UK MARKET ANALYSIS BY SECURITY TYPE
    19. 6.19 UK MARKET ANALYSIS BY END USER
    20. 6.20 FRANCE MARKET ANALYSIS BY TECHNOLOGY
    21. 6.21 FRANCE MARKET ANALYSIS BY DEPLOYMENT MODEL
    22. 6.22 FRANCE MARKET ANALYSIS BY SECURITY TYPE
    23. 6.23 FRANCE MARKET ANALYSIS BY END USER
    24. 6.24 RUSSIA MARKET ANALYSIS BY TECHNOLOGY
    25. 6.25 RUSSIA MARKET ANALYSIS BY DEPLOYMENT MODEL
    26. 6.26 RUSSIA MARKET ANALYSIS BY SECURITY TYPE
    27. 6.27 RUSSIA MARKET ANALYSIS BY END USER
    28. 6.28 ITALY MARKET ANALYSIS BY TECHNOLOGY
    29. 6.29 ITALY MARKET ANALYSIS BY DEPLOYMENT MODEL
    30. 6.30 ITALY MARKET ANALYSIS BY SECURITY TYPE
    31. 6.31 ITALY MARKET ANALYSIS BY END USER
    32. 6.32 SPAIN MARKET ANALYSIS BY TECHNOLOGY
    33. 6.33 SPAIN MARKET ANALYSIS BY DEPLOYMENT MODEL
    34. 6.34 SPAIN MARKET ANALYSIS BY SECURITY TYPE
    35. 6.35 SPAIN MARKET ANALYSIS BY END USER
    36. 6.36 REST OF EUROPE MARKET ANALYSIS BY TECHNOLOGY
    37. 6.37 REST OF EUROPE MARKET ANALYSIS BY DEPLOYMENT MODEL
    38. 6.38 REST OF EUROPE MARKET ANALYSIS BY SECURITY TYPE
    39. 6.39 REST OF EUROPE MARKET ANALYSIS BY END USER
    40. 6.40 APAC MARKET ANALYSIS
    41. 6.41 CHINA MARKET ANALYSIS BY TECHNOLOGY
    42. 6.42 CHINA MARKET ANALYSIS BY DEPLOYMENT MODEL
    43. 6.43 CHINA MARKET ANALYSIS BY SECURITY TYPE
    44. 6.44 CHINA MARKET ANALYSIS BY END USER
    45. 6.45 INDIA MARKET ANALYSIS BY TECHNOLOGY
    46. 6.46 INDIA MARKET ANALYSIS BY DEPLOYMENT MODEL
    47. 6.47 INDIA MARKET ANALYSIS BY SECURITY TYPE
    48. 6.48 INDIA MARKET ANALYSIS BY END USER
    49. 6.49 JAPAN MARKET ANALYSIS BY TECHNOLOGY
    50. 6.50 JAPAN MARKET ANALYSIS BY DEPLOYMENT MODEL
    51. 6.51 JAPAN MARKET ANALYSIS BY SECURITY TYPE
    52. 6.52 JAPAN MARKET ANALYSIS BY END USER
    53. 6.53 SOUTH KOREA MARKET ANALYSIS BY TECHNOLOGY
    54. 6.54 SOUTH KOREA MARKET ANALYSIS BY DEPLOYMENT MODEL
    55. 6.55 SOUTH KOREA MARKET ANALYSIS BY SECURITY TYPE
    56. 6.56 SOUTH KOREA MARKET ANALYSIS BY END USER
    57. 6.57 MALAYSIA MARKET ANALYSIS BY TECHNOLOGY
    58. 6.58 MALAYSIA MARKET ANALYSIS BY DEPLOYMENT MODEL
    59. 6.59 MALAYSIA MARKET ANALYSIS BY SECURITY TYPE
    60. 6.60 MALAYSIA MARKET ANALYSIS BY END USER
    61. 6.61 THAILAND MARKET ANALYSIS BY TECHNOLOGY
    62. 6.62 THAILAND MARKET ANALYSIS BY DEPLOYMENT MODEL
    63. 6.63 THAILAND MARKET ANALYSIS BY SECURITY TYPE
    64. 6.64 THAILAND MARKET ANALYSIS BY END USER
    65. 6.65 INDONESIA MARKET ANALYSIS BY TECHNOLOGY
    66. 6.66 INDONESIA MARKET ANALYSIS BY DEPLOYMENT MODEL
    67. 6.67 INDONESIA MARKET ANALYSIS BY SECURITY TYPE
    68. 6.68 INDONESIA MARKET ANALYSIS BY END USER
    69. 6.69 REST OF APAC MARKET ANALYSIS BY TECHNOLOGY
    70. 6.70 REST OF APAC MARKET ANALYSIS BY DEPLOYMENT MODEL
    71. 6.71 REST OF APAC MARKET ANALYSIS BY SECURITY TYPE
    72. 6.72 REST OF APAC MARKET ANALYSIS BY END USER
    73. 6.73 SOUTH AMERICA MARKET ANALYSIS
    74. 6.74 BRAZIL MARKET ANALYSIS BY TECHNOLOGY
    75. 6.75 BRAZIL MARKET ANALYSIS BY DEPLOYMENT MODEL
    76. 6.76 BRAZIL MARKET ANALYSIS BY SECURITY TYPE
    77. 6.77 BRAZIL MARKET ANALYSIS BY END USER
    78. 6.78 MEXICO MARKET ANALYSIS BY TECHNOLOGY
    79. 6.79 MEXICO MARKET ANALYSIS BY DEPLOYMENT MODEL
    80. 6.80 MEXICO MARKET ANALYSIS BY SECURITY TYPE
    81. 6.81 MEXICO MARKET ANALYSIS BY END USER
    82. 6.82 ARGENTINA MARKET ANALYSIS BY TECHNOLOGY
    83. 6.83 ARGENTINA MARKET ANALYSIS BY DEPLOYMENT MODEL
    84. 6.84 ARGENTINA MARKET ANALYSIS BY SECURITY TYPE
    85. 6.85 ARGENTINA MARKET ANALYSIS BY END USER
    86. 6.86 REST OF SOUTH AMERICA MARKET ANALYSIS BY TECHNOLOGY
    87. 6.87 REST OF SOUTH AMERICA MARKET ANALYSIS BY DEPLOYMENT MODEL
    88. 6.88 REST OF SOUTH AMERICA MARKET ANALYSIS BY SECURITY TYPE
    89. 6.89 REST OF SOUTH AMERICA MARKET ANALYSIS BY END USER
    90. 6.90 MEA MARKET ANALYSIS
    91. 6.91 GCC COUNTRIES MARKET ANALYSIS BY TECHNOLOGY
    92. 6.92 GCC COUNTRIES MARKET ANALYSIS BY DEPLOYMENT MODEL
    93. 6.93 GCC COUNTRIES MARKET ANALYSIS BY SECURITY TYPE
    94. 6.94 GCC COUNTRIES MARKET ANALYSIS BY END USER
    95. 6.95 SOUTH AFRICA MARKET ANALYSIS BY TECHNOLOGY
    96. 6.96 SOUTH AFRICA MARKET ANALYSIS BY DEPLOYMENT MODEL
    97. 6.97 SOUTH AFRICA MARKET ANALYSIS BY SECURITY TYPE
    98. 6.98 SOUTH AFRICA MARKET ANALYSIS BY END USER
    99. 6.99 REST OF MEA MARKET ANALYSIS BY TECHNOLOGY
    100. 6.100 REST OF MEA MARKET ANALYSIS BY DEPLOYMENT MODEL
    101. 6.101 REST OF MEA MARKET ANALYSIS BY SECURITY TYPE
    102. 6.102 REST OF MEA MARKET ANALYSIS BY END USER
    103. 6.103 KEY BUYING CRITERIA OF INFORMATION AND COMMUNICATIONS TECHNOLOGY
    104. 6.104 RESEARCH PROCESS OF MRFR
    105. 6.105 DRO ANALYSIS OF INFORMATION AND COMMUNICATIONS TECHNOLOGY
    106. 6.106 DRIVERS IMPACT ANALYSIS: INFORMATION AND COMMUNICATIONS TECHNOLOGY
    107. 6.107 RESTRAINTS IMPACT ANALYSIS: INFORMATION AND COMMUNICATIONS TECHNOLOGY
    108. 6.108 SUPPLY / VALUE CHAIN: INFORMATION AND COMMUNICATIONS TECHNOLOGY
    109. 6.109 INFORMATION AND COMMUNICATIONS TECHNOLOGY, BY TECHNOLOGY, 2024 (% SHARE)
    110. 6.110 INFORMATION AND COMMUNICATIONS TECHNOLOGY, BY TECHNOLOGY, 2024 TO 2035 (USD Billion)
    111. 6.111 INFORMATION AND COMMUNICATIONS TECHNOLOGY, BY DEPLOYMENT MODEL, 2024 (% SHARE)
    112. 6.112 INFORMATION AND COMMUNICATIONS TECHNOLOGY, BY DEPLOYMENT MODEL, 2024 TO 2035 (USD Billion)
    113. 6.113 INFORMATION AND COMMUNICATIONS TECHNOLOGY, BY SECURITY TYPE, 2024 (% SHARE)
    114. 6.114 INFORMATION AND COMMUNICATIONS TECHNOLOGY, BY SECURITY TYPE, 2024 TO 2035 (USD Billion)
    115. 6.115 INFORMATION AND COMMUNICATIONS TECHNOLOGY, BY END USER, 2024 (% SHARE)
    116. 6.116 INFORMATION AND COMMUNICATIONS TECHNOLOGY, BY END USER, 2024 TO 2035 (USD Billion)
    117. 6.117 BENCHMARKING OF MAJOR COMPETITORS
  7. 7 LIST OF TABLES
    1. 7.1 LIST OF ASSUMPTIONS
  8. 7.1.1
    1. 7.2 North America MARKET SIZE ESTIMATES; FORECAST
      1. 7.2.1 BY TECHNOLOGY, 2025-2035 (USD Billion)
      2. 7.2.2 BY DEPLOYMENT MODEL, 2025-2035 (USD Billion)
      3. 7.2.3 BY SECURITY TYPE, 2025-2035 (USD Billion)
      4. 7.2.4 BY END USER, 2025-2035 (USD Billion)
    2. 7.3 US MARKET SIZE ESTIMATES; FORECAST
      1. 7.3.1 BY TECHNOLOGY, 2025-2035 (USD Billion)
      2. 7.3.2 BY DEPLOYMENT MODEL, 2025-2035 (USD Billion)
      3. 7.3.3 BY SECURITY TYPE, 2025-2035 (USD Billion)
      4. 7.3.4 BY END USER, 2025-2035 (USD Billion)
    3. 7.4 Canada MARKET SIZE ESTIMATES; FORECAST
      1. 7.4.1 BY TECHNOLOGY, 2025-2035 (USD Billion)
      2. 7.4.2 BY DEPLOYMENT MODEL, 2025-2035 (USD Billion)
      3. 7.4.3 BY SECURITY TYPE, 2025-2035 (USD Billion)
      4. 7.4.4 BY END USER, 2025-2035 (USD Billion)
    4. 7.5 Europe MARKET SIZE ESTIMATES; FORECAST
      1. 7.5.1 BY TECHNOLOGY, 2025-2035 (USD Billion)
      2. 7.5.2 BY DEPLOYMENT MODEL, 2025-2035 (USD Billion)
      3. 7.5.3 BY SECURITY TYPE, 2025-2035 (USD Billion)
      4. 7.5.4 BY END USER, 2025-2035 (USD Billion)
    5. 7.6 Germany MARKET SIZE ESTIMATES; FORECAST
      1. 7.6.1 BY TECHNOLOGY, 2025-2035 (USD Billion)
      2. 7.6.2 BY DEPLOYMENT MODEL, 2025-2035 (USD Billion)
      3. 7.6.3 BY SECURITY TYPE, 2025-2035 (USD Billion)
      4. 7.6.4 BY END USER, 2025-2035 (USD Billion)
    6. 7.7 UK MARKET SIZE ESTIMATES; FORECAST
      1. 7.7.1 BY TECHNOLOGY, 2025-2035 (USD Billion)
      2. 7.7.2 BY DEPLOYMENT MODEL, 2025-2035 (USD Billion)
      3. 7.7.3 BY SECURITY TYPE, 2025-2035 (USD Billion)
      4. 7.7.4 BY END USER, 2025-2035 (USD Billion)
    7. 7.8 France MARKET SIZE ESTIMATES; FORECAST
      1. 7.8.1 BY TECHNOLOGY, 2025-2035 (USD Billion)
      2. 7.8.2 BY DEPLOYMENT MODEL, 2025-2035 (USD Billion)
      3. 7.8.3 BY SECURITY TYPE, 2025-2035 (USD Billion)
      4. 7.8.4 BY END USER, 2025-2035 (USD Billion)
    8. 7.9 Russia MARKET SIZE ESTIMATES; FORECAST
      1. 7.9.1 BY TECHNOLOGY, 2025-2035 (USD Billion)
      2. 7.9.2 BY DEPLOYMENT MODEL, 2025-2035 (USD Billion)
      3. 7.9.3 BY SECURITY TYPE, 2025-2035 (USD Billion)
      4. 7.9.4 BY END USER, 2025-2035 (USD Billion)
    9. 7.10 Italy MARKET SIZE ESTIMATES; FORECAST
      1. 7.10.1 BY TECHNOLOGY, 2025-2035 (USD Billion)
      2. 7.10.2 BY DEPLOYMENT MODEL, 2025-2035 (USD Billion)
      3. 7.10.3 BY SECURITY TYPE, 2025-2035 (USD Billion)
      4. 7.10.4 BY END USER, 2025-2035 (USD Billion)
    10. 7.11 Spain MARKET SIZE ESTIMATES; FORECAST
      1. 7.11.1 BY TECHNOLOGY, 2025-2035 (USD Billion)
      2. 7.11.2 BY DEPLOYMENT MODEL, 2025-2035 (USD Billion)
      3. 7.11.3 BY SECURITY TYPE, 2025-2035 (USD Billion)
      4. 7.11.4 BY END USER, 2025-2035 (USD Billion)
    11. 7.12 Rest of Europe MARKET SIZE ESTIMATES; FORECAST
      1. 7.12.1 BY TECHNOLOGY, 2025-2035 (USD Billion)
      2. 7.12.2 BY DEPLOYMENT MODEL, 2025-2035 (USD Billion)
      3. 7.12.3 BY SECURITY TYPE, 2025-2035 (USD Billion)
      4. 7.12.4 BY END USER, 2025-2035 (USD Billion)
    12. 7.13 APAC MARKET SIZE ESTIMATES; FORECAST
      1. 7.13.1 BY TECHNOLOGY, 2025-2035 (USD Billion)
      2. 7.13.2 BY DEPLOYMENT MODEL, 2025-2035 (USD Billion)
      3. 7.13.3 BY SECURITY TYPE, 2025-2035 (USD Billion)
      4. 7.13.4 BY END USER, 2025-2035 (USD Billion)
    13. 7.14 China MARKET SIZE ESTIMATES; FORECAST
      1. 7.14.1 BY TECHNOLOGY, 2025-2035 (USD Billion)
      2. 7.14.2 BY DEPLOYMENT MODEL, 2025-2035 (USD Billion)
      3. 7.14.3 BY SECURITY TYPE, 2025-2035 (USD Billion)
      4. 7.14.4 BY END USER, 2025-2035 (USD Billion)
    14. 7.15 India MARKET SIZE ESTIMATES; FORECAST
      1. 7.15.1 BY TECHNOLOGY, 2025-2035 (USD Billion)
      2. 7.15.2 BY DEPLOYMENT MODEL, 2025-2035 (USD Billion)
      3. 7.15.3 BY SECURITY TYPE, 2025-2035 (USD Billion)
      4. 7.15.4 BY END USER, 2025-2035 (USD Billion)
    15. 7.16 Japan MARKET SIZE ESTIMATES; FORECAST
      1. 7.16.1 BY TECHNOLOGY, 2025-2035 (USD Billion)
      2. 7.16.2 BY DEPLOYMENT MODEL, 2025-2035 (USD Billion)
      3. 7.16.3 BY SECURITY TYPE, 2025-2035 (USD Billion)
      4. 7.16.4 BY END USER, 2025-2035 (USD Billion)
    16. 7.17 South Korea MARKET SIZE ESTIMATES; FORECAST
      1. 7.17.1 BY TECHNOLOGY, 2025-2035 (USD Billion)
      2. 7.17.2 BY DEPLOYMENT MODEL, 2025-2035 (USD Billion)
      3. 7.17.3 BY SECURITY TYPE, 2025-2035 (USD Billion)
      4. 7.17.4 BY END USER, 2025-2035 (USD Billion)
    17. 7.18 Malaysia MARKET SIZE ESTIMATES; FORECAST
      1. 7.18.1 BY TECHNOLOGY, 2025-2035 (USD Billion)
      2. 7.18.2 BY DEPLOYMENT MODEL, 2025-2035 (USD Billion)
      3. 7.18.3 BY SECURITY TYPE, 2025-2035 (USD Billion)
      4. 7.18.4 BY END USER, 2025-2035 (USD Billion)
    18. 7.19 Thailand MARKET SIZE ESTIMATES; FORECAST
      1. 7.19.1 BY TECHNOLOGY, 2025-2035 (USD Billion)
      2. 7.19.2 BY DEPLOYMENT MODEL, 2025-2035 (USD Billion)
      3. 7.19.3 BY SECURITY TYPE, 2025-2035 (USD Billion)
      4. 7.19.4 BY END USER, 2025-2035 (USD Billion)
    19. 7.20 Indonesia MARKET SIZE ESTIMATES; FORECAST
      1. 7.20.1 BY TECHNOLOGY, 2025-2035 (USD Billion)
      2. 7.20.2 BY DEPLOYMENT MODEL, 2025-2035 (USD Billion)
      3. 7.20.3 BY SECURITY TYPE, 2025-2035 (USD Billion)
      4. 7.20.4 BY END USER, 2025-2035 (USD Billion)
    20. 7.21 Rest of APAC MARKET SIZE ESTIMATES; FORECAST
      1. 7.21.1 BY TECHNOLOGY, 2025-2035 (USD Billion)
      2. 7.21.2 BY DEPLOYMENT MODEL, 2025-2035 (USD Billion)
      3. 7.21.3 BY SECURITY TYPE, 2025-2035 (USD Billion)
      4. 7.21.4 BY END USER, 2025-2035 (USD Billion)
    21. 7.22 South America MARKET SIZE ESTIMATES; FORECAST
      1. 7.22.1 BY TECHNOLOGY, 2025-2035 (USD Billion)
      2. 7.22.2 BY DEPLOYMENT MODEL, 2025-2035 (USD Billion)
      3. 7.22.3 BY SECURITY TYPE, 2025-2035 (USD Billion)
      4. 7.22.4 BY END USER, 2025-2035 (USD Billion)
    22. 7.23 Brazil MARKET SIZE ESTIMATES; FORECAST
      1. 7.23.1 BY TECHNOLOGY, 2025-2035 (USD Billion)
      2. 7.23.2 BY DEPLOYMENT MODEL, 2025-2035 (USD Billion)
      3. 7.23.3 BY SECURITY TYPE, 2025-2035 (USD Billion)
      4. 7.23.4 BY END USER, 2025-2035 (USD Billion)
    23. 7.24 Mexico MARKET SIZE ESTIMATES; FORECAST
      1. 7.24.1 BY TECHNOLOGY, 2025-2035 (USD Billion)
      2. 7.24.2 BY DEPLOYMENT MODEL, 2025-2035 (USD Billion)
      3. 7.24.3 BY SECURITY TYPE, 2025-2035 (USD Billion)
      4. 7.24.4 BY END USER, 2025-2035 (USD Billion)
    24. 7.25 Argentina MARKET SIZE ESTIMATES; FORECAST
      1. 7.25.1 BY TECHNOLOGY, 2025-2035 (USD Billion)
      2. 7.25.2 BY DEPLOYMENT MODEL, 2025-2035 (USD Billion)
      3. 7.25.3 BY SECURITY TYPE, 2025-2035 (USD Billion)
      4. 7.25.4 BY END USER, 2025-2035 (USD Billion)
    25. 7.26 Rest of South America MARKET SIZE ESTIMATES; FORECAST
      1. 7.26.1 BY TECHNOLOGY, 2025-2035 (USD Billion)
      2. 7.26.2 BY DEPLOYMENT MODEL, 2025-2035 (USD Billion)
      3. 7.26.3 BY SECURITY TYPE, 2025-2035 (USD Billion)
      4. 7.26.4 BY END USER, 2025-2035 (USD Billion)
    26. 7.27 MEA MARKET SIZE ESTIMATES; FORECAST
      1. 7.27.1 BY TECHNOLOGY, 2025-2035 (USD Billion)
      2. 7.27.2 BY DEPLOYMENT MODEL, 2025-2035 (USD Billion)
      3. 7.27.3 BY SECURITY TYPE, 2025-2035 (USD Billion)
      4. 7.27.4 BY END USER, 2025-2035 (USD Billion)
    27. 7.28 GCC Countries MARKET SIZE ESTIMATES; FORECAST
      1. 7.28.1 BY TECHNOLOGY, 2025-2035 (USD Billion)
      2. 7.28.2 BY DEPLOYMENT MODEL, 2025-2035 (USD Billion)
      3. 7.28.3 BY SECURITY TYPE, 2025-2035 (USD Billion)
      4. 7.28.4 BY END USER, 2025-2035 (USD Billion)
    28. 7.29 South Africa MARKET SIZE ESTIMATES; FORECAST
      1. 7.29.1 BY TECHNOLOGY, 2025-2035 (USD Billion)
      2. 7.29.2 BY DEPLOYMENT MODEL, 2025-2035 (USD Billion)
      3. 7.29.3 BY SECURITY TYPE, 2025-2035 (USD Billion)
      4. 7.29.4 BY END USER, 2025-2035 (USD Billion)
    29. 7.30 Rest of MEA MARKET SIZE ESTIMATES; FORECAST
      1. 7.30.1 BY TECHNOLOGY, 2025-2035 (USD Billion)
      2. 7.30.2 BY DEPLOYMENT MODEL, 2025-2035 (USD Billion)
      3. 7.30.3 BY SECURITY TYPE, 2025-2035 (USD Billion)
      4. 7.30.4 BY END USER, 2025-2035 (USD Billion)
    30. 7.31 PRODUCT LAUNCH/PRODUCT DEVELOPMENT/APPROVAL
  9. 7.31.1
    1. 7.32 ACQUISITION/PARTNERSHIP
  10. 7.32.1
Dimension Sub-Segments Dominant Segment Fastest Growing Segment
By Component Hardware Appliances, Software, Services Hardware Appliances Software
By Deployment Model On-Premises, Cloud, Hybrid On-Premises Cloud
By Organization Size Large Enterprises, Small and Medium Enterprises Large Enterprises Small and Medium Enterprises
By Authentication Method 802.1X, MAC Authentication Bypass, Captive Portal 802.1X MAC Authentication Bypass
By End-User Industry IT and Telecommunications, BFSI, Healthcare, Manufacturing, Energy and Utilities, Others IT and Telecommunications BFSI
By Region North America, Europe, Asia-Pacific, South America, Middle East & Africa North America Asia-Pacific


Market Segmentation Overview

By Component

Sub-Segment Key Trend
Hardware Appliances Data residency and low-latency local enforcement
Software Virtual appliances on existing compute
Services Policy design, integration, managed operations


Within the Network Access Control Market, Hardware Appliances lead because dedicated enforcement boxes satisfy auditors in defense, government, and banking sites where traffic must stay on premises. Software appeals to buyers running virtual appliances on existing hypervisors, trading physical isolation for flexibility. Services expand fastest as organizations learn that failed enforcement phases cost more than expert help; healthcare providers pay for regulatory expertise during device onboarding, and training packages let internal teams take over daily tuning.

By Deployment Model

Sub-Segment Key Trend
On-Premises Control, data residency, air-gapped sites
Cloud No hardware, elastic capacity, rapid updates
Hybrid Local enforcement with centralized analytics


Deployment choice in the Network Access Control Market now depends on regulatory scope and organizational maturity more than technical capability.On-Premises remains the largest model where sovereignty and control rules prevail. Cloud grows fastest because pilots start in days, feature updates arrive continuously, and distributed enterprises can enforce uniform policy across hundreds of sites without shipping hardware. Hybrid lets firms keep enforcement local while consolidating analytics and policy management in the cloud.

By Organization Size

Sub-Segment Key Trend
Large Enterprises Multi-site networks, mature security budgets
Small and Medium Enterprises Subscription pricing, simplified dashboards.


Large Enterprises dominate the Network Access Control Market because layered networks, mergers, and regulatory scrutiny demand comprehensive tooling and integration with existing identity and SIEM platforms. Small and Medium Enterprises grow faster, helped by cloud delivery, default policy templates, and entry bundles priced for modest budgets [24]. Vendors now design onboarding wizards and pre-built compliance reports so firms without dedicated security staff can still meet insurer and regulator expectations.

By Authentication Method

Sub-Segment Key Trend
802.1X Certificate-based authentication of managed devices
MAC Authentication Bypass Sensors and controllers without supplicants
Captive Portal Guest networking and IoT onboarding


The Network Access Control Market still relies on 802.1X as the standard for corporate-managed laptops and phones, where certificates provide strong, auditable identity. MAC Authentication Bypass fills gaps for sensors, printers, and controllers that cannot run a supplicant, though it depends on accurate profiling to resist spoofing. Captive Portal grows fastest as guest networks and IoT onboarding expand, and cloud-hosted portals now add posture checks during web sign-on without degrading the user experience.

By End-User Industry

Sub-Segment Key Trend
IT and Telecommunications Large infrastructure footprints, mature security programs
BFSI Audit trails and device identity mandates
Healthcare Medical device segmentation, HIPAA updates
Manufacturing OT segmentation, smart factory programs
Energy and Utilities Critical infrastructure regulation
Others Government, education, and retail networks


IT and Telecommunications lead the Network Access Control Market thanks to long-standing security investment and vast infrastructure footprints. BFSI grows fastest because regulators expect proof of every device identity entering sensitive networks, driving continuous posture assessment, and PCI DSS v4.0 tightened segmentation further [5]. Healthcare follows closely as proposed HIPAA rules spotlight medical devices [6], while Manufacturing and Energy and Utilities depend heavily on vertical consulting to work around operating constraints.


Download PDF ×

We do not share your information with anyone. However, we may send you emails based on your report interest from time to time. You may contact us at any time to opt-out.