• Cat-intel
  • MedIntelliX
  • Resources
  • About Us
  • Hero Background
    English
    Chinese
    French
    Japanese
    Korean
    German
    Spanish

    Natural Surfactants Market Analysis

    ID: MRFR/CnM/10018-HCR
    128 Pages
    Priya Nagrale
    October 2025

    Natural Surfactants Market Research Report Information By Product (Anionics, Nonionics, Cationics, and Amphoterics), By Application (Detergents, Industrial & Institutional, Personal Care, Oilfield Chemicals, and Others), And By Region (North America, Europe, Asia-Pacific, And Rest Of The World) –Market Forecast Till 2035

    Share:
    Download PDF ×

    We do not share your information with anyone. However, we may send you emails based on your report interest from time to time. You may contact us at any time to opt-out.

    Natural Surfactants Market Infographic
    $ 4,950.0
    $ 5,950.0
    $ 7,250.0

    Market Analysis

    In-depth Analysis of Natural Surfactants Market Industry Landscape

    The current beneficial greater lifetime of natural surfactants compared to synthetic types is a leading trend in the market, which promotes a targeted demand for environmentally-friendly and sustainable products. Among surfactants, or surface-active agents, soapy cleaning solutions and formulated products for personal care undoubtedly hold great importance. In the recent past the society has shown a remarkable growing sensitivity toward the sustainability of using chemical-based surfactants as a result consumer have shown an increased curves in their preferences for natural alternatives. The growing threat of environmental insecurity is found to be serving as one of the major motivating factors of the market landscaping. With this growth in awareness, citizens are becoming more cautious of the aftermath of their choices, thus surfactants which are naturally occurring and derived from renewable sources continue to be looked for by the producers. There is a significant connection between this trend and the global movement aimed at decreasing the amount of carbon emissions while increasing investments in eco-friendly technologies. Consequently, the melting players are seizing the moment and investing in developing research and development of the innovative pseudo natural surfactant formulas that not only would meet the performance standards but also follow the strict environmental regulations. The cosmetic and personal care industry is an important segment in the surfactants market which is also the driving force of natural surfactants in the market. With consumers being much more into natural and organic style beauty products, production companies have to change their offerings so as to include natural and biodegradable cleansers. Where traditional detergent chemicals are derived from petroleum or chemical compounds, these surfactants are now plant-based or other bio-based materials tailored toward the demand for milder formulations that do not compromise on the effectiveness of the product. This shift is forcing product manufacturers to re-think product mixes and, consequently, branding and advertising campaigns among them. Furthermore there is the increasing use of environmentally friendlier surfactants in the agriculture sector as well. They are able to do so through the formulations of agricultural products like the pesticides and the herbicides, to give better performance. If one looks deeper, one can see that the sustainable and organic agriculture tendency together with the natural surfactants concept that are safer and less harmful to the environment makes the demand for natural surfactants increase more and more. The agribusiness sector is continually finding greener alternatives to solve their production challenges, and natural surfactant has its part to play by benefiting from the green shift. Another issues that change market behavior is regulating condition. Governments world wide are putting more control on the way in which certain chemicals such as those in shooting are used by consumers. Due to the nature of the residuals from surrogate substances, their increased analysis and use of the natural ingredients emerged among producers. In addition to market access, compliance with environmental compliance ensures good company image which creates more following toward natural surfactant demand.

    Market Summary

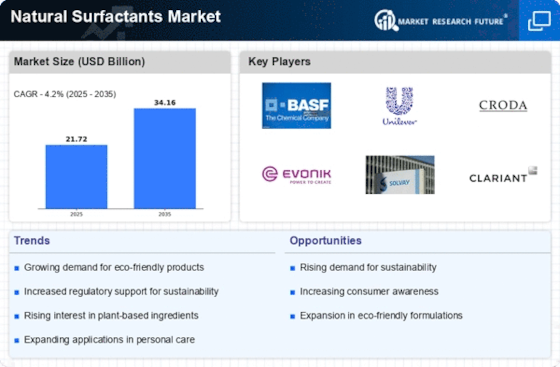
    The Global Natural Surfactants Market is projected to grow from 21.72 USD Billion in 2024 to 34.16 USD Billion by 2035.

    Key Market Trends & Highlights

    Natural Surfactants Key Trends and Highlights

    • The market is expected to experience a compound annual growth rate (CAGR) of 4.2 percent from 2025 to 2035.
    • By 2035, the market valuation is anticipated to reach 34.2 USD Billion, reflecting a robust growth trajectory.
    • in 2024, the market is valued at 21.72 USD Billion, indicating a solid foundation for future expansion.
    • Growing adoption of eco-friendly products due to increasing consumer awareness is a major market driver.

    Market Size & Forecast

    2024 Market Size 21.72 (USD Billion)
    2035 Market Size 34.16 (USD Billion)
    CAGR (2025-2035) 4.20%
    Largest Regional Market Share in 2024 latin_america)

    Major Players

    BASF SE, Clariant AG, Croda International Plc., WHEATOLEO, The Dow Chemical Company, CECA Arkema Group, SEPPIC, Evonik Industries, Innovative Chemical Technologies

    Market Trends

    Increasing demand for detergents is driving the market growth

    Examples of household detergents that are sold in stores include carpet cleaners, laundry detergents, and dishwasher detergents. About half of the total usage of natural surfactants comes from this sector. Laundry detergents' main function is to remove dirt from clothing so that it can be suspended in the water while being washed. In the last rinse, fabric softeners are used. Dishwasher detergents use surfactants to moisten surfaces and help remove soil. To stop the dishwasher from foaming, automated dishwasher detergents include less surfactant than manual dishwashing detergents.

    To stop the dishwasher from foaming, automatic dishwasher detergents include less surfactant than hand dishwashing detergents. Sales of automated and hand dishwashing detergent are about equal in pounds.

    The first to adopt non-petroleum-based products are shoppers in Western Europe and Japan, who appear to be more conscious of environmental concerns around surfactant use. Oleochemical-based surfactants caught the attention of both customers and consumer product formulators in 2007–2008 because to the sharp increase in the price of crude oil. The main factors influencing market acceptance at the moment are environmental concerns, the enforcement of regulations, and changing oil prices. The industrial manufacturing of detergents and cosmetics, two industries where environmental concerns are more common, is anticipated to have a significant impact on the demand for natural surfactants.

    Designing formulations organically rather than through chemical channels is preferable because protection is so crucial in the cosmetics sector.

    It is believed that the industrial activities in the more heavily environmental-conscious industries of detergents and cosmetics will have a significant impact on the total demand for natural surfactants. The development of items organically is advantageous since it is more secure than chemical pathways due to the significance of safety in the cosmetics business. Thus, driving the natural surfactants market revenue.

    The increasing consumer preference for eco-friendly products is driving a notable shift towards natural surfactants, which are perceived as safer and more sustainable alternatives in various applications.

    U.S. Environmental Protection Agency

    Natural Surfactants Market Market Drivers

    Market Growth Projections

    The Global Natural Surfactants Market Industry is projected to experience substantial growth in the coming years. With a market value of 21.7 USD Billion in 2024, it is anticipated to reach 34.2 USD Billion by 2035, reflecting a compound annual growth rate of 4.2% from 2025 to 2035. This growth is driven by various factors, including increasing consumer demand for sustainable products, regulatory support for natural ingredients, and advancements in production technologies. The market's expansion is indicative of a broader trend towards sustainability and health consciousness among consumers, positioning natural surfactants as a pivotal component in future product formulations.

    Rising Awareness of Health and Safety

    There is a growing awareness regarding health and safety among consumers, which is positively impacting the Global Natural Surfactants Market Industry. Natural surfactants are perceived as safer alternatives to synthetic chemicals, particularly in personal care and cleaning products. This trend is reflected in consumer preferences, as many individuals are now scrutinizing ingredient lists for harmful substances. The market's expansion is further supported by the increasing availability of natural surfactants, which are often marketed as hypoallergenic and non-toxic. This heightened awareness is likely to contribute to a compound annual growth rate of 4.2% from 2025 to 2035, indicating a robust future for natural surfactants.

    Diverse Applications Across Industries

    The versatility of natural surfactants across various industries is a key driver of the Global Natural Surfactants Market Industry. These surfactants find applications in personal care, household cleaning, and industrial processes, among others. Their multifunctional properties, such as emulsification, wetting, and foaming, make them suitable for a wide range of products. As industries increasingly adopt natural ingredients, the demand for natural surfactants is expected to rise, contributing to the market's growth trajectory. This diversification not only enhances market resilience but also opens up new opportunities for innovation and product development.

    Growing Demand for Eco-Friendly Products

    The Global Natural Surfactants Market Industry is witnessing an increasing demand for eco-friendly products as consumers become more environmentally conscious. This shift is evident in various sectors, including personal care and household cleaning, where natural surfactants are preferred over synthetic alternatives. The market is projected to reach 21.7 USD Billion in 2024, reflecting a significant consumer trend towards sustainability. Companies are responding by reformulating products to include natural surfactants, which are derived from renewable resources. This trend not only caters to consumer preferences but also aligns with regulatory pressures aimed at reducing environmental impact.

    Technological Advancements in Production

    Technological advancements in the production of natural surfactants are significantly influencing the Global Natural Surfactants Market Industry. Innovations in extraction and processing techniques have improved the efficiency and cost-effectiveness of producing natural surfactants. These advancements enable manufacturers to scale up production while maintaining product quality, thus meeting the rising demand. As a result, the market is poised for growth, with expectations of reaching 34.2 USD Billion by 2035. Additionally, these technologies facilitate the development of new surfactant formulations that cater to specific consumer needs, further driving market expansion.

    Regulatory Support for Sustainable Ingredients

    Regulatory frameworks globally are increasingly favoring the use of sustainable ingredients, which bolsters the Global Natural Surfactants Market Industry. Governments are implementing stricter regulations on synthetic chemicals, prompting manufacturers to seek natural alternatives. This regulatory support is crucial as it encourages innovation and investment in natural surfactant production. As a result, the market is expected to grow steadily, with projections indicating a rise to 34.2 USD Billion by 2035. This growth is likely to be driven by the need for compliance with environmental standards, thus enhancing the appeal of natural surfactants in various applications.

    Market Segment Insights

    Natural Surfactants Product Insights

    Based on product, the natural surfactants market is segmented into Anionics, Nonionics, Cationics, and Amphoterics. Anionic category dominate the surfactant market, which includes uses in dishwashing and laundry. The three most prevalent anionic surfactants in terms of volume are linear alkylbenzene sulfonates (LAS), alcohol ether sulfates (AES), and alpha-olefin sulfonates (AOS). The two major sustainable anionic surfactants, alcohol ether sulfate (AES) and methyl ester sulfonate (MES), are produced from palm or coconut oil. MES can be used in place of LAS because it is biodegradable.

    Figure 1: Natural Surfactants Market, by Product, 2022 & 2032 (USD Billion)Source: Secondary Research, Primary Research, Market Research Future Database and Analyst Review

    Natural Surfactants Application Insights

    On the basis of the application, the bio-based surfactants market is classified into detergents, industrial & institutional, personal care, oilfield chemicals, and others. The detergents segment accounted for the largest share of the global market and is expected to grow rapidly during the forecast period. Due to the growing adoption of washing machines in developing nations, demand is anticipated to increase. A number of vendors set up factories in developing nations where there are abundant business opportunities in an effort to increase their footprint. The rising use of washing machines in homes in developing nations' economy supports this tendency.

    For instance, Indian consumers overwhelmingly favored fully automated washing machines to semi-automatic ones. In general, urban areas have a higher need for washing machines than rural ones.

    Get more detailed insights about Natural Surfactants Market Research Report—Global Forecast till 2034

    Regional Insights

    By Region, the study provides the market insights into North America, Europe, Asia-Pacific and Rest of the World. In 2022, the European natural surfactants market held a highest share. It is anticipated that the rising demand for oilfield chemicals and detergents will propel regional market expansion. One of the main factors propelling the market's expansion is the rising acceptance of bio-based products as a result of widespread knowledge about the harmful effects of chemical surfactants on the environment and human health.

    Further, the German natural surfactants market held the largest market share, and the U.K. natural surfactants market was the fastest growing market in the European region.

    Further, the major countries studied in the market report are The U.S., Canada, German, France, the U.K., Italy, Spain, China, Japan, India, Australia, South Korea, and Brazil.

    Figure 2: NATURAL SURFACTANTS MARKET SHARE BY REGION 2022 (%)NATURAL SURFACTANTS MARKET SHARE BY REGION 2022Source: Secondary Research, Primary Research, Market Research Future Database and Analyst Review

    Owing to a number of variables, including governmental regulations and the rising demand for chemical-free surfactants, North America natural surfactants market maintained a sizable stake. Due to the possible harmful effects of conventional surfactants on the skin, consumers' preferences for natural goods and components are expected to shift in a significant way. For instance, surfactants that satisfy the safer choice requirements are authorized for use in safer choice products, according to the Environmental Protection Agency (EPA).

    Further, the U.S. natural surfactants market held the largest market share, and the Canada natural surfactants market was the fastest growing market in the North America region.

    In terms of industrialization and growth, the Asia-Pacific natural surfactants market is among those that are expanding quickly. The region's expansion will be fueled by the growing investments made by multinational businesses to establish industrial facilities in South Asian nations like China, India, South Korea, and others due to the accessibility of labor and raw materials. Also, the industry will benefit from the rising demand for detergent and personal care goods brought on by a huge population.

    Moreover, China’s natural surfactants market held the largest market share, and the Indian natural surfactants market was the fastest growing market in the Asia-Pacific region.

    Key Players and Competitive Insights

    Leading market players are investing heavily in research and development in order to expand their product lines, which will help the Natural Surfactants market, grow even more. Market participants are also undertaking a variety of strategic activities to expand their global footprint, with important market developments including new product launches, contractual agreements, mergers and acquisitions, higher investments, and collaboration with other organizations. To expand and survive in a more competitive and rising market climate, Natural Surfactants industry must offer cost-effective items.

    Manufacturing locally to minimize operational costs is one of the key business tactics used by manufacturers in the global Natural Surfactants industry to benefit clients and increase the market sector. In recent years, the Natural Surfactants industry has offered some of the most significant advantages to medicine. Major players in the Natural Surfactants market, including BASF SE, Clariant AG, Croda International Plc., WHEATOLEO, The Dow Chemical Company, CECA Arkema Group, SEPPIC, Evonik Industries, and Innovative Chemical Technologies.

    Material science is the focus of Dow Inc. (Dow). The Dow Chemical Co., the company's wholly owned subsidiary, conducts business on its behalf (TDCC). Plastics, performance materials, coatings, silicones, and industrial intermediates make up the company's product line. For customers in the packaging, infrastructure, mobility, and consumer care areas, the company offers a variety of goods and services. Several industries, including home and personal care, durable goods, adhesives and sealants, coatings, and food and specialty packaging, use Dow's products. It has activities throughout Africa, the Middle East, Latin America, the Asia-Pacific region, and North America.

    The U.S. state of Michigan's Midland serves as the home of Dow. A deal between Dow and Locus Performance Ingredients to distribute Locus PI's portfolio of sophorolipid biosurfactants to the personal care sector was announced in February 2022. The collaboration will bring together Locus PI's experience in fermentation and capacity to create specialized biosurfactant components with Dow's formulation know-how and market reach in the personal care sector.

    Specialty chemical firm Evonik Industries AG (Evonik), a division of RAG-Stiftung. Surfactants, polymers, resins, additives, among other things, are included in its product line. Agriculture, alternative energy, paints and coatings, paper and printing, metal and oil products, electrical and electronics, food and animal feed, personal care and cosmetics, pharmaceuticals, plastics and rubber, automotive, and construction are just a few of the industries where the company's products are used. Moreover, it provides engineering, logistics, utilities, and process technology services. Major production facilities for Evonik are located in China, Singapore, Belgium, the U.S., and Germany.

    In addition to other places, the corporation also operates in North America, Asia-Pacific, Africa, South America, and Europe. Essen, in Nordrhein-Westfalen, Germany, serves as the headquarters for Evonik. Evonik held a groundbreaking ceremony today to mark the beginning of work on the first commercial rhamnolipid production facility in the world, which is scheduled to open in June 2022. At Slovakia's biotech hotspot of Evonik, the new biosurfactant plant represents a triple-digit million euro investment. This will further solidify the Slovenská upa location as a key biotechnology hub and establish Evonik as a market leader in high-quality, sustainable biosurfactants.

    Key Companies in the Natural Surfactants Market market include

    Industry Developments

    March 2021 - With the acquisition, BASF improved its position in bio-based surfactants for industrial and home care formulators. The company formed a strategic partnership with U.K.-based Holiferm ltd. in order to create a cutting-edge method of manufacturing bio-based surfactants..

    August 2020 - Lamesoft Balance, a 100% organically derived surfactant, has been introduced, according to BASF. In formulations for hair and skin washing, the surfactant, which is voluntarily biodegradable, successfully stabilizes the wax based diffusion.

    December 2019 - To introduce a new green cleaning chemical, Evonik Industries and Unilever collaborated. The businesses made the decision to use a naturally existing process to create the effective grease- and dirt-removing natural surfactant rhamnolipids.

    Future Outlook

    Natural Surfactants Market Future Outlook

    The Global Natural Surfactants Market is poised for growth at a 4.20% CAGR from 2025 to 2035, driven by increasing demand for eco-friendly products and regulatory support.

    New opportunities lie in:

    • Develop innovative formulations for personal care products using natural surfactants.
    • Expand distribution channels in emerging markets to capture new customer segments.
    • Invest in R&D for biodegradable surfactants to meet sustainability goals.

    By 2035, the market is expected to achieve robust growth, reflecting a strong commitment to sustainability and innovation.

    Market Segmentation

    Natural Surfactants Product Outlook

    • Anionics
    • Nonionics
    • Cationics
    • Amphoterics

    Natural Surfactants Regional Outlook

    North America
    • US.
    • Canada

    Natural Surfactants Application Outlook

    • Detergents
    • Industrial & Institutional
    • Personal Care
    • Oilfield Chemicals
    • Others

    Report Scope

    Report Attribute/Metric Details
    Market Size 2024 USD 21.72 Billion
    Market Size 2025 USD 22.64 Billion
    Market Size 2035 34.16 (Value (USD Billion))
    Compound Annual Growth Rate (CAGR) 4.20% (2025 - 2035)
    Base Year 2024
    Market Forecast Period 2025 - 2035
    Historical Data 2020- 2024
    Market Forecast Units Value (USD Billion)
    Report Coverage Revenue Forecast, Market Competitive Landscape, Growth Factors, and Trends
    Segments Covered Product, Application, and Region
    Geographies Covered North America, Europe, Asia Pacific, and the Rest of the World
    Countries Covered The U.S., Canada, German, France, U.K., Italy, Spain, China, Japan, India, Australia, South Korea, and Brazil
    Key Companies Profiled BASF SE, Clariant AG, Croda International Plc., WHEATOLEO, The Dow Chemical Company, CECA Arkema Group, SEPPIC, Evonik Industries, and Innovative Chemical Technologies
    Key Market Opportunities Surfactants made from natural, renewable sources, such as like plant-based oils
    Key Market Dynamics The introduction of stringent regulations on using conventional surfactants along with increasing demand for sustainable green and bio-based products and increasing environmental concern across the world about surfactants has made governments and corporate to initiate an interest in natural surfactant

    Market Highlights

    Author

    Priya Nagrale
    Senior Research Analyst

    She holds an experience of about 6+ years in market research and business consulting, working under the spectrum of information communication technology, telecommunications and semiconductor domains. aarti conceptualizes and implements a scalable business strategy and provides strategic leadership to the clients. her expertise lies in market estimation, competitive intelligence, pipeline analysis, customer assessment, etc.

    Leave a Comment

    Latest Comments

    John Doe
    john@example.com

    This is a great article! Really helped me understand the topic better.

    Posted on July 23, 2025, 10:15 AM
    Jane Smith
    jane@domain.com

    Thanks for sharing this. I’ve bookmarked it for later reference.

    Posted on July 22, 2025, 7:45 PM

    FAQs

    How much is the Natural Surfactants market?

    The Natural Surfactants Market size was valued at USD 21.72 Billion in 2024.

    What is the growth rate of the Natural Surfactants market?

    Natural Surfactants Market is expected to grow with a CAGR of 4.2% in the period 2025-2035

    Which region held the largest market share in the Natural Surfactants market?

    Europe had the largest share in the global market

    Who are the key players in the Natural Surfactants market?

    The key players in the market are BASF SE, Clariant AG, Croda International Plc., WHEATOLEO, The Dow Chemical Company, CECA Arkema Group, SEPPIC, Evonik Industries, and Innovative Chemical Technologies.

    Which Product led the Natural Surfactants market?

    The Anionics category dominated the market in 2024.

    Which Application had the largest market share in the Natural Surfactants market?

    The Detergents had the largest share in the global market.

    1. List of Tables and Figures
      1. Table of Contents 1. Executive Summary 2. Market Introduction 2.1. Definition 2.2. Scope of the Study 2.2.1. Research Objective 2.2.2. Assumptions 2.2.3. Limitations 3. Research Methodology 3.1. Overview 3.2. Data Mining 3.3. Secondary Research 3.4. Primary Research 3.4.1. Primary Interviews and Information Gathering Process 3.4.2. Breakdown of Primary Respondents 3.5. Forecasting Model 3.6. Market Size Estimation 3.6.1. Bottom-up Approach 3.6.2. Top-Down Approach 3.7. Data Triangulation 3.8. Validation 4. MARKET DYNAMICS 4.1. Overview 4.2. Drivers 4.3. Restraints 4.4. Opportunities 5. MARKET FACTOR ANALYSIS 5.1. Value Chain Analysis 5.2. Porter’s Five Forces Analysis 5.2.1. Bargaining Power of Suppliers 5.2.2. Bargaining Power of Buyers 5.2.3. Threat of New Entrants 5.2.4. Threat of Substitutes 5.2.5. Intensity of Rivalry 5.3. COVID-19 Impact Analysis 5.3.1. Market Impact Analysis 5.3.2. Regional Impact 5.3.3. Opportunity and Threat Analysis 6. GLOBAL NATURAL SURFACTANTS MARKET, BY PRODUCT 6.1. Overview 6.2. Anionics 6.3. Nonionics 6.4. Cationics 6.5. Amphoterics 7. GLOBAL NATURAL SURFACTANTS MARKET, BY APPLICATION 7.1. Overview 7.2. Detergents 7.3. Industrial & Institutional 7.4. Personal Care 7.5. Oilfield Chemicals 7.6. Others 8. GLOBAL NATURAL SURFACTANTS MARKET, BY REGION 8.1. Overview 8.1. North America 8.1.1. US 8.1.2. Canada 8.2. Europe 8.2.1. Germany 8.2.2. France 8.2.3. UK 8.2.4. Italy 8.2.5. Spain 8.2.6. Rest of Europe 8.3. Asia-Pacific 8.3.1. China 8.3.2. India 8.3.3. Japan 8.3.4. South Korea 8.3.5. Australia 8.3.6. Rest of Asia-Pacific 8.4. Rest of the World 8.4.1. Middle East 8.4.2. Africa 8.4.3. Latin America 9. Competitive Landscape 9.1. Overview 9.2. Competitive Analysis 9.3. Market Share Analysis 9.4. Major Growth Strategy in the Global Natural Surfactants Market, 9.5. Competitive Benchmarking 9.6. Leading Players in Terms of Number of Developments in the Global Natural Surfactants Market, 9.7. Key developments and Growth Strategies 9.7.1. New Product Launch/Service Deployment 9.7.2. Merger & Acquisitions 9.7.3. Joint Ventures 9.8. Major Players Financial Matrix 9.8.1. Sales & Operating Income, 2022 9.8.2. Major Players R&D Expenditure. 2022 10. COMPANY PROFILES 10.1. BASF SE 10.1.1. Company Overview 10.1.2. Financial Overview 10.1.3. Products Offered 10.1.4. Key Developments 10.1.5. SWOT Analysis 10.1.6. Key Strategies 10.2. Clariant AG 10.2.1. Company Overview 10.2.2. Financial Overview 10.2.3. Products Offered 10.2.4. Key Developments 10.2.5. SWOT Analysis 10.2.6. Key Strategies 10.3. Croda International Plc. 10.3.1. Company Overview 10.3.2. Financial Overview 10.3.3. Products Offered 10.3.4. Key Developments 10.3.5. SWOT Analysis 10.3.6. Key Strategies 10.4. WHEATOLEO 10.4.1. Company Overview 10.4.2. Financial Overview 10.4.3. Products Offered 10.4.4. Key Developments 10.4.5. SWOT Analysis 10.4.6. Key Strategies 10.5. The Dow Chemical Company 10.5.1. Company Overview 10.5.2. Financial Overview 10.5.3. Products Offered 10.5.4. Key Developments 10.5.5. SWOT Analysis 10.5.6. Key Strategies 10.6. CECA ARKEMA GROUP 10.6.1. Company Overview 10.6.2. Financial Overview 10.6.3. Products Offered 10.6.4. Key Developments 10.6.5. SWOT Analysis 10.6.6. Key Strategies 10.7. SEPPIC 10.7.1. Company Overview 10.7.2. Financial Overview 10.7.3. Products Offered 10.7.4. Key Developments 10.7.5. SWOT Analysis 10.7.6. Key Strategies 10.8. Evonik Industries 10.8.1. Company Overview 10.8.2. Financial Overview 10.8.3. Products Offered 10.8.4. Key Developments 10.8.5. SWOT Analysis 10.8.6. Key Strategies 10.9. Innovative Chemical Technologies 10.9.1. Company Overview 10.9.2. Financial Overview 10.9.3. Products Offered 10.9.4. Key Developments 10.9.5. SWOT Analysis 10.9.6. Key Strategies 10.10. Other Players 10.10.1. Company Overview 10.10.2. Financial Overview 10.10.3. Products Offered 10.10.4. Key Developments 10.10.5. SWOT Analysis 10.10.6. Key Strategies 11. APPENDIX 11.1. References 11.2. Related Reports   LIST OF TABLES
      2. TABLE 1 GLOBAL NATURAL SURFACTANTS MARKET, SYNOPSIS, 2025−2034
      3. TABLE 2 GLOBAL NATURAL SURFACTANTS MARKET, ESTIMATES & FORECAST, 2025−2034 (USD BILLION)
      4. TABLE 3 GLOBAL NATURAL SURFACTANTS MARKET, BY PRODUCT, 2025−2034 (USD BILLION)
      5. TABLE 4 GLOBAL NATURAL SURFACTANTS MARKET, BY APPLICATION, 2025−2034 (USD BILLION)
      6. TABLE 5 NORTH AMERICA: NATURAL SURFACTANTS MARKET, BY PRODUCT, 2025−2034 (USD BILLION)
      7. TABLE 6 NORTH AMERICA NATURAL SURFACTANTS MARKET, BY APPLICATION, 2025−2034 (USD BILLION)
      8. TABLE 7 US: NATURAL SURFACTANTS MARKET, BY PRODUCT, 2025−2034 (USD BILLION)
      9. TABLE 8 US: NATURAL SURFACTANTS MARKET, BY APPLICATION, 2025−2034 (USD BILLION)
      10. TABLE 9 CANADA: NATURAL SURFACTANTS MARKET, BY PRODUCT, 2025−2034 (USD BILLION)
      11. TABLE 10 CANADA NATURAL SURFACTANTS MARKET, BY APPLICATION, 2025−2034 (USD BILLION)
      12. TABLE 1 EUROPE: NATURAL SURFACTANTS MARKET, BY PRODUCT, 2025−2034 (USD BILLION)
      13. TABLE 2 EUROPE NATURAL SURFACTANTS MARKET, BY APPLICATION, 2025−2034 (USD BILLION)
      14. TABLE 3 GERMANY: NATURAL SURFACTANTS MARKET, BY PRODUCT, 2025−2034 (USD BILLION)
      15. TABLE 4 GERMANY NATURAL SURFACTANTS MARKET, BY APPLICATION, 2025−2034 (USD BILLION)
      16. TABLE 5 FRANCE: NATURAL SURFACTANTS MARKET, BY PRODUCT, 2025−2034 (USD BILLION)
      17. TABLE 6 FRANCE NATURAL SURFACTANTS MARKET, BY APPLICATION, 2025−2034 (USD BILLION)
      18. TABLE 7 ITALY: NATURAL SURFACTANTS MARKET, BY PRODUCT, 2025−2034 (USD BILLION)
      19. TABLE 8 ITALY NATURAL SURFACTANTS MARKET, BY APPLICATION, 2025−2034 (USD BILLION)
      20. TABLE 9 SPAIN: NATURAL SURFACTANTS MARKET, BY PRODUCT, 2025−2034 (USD BILLION)
      21. TABLE 10 SPAIN NATURAL SURFACTANTS MARKET, BY APPLICATION, 2025−2034 (USD BILLION)
      22. TABLE 11 UK: NATURAL SURFACTANTS MARKET, BY PRODUCT, 2025−2034 (USD BILLION)
      23. TABLE 12 UK NATURAL SURFACTANTS MARKET, BY APPLICATION, 2025−2034 (USD BILLION)
      24. TABLE 13 REST OF EUROPE: NATURAL SURFACTANTS MARKET, BY PRODUCT, 2025−2034 (USD BILLION)
      25. TABLE 14 REST OF EUROPE NATURAL SURFACTANTS MARKET, BY APPLICATION, 2025−2034 (USD BILLION)
      26. TABLE 15 ASIA-PACIFIC: NATURAL SURFACTANTS MARKET, BY PRODUCT, 2025−2034 (USD BILLION)
      27. TABLE 16 ASIA-PACIFIC NATURAL SURFACTANTS MARKET, BY APPLICATION, 2025−2034 (USD BILLION)
      28. TABLE 17 JAPAN: NATURAL SURFACTANTS MARKET, BY PRODUCT, 2025−2034 (USD BILLION)
      29. TABLE 18 JAPAN NATURAL SURFACTANTS MARKET, BY APPLICATION, 2025−2034 (USD BILLION)
      30. TABLE 19 CHINA: NATURAL SURFACTANTS MARKET, BY PRODUCT, 2025−2034 (USD BILLION)
      31. TABLE 20 CHINA NATURAL SURFACTANTS MARKET, BY APPLICATION, 2025−2034 (USD BILLION)
      32. TABLE 21 INDIA: NATURAL SURFACTANTS MARKET, BY PRODUCT, 2025−2034 (USD BILLION)
      33. TABLE 22 INDIA NATURAL SURFACTANTS MARKET, BY APPLICATION, 2025−2034 (USD BILLION)
      34. TABLE 23 AUSTRALIA: NATURAL SURFACTANTS MARKET, BY PRODUCT, 2025−2034 (USD BILLION)
      35. TABLE 24 AUSTRALIA NATURAL SURFACTANTS MARKET, BY APPLICATION, 2025−2034 (USD BILLION)
      36. TABLE 25 SOUTH KOREA: NATURAL SURFACTANTS MARKET, BY PRODUCT, 2025−2034 (USD BILLION)
      37. TABLE 26 SOUTH KOREA NATURAL SURFACTANTS MARKET, BY APPLICATION, 2025−2034 (USD BILLION)
      38. TABLE 27 REST OF ASIA-PACIFIC: NATURAL SURFACTANTS MARKET, BY PRODUCT, 2025−2034 (USD BILLION)
      39. TABLE 28 REST OF ASIA-PACIFIC NATURAL SURFACTANTS MARKET, BY APPLICATION, 2025−2034 (USD BILLION)
      40. TABLE 29 REST OF THE WORLD: NATURAL SURFACTANTS MARKET, BY PRODUCT, 2025−2034 (USD BILLION)
      41. TABLE 30 REST OF THE WORLD NATURAL SURFACTANTS MARKET, BY APPLICATION, 2025−2034 (USD BILLION)
      42. TABLE 31 MIDDLE EAST: NATURAL SURFACTANTS MARKET, BY PRODUCT, 2025−2034 (USD BILLION)
      43. TABLE 32 MIDDLE EAST NATURAL SURFACTANTS MARKET, BY APPLICATION, 2025−2034 (USD BILLION)
      44. TABLE 33 AFRICA: NATURAL SURFACTANTS MARKET, BY PRODUCT, 2025−2034 (USD BILLION)
      45. TABLE 34 AFRICA NATURAL SURFACTANTS MARKET, BY APPLICATION, 2025−2034 (USD BILLION)
      46. TABLE 35 LATIN AMERICA: NATURAL SURFACTANTS MARKET, BY PRODUCT, 2025−2034 (USD BILLION)
      47. TABLE 36 LATIN AMERICA NATURAL SURFACTANTS MARKET, BY APPLICATION, 2025−2034 (USD BILLION)     LIST OF FIGURES
      48. FIGURE 1 RESEARCH PROCESS
      49. FIGURE 2 MARKET STRUCTURE FOR THE GLOBAL NATURAL SURFACTANTS MARKET
      50. FIGURE 3 MARKET DYNAMICS FOR THE GLOBAL NATURAL SURFACTANTS MARKET
      51. FIGURE 4 GLOBAL NATURAL SURFACTANTS MARKET, SHARE (%), BY PRODUCT, 2022
      52. FIGURE 5 GLOBAL NATURAL SURFACTANTS MARKET, SHARE (%), BY APPLICATION, 2022
      53. FIGURE 6 GLOBAL NATURAL SURFACTANTS MARKET, SHARE (%), BY REGION, 2022
      54. FIGURE 7 NORTH AMERICA: NATURAL SURFACTANTS MARKET, SHARE (%), BY REGION, 2022
      55. FIGURE 8 EUROPE: NATURAL SURFACTANTS MARKET, SHARE (%), BY REGION, 2022
      56. FIGURE 9 ASIA-PACIFIC: NATURAL SURFACTANTS MARKET, SHARE (%), BY REGION, 2022
      57. FIGURE 10 REST OF THE WORLD: NATURAL SURFACTANTS MARKET, SHARE (%), BY REGION, 2022
      58. FIGURE 11 GLOBAL NATURAL SURFACTANTS MARKET: COMPANY SHARE ANALYSIS, 2022 (%)
      59. FIGURE 12 BASF SE: FINANCIAL OVERVIEW SNAPSHOT
      60. FIGURE 13 BASF SE: SWOT ANALYSIS
      61. FIGURE 14 CLARIANT AG: FINANCIAL OVERVIEW SNAPSHOT
      62. FIGURE 15 CLARIANT AG: SWOT ANALYSIS
      63. FIGURE 16 CRODA INTERNATIONAL PLC.: FINANCIAL OVERVIEW SNAPSHOT
      64. FIGURE 17 CRODA INTERNATIONAL PLC.: SWOT ANALYSIS
      65. FIGURE 18 WHEATOLEO: FINANCIAL OVERVIEW SNAPSHOT
      66. FIGURE 19 WHEATOLEO: SWOT ANALYSIS
      67. FIGURE 20 THE DOW CHEMICAL COMPANY.: FINANCIAL OVERVIEW SNAPSHOT
      68. FIGURE 21 THE DOW CHEMICAL COMPANY.: SWOT ANALYSIS
      69. FIGURE 22 CECA ARKEMA GROUP: FINANCIAL OVERVIEW SNAPSHOT
      70. FIGURE 23 CECA ARKEMA GROUP: SWOT ANALYSIS
      71. FIGURE 24 SEPPIC: FINANCIAL OVERVIEW SNAPSHOT
      72. FIGURE 25 SEPPIC: SWOT ANALYSIS
      73. FIGURE 26 EVONIK INDUSTRIES: FINANCIAL OVERVIEW SNAPSHOT
      74. FIGURE 27 EVONIK INDUSTRIES: SWOT ANALYSIS
      75. FIGURE 28 INNOVATIVE CHEMICAL TECHNOLOGIES: FINANCIAL OVERVIEW SNAPSHOT
      76. FIGURE 29 INNOVATIVE CHEMICAL TECHNOLOGIES: SWOT ANALYSIS
      77. FIGURE 30 OTHER PLAYERS: FINANCIAL OVERVIEW SNAPSHOT
      78. FIGURE 31 OTHER PLAYERS: SWOT ANALYSIS

    Natural Surfactants Market Segmentation

    Natural Surfactants Product Outlook (USD Billion, 2018-2032)

    • Anionics
    • Nonionics
    • Cationics
    • Amphoterics

    Natural Surfactants Application Outlook (USD Billion, 2018-2032)

    • Detergents
    • Industrial & Institutional
    • Personal Care
    • Oilfield Chemicals
    • Others

    Natural Surfactants Products Regional Outlook (USD Billion, 2018-2032)

    • North America Outlook (USD Billion, 2018-2032)

      • North America Natural Surfactants Products by Product
        • Anionics
        • Nonionics
        • Cationics
        • Amphoterics
      • North America Natural Surfactants Products by Application
        • Detergents
        • Industrial & Institutional
        • Personal Care
        • Oilfield Chemicals
        • Others
      • US Outlook (USD Billion, 2018-2032)

      • US Natural Surfactants Products by Product
        • Anionics
        • Nonionics
        • Cationics
        • Amphoterics
      • US Natural Surfactants Products by Application
        • Detergents
        • Industrial & Institutional
        • Personal Care
        • Oilfield Chemicals
        • Others
      • Canada Outlook (USD Billion, 2018-2032)

      • Canada Natural Surfactants Products by Product
        • Anionics
        • Nonionics
        • Cationics
        • Amphoterics
      • Canada Natural Surfactants Products by Application
        • Detergents
        • Industrial & Institutional
        • Personal Care
        • Oilfield Chemicals
        • Others
    • Europe Outlook (USD Billion, 2018-2032)

      • Europe Natural Surfactants Products by Product
        • Anionics
        • Nonionics
        • Cationics
        • Amphoterics
      • Europe Natural Surfactants Products by Application
        • Detergents
        • Industrial & Institutional
        • Personal Care
        • Oilfield Chemicals
        • Others
      • Germany Outlook (USD Billion, 2018-2032)

      • Germany Natural Surfactants Products by Product
        • Anionics
        • Nonionics
        • Cationics
        • Amphoterics
      • Germany Natural Surfactants Products by Application
        • Detergents
        • Industrial & Institutional
        • Personal Care
        • Oilfield Chemicals
        • Others
      • France Outlook (USD Billion, 2018-2032)

      • France Natural Surfactants Products by Product
        • Anionics
        • Nonionics
        • Cationics
        • Amphoterics
      • France Natural Surfactants Products by Application
        • Detergents
        • Industrial & Institutional
        • Personal Care
        • Oilfield Chemicals
        • Others
      • UK Outlook (USD Billion, 2018-2032)

      • UK Natural Surfactants Products by Product
        • Anionics
        • Nonionics
        • Cationics
        • Amphoterics
      • UK Natural Surfactants Products by Application
        • Detergents
        • Industrial & Institutional
        • Personal Care
        • Oilfield Chemicals
        • Others
      • Italy Outlook (USD Billion, 2018-2032)

      • Italy Natural Surfactants Products by Product
        • Anionics
        • Nonionics
        • Cationics
        • Amphoterics
      • Italy Natural Surfactants Products by Application
        • Detergents
        • Industrial & Institutional
        • Personal Care
        • Oilfield Chemicals
        • Others
      • Spain Outlook (USD Billion, 2018-2032)

      • Spain Natural Surfactants Products by Product
        • Anionics
        • Nonionics
        • Cationics
        • Amphoterics
      • Spain Natural Surfactants Products by Application
        • Detergents
        • Industrial & Institutional
        • Personal Care
        • Oilfield Chemicals
        • Others
      • Rest Of Europe Outlook (USD Billion, 2018-2032)

      • Rest Of Europe Natural Surfactants Products by Product
        • Anionics
        • Nonionics
        • Cationics
        • Amphoterics
      • Rest Of Europe Natural Surfactants Products by Application
        • Detergents
        • Industrial & Institutional
        • Personal Care
        • Oilfield Chemicals
        • Others
    • Asia-Pacific Outlook (USD Billion, 2018-2032)

      • Asia-Pacific Natural Surfactants Products by Product
        • Anionics
        • Nonionics
        • Cationics
        • Amphoterics
      • Asia-Pacific Natural Surfactants Products by Application
        • Detergents
        • Industrial & Institutional
        • Personal Care
        • Oilfield Chemicals
        • Others
      • China Outlook (USD Billion, 2018-2032)

      • China Natural Surfactants Products by Product
        • Anionics
        • Nonionics
        • Cationics
        • Amphoterics
      • China Natural Surfactants Products by Application
        • Detergents
        • Industrial & Institutional
        • Personal Care
        • Oilfield Chemicals
        • Others
      • Japan Outlook (USD Billion, 2018-2032)

      • Japan Natural Surfactants Products by Product
        • Anionics
        • Nonionics
        • Cationics
        • Amphoterics
      • Japan Natural Surfactants Products by Application
        • Detergents
        • Industrial & Institutional
        • Personal Care
        • Oilfield Chemicals
        • Others
      • India Outlook (USD Billion, 2018-2032)

      • India Natural Surfactants Products by Product
        • Anionics
        • Nonionics
        • Cationics
        • Amphoterics
      • India Natural Surfactants Products by Application
        • Detergents
        • Industrial & Institutional
        • Personal Care
        • Oilfield Chemicals
        • Others
      • Australia Outlook (USD Billion, 2018-2032)

      • Australia Natural Surfactants Products by Product
        • Anionics
        • Nonionics
        • Cationics
        • Amphoterics
      • Australia Natural Surfactants Products by Application
        • Detergents
        • Industrial & Institutional
        • Personal Care
        • Oilfield Chemicals
        • Others
      • Rest of Asia-Pacific Outlook (USD Billion, 2018-2032)

      • Rest of Asia-Pacific Natural Surfactants Products by Product
        • Anionics
        • Nonionics
        • Cationics
        • Amphoterics
      • Rest of Asia-Pacific Natural Surfactants Products by Application
        • Detergents
        • Industrial & Institutional
        • Personal Care
        • Oilfield Chemicals
        • Others
    • Rest of the World Outlook (USD Billion, 2018-2032)

      • Rest of the World Natural Surfactants Products by Product
        • Anionics
        • Nonionics
        • Cationics
        • Amphoterics
      • Rest of the World Natural Surfactants Products by Application
        • Detergents
        • Industrial & Institutional
        • Personal Care
        • Oilfield Chemicals
        • Others
      • Middle East Outlook (USD Billion, 2018-2032)

      • Middle East Natural Surfactants Products by Product
        • Anionics
        • Nonionics
        • Cationics
        • Amphoterics
      • Middle East Natural Surfactants Products by Application
        • Detergents
        • Industrial & Institutional
        • Personal Care
        • Oilfield Chemicals
        • Others
      • Africa Outlook (USD Billion, 2018-2032)

      • Africa Natural Surfactants Products by Product
        • Anionics
        • Nonionics
        • Cationics
        • Amphoterics
      • Africa Natural Surfactants Products by Application
        • Detergents
        • Industrial & Institutional
        • Personal Care
        • Oilfield Chemicals
        • Others
      • Latin America Outlook (USD Billion, 2018-2032)

      • Latin America Natural Surfactants Products by Product
        • Anionics
        • Nonionics
        • Cationics
        • Amphoterics
      • Latin America Natural Surfactants Products by Application
        • Detergents
        • Industrial & Institutional
        • Personal Care
        • Oilfield Chemicals
        • Others
    Infographic

    Free Sample Request

    Kindly complete the form below to receive a free sample of this Report

    Get Free Sample

    Customer Strories

    “I am very pleased with how market segments have been defined in a relevant way for my purposes (such as "Portable Freezers & refrigerators" and "last-mile"). In general the report is well structured. Thanks very much for your efforts.”

    Victoria Milne

    Founder
    Case Study
    Chemicals and Materials