Modular Substation Market (2026 - 2035)

ID: MRFR/EnP/6188-HCR 111 Pages Priya Nagrale Last Updated: October 12, 2026
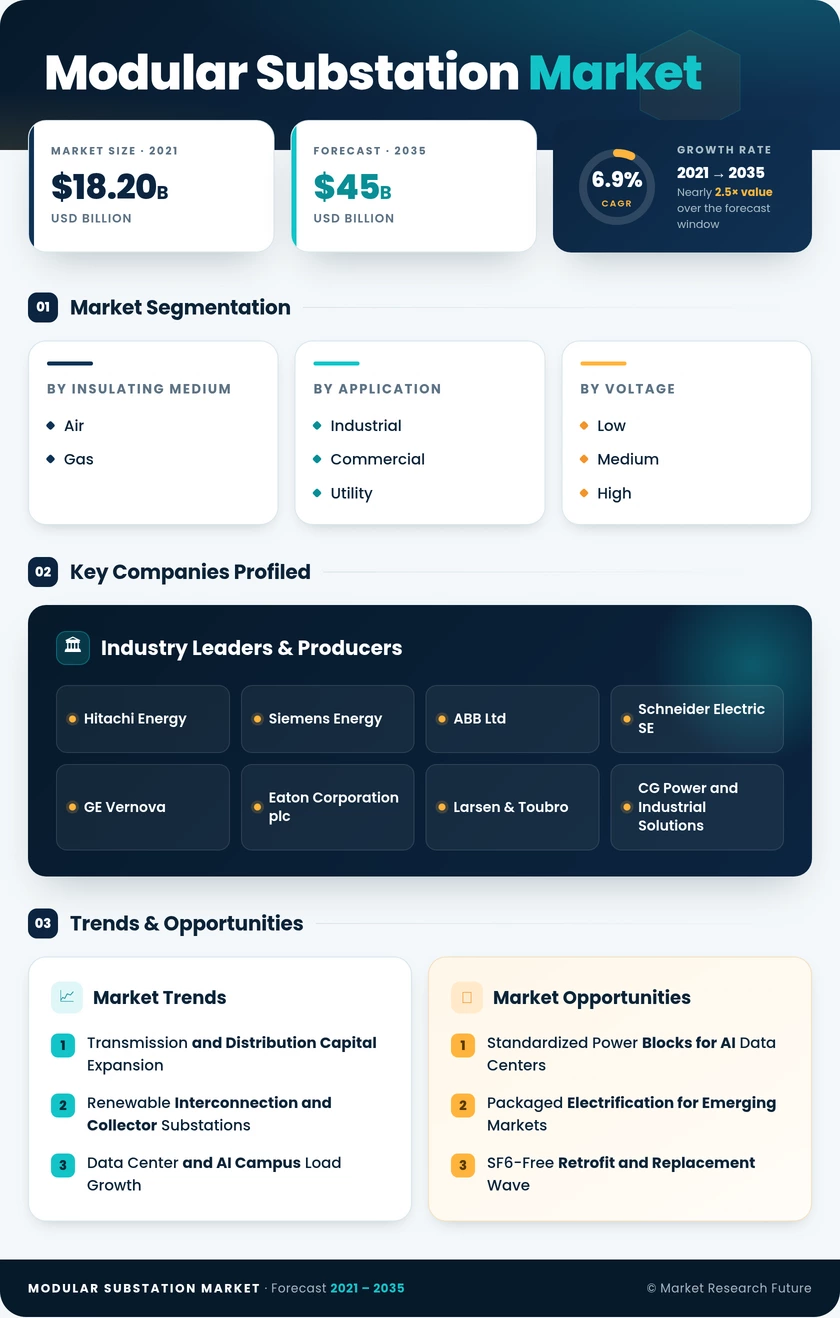
Modular Substation Market Research Report By Insulating Medium (Air, Gas), By Application (Industrial, Commercial, Utility), By Voltage (Low, Medium, High) - Forecast to 2035
Modular Substation Market
Market Size
Forecast Period2026-2035
CAGR (2026-2035)6.9%
2025 Market SizeUSD 23.1 Billion
2035 Market SizeUSD 45.0 Billion
Key Players
Hitachi Energy
Siemens Energy
ABB Ltd
Schneider Electric SE
GE Vernova
Eaton Corporation plc
Opportunities
  • Standardized Power Blocks for AI Data Centers
  • Packaged Electrification for Emerging Markets
  • SF6-Free Retrofit and Replacement Wave
  1. 1 Market Summary | |
  2. 2 Key Report Takeaways | |
    1. 2.1 By Insulating Medium | |
    2. 2.2 By Application | |
    3. 2.3 By Voltage | |
    4. 2.4 By Region | |
  3. 3 Market Size and Forecast (2021–2035) | |
  4. 4 Driver Impact Analysis | |
    1. 4.1 Transmission and Distribution Capital Expansion | |
    2. 4.2 Renewable Interconnection and Collector Substations | |
    3. 4.3 Data Center and AI Campus Load Growth | |
    4. 4.4 Electrification of Underserved Regions | |
    5. 4.5 Compressed Project Timelines and Labor Scarcity | |
    6. 4.6 EV Charging and Distribution Load Growth | |
  5. 5 Restraints Impact Analysis | |
    1. 5.1 Component Supply Constraints | |
    2. 5.2 Transport and Size Limits for High-Voltage Modules | |
    3. 5.3 SF6 Phase-Down Compliance Costs | |
    4. 5.4 Interconnection and Permitting Delays | |
    5. 5.5 Cybersecurity and Compliance Burden | |
  6. 6 Opportunities | |
    1. 6.1 Standardized Power Blocks for AI Data Centers | |
    2. 6.2 Packaged Electrification for Emerging Markets | |
    3. 6.3 SF6-Free Retrofit and Replacement Wave | |
    4. 6.4 Substation-as-a-Service and Data Monetization | |
    5. 6.5 Mobile Substations for Grid Resilience | |
  7. 7 Regional Market Share and Country-Level Analysis | |
    1. 7.1 North America | | |
      1. 7.1.1 US | | |
      2. 7.1.2 Canada | | |
      3. 7.1.3 Mexico | |
    2. 7.2 Europe | | |
      1. 7.2.1 Germany | | |
      2. 7.2.2 UK | | |
      3. 7.2.3 France | | |
      4. 7.2.4 Italy | | |
      5. 7.2.5 Spain | | |
      6. 7.2.6 Nordic Countries | | |
      7. 7.2.7 Russia | | |
      8. 7.2.8 Rest of Europe | |
    3. 7.3 Asia-Pacific | | |
      1. 7.3.1 China | | |
      2. 7.3.2 India | | |
      3. 7.3.3 Japan | | |
      4. 7.3.4 South Korea | | |
      5. 7.3.5 ASEAN | | |
      6. 7.3.6 Rest of Asia-Pacific | |
    4. 7.4 South America | | |
      1. 7.4.1 Brazil | | |
      2. 7.4.2 Argentina | | |
      3. 7.4.3 Rest of South America | |
    5. 7.5 Middle-East and Africa | | |
      1. 7.5.1 Saudi Arabia | | |
      2. 7.5.2 UAE | | |
      3. 7.5.3 South Africa | | |
      4. 7.5.4 Egypt | | |
      5. 7.5.5 Rest of MEA | |
  8. 8 Future Outlook (2026–2035) | |
    1. 8.1 Digital and Autonomous Substation Operations | |
    2. 8.2 The Electrification Supercycle | |
    3. 8.3 Factory Scale and Platform Standardization | |
    4. 8.4 Decarbonization and ESG Reporting | |
  9. 9 Segmentation Analysis | |
    1. 9.1 By Insulating Medium | | |
      1. 9.1.1 Air | | |
      2. 9.1.2 Gas | |
    2. 9.2 By Application | | |
      1. 9.2.1 Industrial | | |
      2. 9.2.2 Commercial | | |
      3. 9.2.3 Utility | |
    3. 9.3 By Voltage | | |
      1. 9.3.1 Low | | |
      2. 9.3.2 Medium | | |
      3. 9.3.3 High | |
  10. 10 Competitive Landscape | |
    1. 10.1 Market Concentration Analysis | |
    2. 10.2 Competitive Benchmarking Table | |
  11. 11 Recent News & Developments | |
  12. 12 Report Scope and Methodology | |
  13. 13 Detailed Sources and Citations | |
  14. 14 Frequently Asked Questions (FAQs) | | LIST OF TABLES | |
  15. TABLE 1 Global Market Summary Snapshot, 2025–2035 | |
  16. TABLE 2 Global Market Size & Forecast, by Revenue (USD Billion), 2021–2035 | |
  17. TABLE 3 Driver Impact Analysis on CAGR, 2026–2035 | |
  18. TABLE 4 Restraints Impact Analysis on CAGR, 2026–2035 | |
  19. TABLE 5 Regional Summary, by Region, 2025 | |
  20. TABLE 6 North America Country-Level Analysis, 2025–2035 | |
  21. TABLE 7 Europe Country-Level Analysis, 2025–2035 | |
  22. TABLE 8 Asia-Pacific Country-Level Analysis, 2025–2035 | |
  23. TABLE 9 South America Country-Level Analysis, 2025–2035 | |
  24. TABLE 10 Middle-East and Africa Country-Level Analysis, 2025–2035 | |
  25. TABLE 11 Global Market, by Insulating Medium, 2025–2035 | |
  26. TABLE 12 Global Market, by Application, 2025–2035 | |
  27. TABLE 13 Global Market, by Voltage, 2025–2035 | |
  28. TABLE 14 Competitive Benchmarking Matrix, 2025 | |
  29. TABLE 15 Report Scope and Methodology | |
  30. TABLE 16 Detailed Sources and Citations | | LIST OF FIGURES | |
  31. FIGURE 1 Market Dynamics Overview (Drivers, Restraints, Opportunities) | |
  32. FIGURE 2 Industry Value Chain Analysis | |
  33. FIGURE 3 Porter's Five Forces Analysis | |
  34. FIGURE 4 Global Market Size Trend, 2021–2035 (USD Billion) | |
  35. FIGURE 5 Year-over-Year Growth Rate, 2021–2035 | |
  36. FIGURE 6 Market Share, by Insulating Medium, 2025 | |
  37. FIGURE 7 Market Share, by Application, 2025 | |
  38. FIGURE 8 Market Share, by Voltage, 2025 | |
  39. FIGURE 9 Regional Market Share, 2025 | |
  40. FIGURE 10 Regional Growth Comparison, 2026–2035 CAGR | |
  41. FIGURE 11 Competitive Landscape – Estimated Revenue Share Ranges, 2025 | |
  42. FIGURE 12 Market Concentration Profile (Top-5 Share and HHI)

Segmentation Quick Reference

DimensionSub-SegmentsDominant SegmentFastest Growing Segment
By Insulating MediumAir, GasAir (57.5% share)Gas (7.6% CAGR)
By ApplicationIndustrial, Commercial, UtilityUtility (46.0% share)Commercial (7.4% CAGR)
By VoltageLow, Medium, HighMedium (52.0% share)High (7.8% CAGR)
By RegionNorth America, Europe, Asia-Pacific, South America, Middle-East and AfricaAsia-Pacific (41.5% share)Asia-Pacific (7.6% CAGR)


Market Segmentation Overview

By Insulating Medium

Sub-SegmentKey Trend
AirRemains the low-cost default for utilities and industrial sites with available land
GasGains share in dense urban, offshore, and data center sites as SF6-free gas mixtures mature


Air leads because its lower purchase price and simple maintenance suit utility yards and mines where space is not a constraint. Gas grows fastest since its smaller footprint fits city centers and offshore platforms. The EU F-gas restrictions are shifting gas-insulated designs toward clean-air and alternative-gas technology rather than reducing demand for compact insulation.

By Application

Sub-SegmentKey Trend
IndustrialRelocatable skids for mining, oil and gas, and process plants
CommercialRepeatable power blocks for data centers and EV charging hubs
UtilityFactory-built bays for grid expansion and renewable connections


Utility holds the largest share because transmission and distribution operators run the biggest substation programs worldwide. Commercial grows fastest as data center developers and charging networks buy standardized, pre-tested modules to meet tight energization dates. Industrial buyers sit between the two, valuing mobility and fast installation at remote production sites.

By Voltage

Sub-SegmentKey Trend
LowSteady demand from buildings and small commercial sites
MediumCore of distribution, industrial, and data center connections
HighRising adoption for renewable collector and step-up stations


Medium voltage dominates because the 1–52 kV range matches most distribution, industrial, and data center loads. High voltage grows fastest as solar, wind, and storage developers adopt factory-built collector stations, though transport limits still restrict module sizes above roughly 145 kV. Low voltage serves smaller building and commercial loads with stable but slower growth.


 

Download PDF ×

We do not share your information with anyone. However, we may send you emails based on your report interest from time to time. You may contact us at any time to opt-out.