×
  • Cat-intel
  • MedIntelliX
  • Resources
  • About Us
  • Hero Background
    English
    Chinese
    French
    Japanese
    Korean
    German
    Spanish

    Mobile Mapping Market Trends

    ID: MRFR/ICT/4292-CR
    186 Pages
    Aarti Dhapte
    November 2020

    Mobile Mapping Market Research Report Information By Component (Hardware, Software and Services), Solution (Location-Based, Indoor Mapping, Asset Management and 3D Mapping), Application (Land Surveys and Aerial Surveys), End-User (Real Estate & Construction, IT & Telecom and Others) And By Region (North America, Europe, Asia-Pacific, And Rest Of The World) –Market Forecast Till 2035.

    Share:
    Download PDF ×

    We do not share your information with anyone. However, we may send you emails based on your report interest from time to time. You may contact us at any time to opt-out.

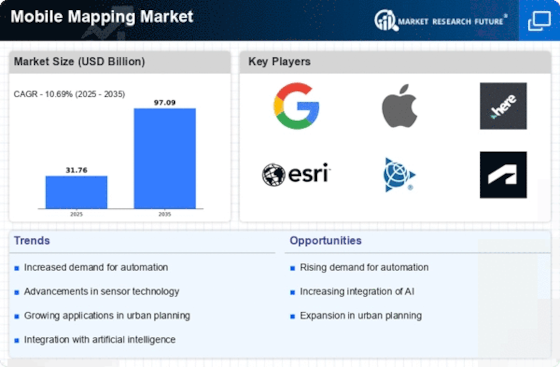
    Mobile Mapping Market Infographic
    Purchase Options

    Market Trends

    Key Emerging Trends in the Mobile Mapping Market

    The mobile mapping market is witnessing significant changes propelled by various factors reshaping its landscape. With the widespread adoption of smartphones, GPS technology, and advanced mapping applications, mobile mapping has emerged as a powerful tool for capturing, analyzing, and visualizing geospatial data in real-time. As organizations across industries recognize the value of location-based insights for decision-making, the demand for mobile mapping solutions continues to grow.

    One of the primary drivers behind the evolving market dynamics is the proliferation of location-based services (LBS) and navigation applications. Consumers increasingly rely on mobile mapping applications for turn-by-turn navigation, location-based recommendations, and real-time traffic updates. Moreover, businesses are leveraging LBS to deliver personalized experiences, optimize logistics operations, and target customers based on their geographic location. This surge in demand for location-based services is driving innovation in the mobile mapping market, with vendors introducing new features, such as augmented reality (AR) navigation and indoor mapping, to enhance the user experience.

    Furthermore, advancements in mobile technology, such as improved GPS accuracy, augmented reality capabilities, and 5G connectivity, are fueling the growth of the mobile mapping market. High-resolution cameras, LiDAR sensors, and inertial measurement units (IMUs) embedded in smartphones enable users to capture detailed 3D maps and point clouds on-the-go. These advancements empower businesses and consumers to create immersive experiences, conduct virtual site inspections, and visualize spatial data with unprecedented accuracy and realism. Additionally, the rollout of 5G networks promises faster data speeds and lower latency, unlocking new possibilities for real-time mapping and location-based applications.

    Moreover, the rise of autonomous vehicles and smart cities is driving demand for mobile mapping solutions with enhanced precision and reliability. Self-driving cars, drones, and other autonomous vehicles rely on high-definition maps and real-time sensor data to navigate safely and efficiently. Mobile mapping platforms equipped with advanced sensors and AI-powered algorithms enable organizations to collect, process, and update mapping data at scale, supporting the development and deployment of autonomous systems. Likewise, smart city initiatives require accurate geospatial data to optimize urban planning, manage infrastructure assets, and deliver public services effectively. Mobile mapping solutions play a crucial role in creating digital twins of cities, enabling urban planners, policymakers, and citizens to visualize and analyze spatial data for informed decision-making.

    Additionally, the COVID-19 pandemic has accelerated the adoption of mobile mapping solutions for remote work, asset management, and emergency response. With social distancing measures in place and travel restrictions in effect, organizations are turning to mobile mapping technology to remotely survey job sites, conduct virtual inspections, and monitor infrastructure assets. Mobile mapping applications equipped with collaboration features, such as real-time sharing and annotation tools, enable teams to collaborate effectively from anywhere, ensuring business continuity and operational resilience in challenging times.

    Furthermore, the integration of mobile mapping technology with other emerging technologies, such as IoT (Internet of Things) and AI (Artificial Intelligence), is driving innovation and expanding the market opportunities. IoT sensors embedded in vehicles, smartphones, and wearable devices generate vast amounts of spatial data that can be leveraged for mapping and location-based analytics. AI-powered algorithms analyze this data to extract valuable insights, such as traffic patterns, consumer behavior, and environmental conditions, enabling organizations to make data-driven decisions and deliver personalized experiences.


    Author
    Aarti Dhapte
    Team Lead - Research

    She holds an experience of about 6+ years in Market Research and Business Consulting, working under the spectrum of Information Communication Technology, Telecommunications and Semiconductor domains. Aarti conceptualizes and implements a scalable business strategy and provides strategic leadership to the clients. Her expertise lies in market estimation, competitive intelligence, pipeline analysis, customer assessment, etc.

    Leave a Comment

    FAQs

    What is the current valuation of the Mobile Mapping Market as of 2024?

    The Mobile Mapping Market was valued at 31.76 USD Billion in 2024.

    What is the projected market size for the Mobile Mapping Market by 2035?

    The Mobile Mapping Market is projected to reach 97.09 USD Billion by 2035.

    What is the expected CAGR for the Mobile Mapping Market during the forecast period 2025 - 2035?

    The expected CAGR for the Mobile Mapping Market during the forecast period 2025 - 2035 is 10.69%.

    Which companies are considered key players in the Mobile Mapping Market?

    Key players in the Mobile Mapping Market include Google, Apple, HERE Technologies, Esri, Trimble, Autodesk, Fugro, RIEGL, and Leica Geosystems.

    What are the main components of the Mobile Mapping Market and their valuations?

    The main components include Hardware valued at 30.0 USD Billion, Software at 36.0 USD Billion, and Services at 31.09 USD Billion.

    What solutions are driving growth in the Mobile Mapping Market?

    Key solutions include Location-Based services valued at 25.0 USD Billion, Indoor Mapping at 20.0 USD Billion, Asset Management at 30.0 USD Billion, and 3D Mapping at 22.09 USD Billion.

    Market Summary

    As per MRFR analysis, the Mobile Mapping Market Size was estimated at 31.76 USD Billion in 2024. The Mobile Mapping industry is projected to grow from 35.16 in 2025 to 97.09 by 2035, exhibiting a compound annual growth rate (CAGR) of 10.69 during the forecast period 2025 - 2035.

    Key Market Trends & Highlights

    The Mobile Mapping Market is poised for substantial growth driven by technological advancements and increasing demand for real-time data.

    • North America remains the largest market for mobile mapping solutions, reflecting a robust demand across various sectors.
    • The Asia-Pacific region is emerging as the fastest-growing market, fueled by rapid urbanization and smart city initiatives.
    • In the hardware segment, mobile mapping technologies dominate, while the software segment is experiencing the fastest growth due to evolving applications.
    • Key market drivers include technological advancements in mobile mapping and the rising demand for geographic information systems (GIS).

    Market Size & Forecast

    2024 Market Size 31.76 (USD Billion)
    2035 Market Size 97.09 (USD Billion)
    CAGR (2025 - 2035) 10.69%
    Largest Regional Market Share in 2024 North America

    Major Players

    <p>Google (US), Apple (US), HERE Technologies (NL), Esri (US), Trimble (US), Autodesk (US), Fugro (NL), RIEGL (AT), Leica Geosystems (CH)</p>

    Market Trends

    The Mobile Mapping Market is currently experiencing a transformative phase, driven by advancements in technology and increasing demand for accurate geospatial data. The integration of high-resolution imaging, LiDAR, and GPS technologies has enhanced the capabilities of mobile mapping systems, allowing for more precise data collection and analysis. This evolution is not merely a trend but appears to be a fundamental shift in how geographic information is gathered and utilized across various sectors, including urban planning, transportation, and environmental monitoring. As organizations recognize the value of real-time data, the Mobile Mapping Market is likely to expand, fostering innovation and competition among key players. Moreover, the growing emphasis on smart city initiatives and infrastructure development is propelling the adoption of mobile mapping solutions. Stakeholders are increasingly leveraging these technologies to improve decision-making processes and optimize resource allocation. The potential for mobile mapping to facilitate enhanced situational awareness and operational efficiency suggests that its relevance will continue to rise. As the market evolves, it may also witness the emergence of new applications and use cases, further solidifying its position as a critical component in the geospatial landscape.

    Technological Advancements

    The Mobile Mapping Market is witnessing rapid technological advancements that enhance data collection and processing capabilities. Innovations in sensor technology, such as LiDAR and high-resolution cameras, are enabling more accurate and detailed mapping solutions. These advancements are likely to improve the efficiency of various applications, from urban planning to disaster management.

    Increased Demand for Real-Time Data

    There is a growing demand for real-time data across multiple industries, which is influencing the Mobile Mapping Market. Organizations are increasingly seeking immediate access to geospatial information to support decision-making processes. This trend suggests that mobile mapping solutions will play a crucial role in providing timely insights for various applications.

    Expansion of Smart City Initiatives

    The rise of smart city initiatives is significantly impacting the Mobile Mapping Market. As cities strive to enhance infrastructure and improve quality of life, mobile mapping technologies are being integrated into urban planning and management. This trend indicates a shift towards more data-driven approaches in city development, potentially increasing the adoption of mobile mapping solutions.

    Mobile Mapping Market Market Drivers

    Expansion of Smart City Initiatives

    The Mobile Mapping Market is significantly influenced by the expansion of smart city initiatives, which aim to enhance urban living through technology. As cities evolve into smart environments, the need for accurate mapping and spatial data becomes paramount. Mobile mapping solutions play a crucial role in the development and maintenance of smart infrastructure, including transportation systems, utilities, and public services. Recent statistics indicate that investments in smart city projects are expected to reach trillions of dollars in the coming years, creating substantial opportunities for mobile mapping providers. This trend underscores the importance of integrating mobile mapping technologies into urban planning and development strategies.

    Increased Demand for Real-Time Data

    The Mobile Mapping Market is witnessing a surge in demand for real-time data, driven by the need for timely and accurate information across various applications. Industries such as logistics, construction, and emergency response are increasingly adopting mobile mapping solutions to enhance operational efficiency and decision-making processes. The ability to capture and analyze data in real-time allows organizations to respond swiftly to changing conditions, thereby improving service delivery and resource management. Market data suggests that the demand for real-time mapping solutions is expected to rise significantly, with a projected increase in adoption rates among businesses seeking to leverage data for competitive advantage.

    Technological Advancements in Mobile Mapping

    The Mobile Mapping Market is experiencing rapid technological advancements that enhance data collection and processing capabilities. Innovations in LiDAR, photogrammetry, and GPS technologies are driving the development of more accurate and efficient mapping solutions. For instance, the integration of artificial intelligence and machine learning algorithms into mobile mapping systems allows for real-time data analysis and improved decision-making. According to recent data, the market for mobile mapping systems is projected to grow at a compound annual growth rate of over 15 percent through 2026. This growth is indicative of the increasing reliance on advanced technologies to meet the demands of various sectors, including transportation, urban planning, and environmental monitoring.

    Growing Adoption in Transportation and Logistics

    The Mobile Mapping Market is experiencing growing adoption within the transportation and logistics sectors, where accurate mapping is essential for operational efficiency. Companies are increasingly utilizing mobile mapping technologies to optimize routes, monitor fleet performance, and enhance supply chain management. The integration of mobile mapping solutions allows for better visibility and tracking of assets, which is crucial in a highly competitive market. Data indicates that the transportation sector is one of the largest consumers of mobile mapping services, with a projected market share of over 30 percent by 2026. This trend highlights the critical role of mobile mapping in driving innovation and efficiency in logistics operations.

    Rising Demand for Geographic Information Systems (GIS)

    The Mobile Mapping Market is witnessing a rising demand for Geographic Information Systems (GIS), which are integral to various applications, including urban planning, environmental management, and disaster response. The synergy between mobile mapping technologies and GIS enhances the ability to visualize and analyze spatial data effectively. As organizations increasingly recognize the value of geospatial data, the demand for mobile mapping solutions that integrate seamlessly with GIS platforms is expected to grow. Market analysis suggests that the GIS market is projected to expand significantly, with mobile mapping playing a pivotal role in providing accurate and timely data for informed decision-making across multiple sectors.

    Market Segment Insights

    By Component: Hardware (Largest) vs. Software (Fastest-Growing)

    <p>In the Mobile Mapping Market, the component segment is primarily dominated by Hardware, which holds the largest share in this sector. Hardware includes essential elements such as GPS devices, sensors, and cameras that are critical for effective mapping solutions. This segment's extensive presence is attributed to the increasing demand for accurate and reliable mapping technologies in various industries. Meanwhile, Software has emerged as the fastest-growing component, reflecting the burgeoning need for advanced applications that can leverage the data captured by hardware. As mobile mapping technology evolves, software solutions are gaining significance for their ability to enhance user experience and integrate with existing infrastructures.</p>

    <p>Hardware (Dominant) vs. Software (Emerging)</p>

    <p>The hardware segment in the Mobile Mapping Market is characterized by established technologies such as GPS and LiDAR systems that provide the backbone for mapping activities. These devices are essential for delivering high-precision data, making them indispensable in sectors like construction, transportation, and urban planning. In contrast, the software segment is emerging as a vital driver of innovation, focusing on applications that improve data usability and analytics. Software solutions are increasingly being tailored to specific industries, offering capabilities like real-time data processing and interactive mapping interfaces. Together, these segments illustrate the synergistic relationship between hardware and software, where advancements in one drive progress in the other.</p>

    By Solution: Location-Based (Largest) vs. Indoor Mapping (Fastest-Growing)

    <p>In the Mobile Mapping Market, the Location-Based solutions are the largest segment, commanding a significant share due to their extensive applications in logistics and navigation. Indoor Mapping is emerging as the fastest-growing segment, driven by the increasing demand for accurate indoor navigation services in complexes like shopping malls and airports. The presence of advanced technologies like geo-tagging and GPS integration further enhances the relevance of these solutions in various sectors.</p>

    <p>Location-Based (Dominant) vs. Indoor Mapping (Emerging)</p>

    <p>Location-Based services have established dominance in the Mobile Mapping Market owing to their broad applicability across multiple industries including transportation, real estate, and emergency services. These services leverage GPS and other technologies to offer real-time location data, making them essential for many businesses. On the other hand, Indoor Mapping is recognized as an emerging segment focused on providing mapping solutions within enclosed spaces, which is increasingly crucial with the expansion of smart buildings. Enhanced customer experiences and improved operational efficiency are driving innovative applications in this area, positioning Indoor Mapping for rapid growth in the coming years.</p>

    By Application: Land Surveys (Largest) vs. Aerial Surveys (Fastest-Growing)

    <p>In the Mobile Mapping Market, the application of Land Surveys is the largest segment, capturing a significant share of the overall market. This has been largely driven by the increasing demand for precise data collection in construction and civil engineering projects. Aerial Surveys are rapidly gaining traction, thanks to advancements in drone technology which allow for efficient and cost-effective data acquisition from above, redefining traditional surveying methods.</p>

    <p>Surveys: Land (Dominant) vs. Aerial (Emerging)</p>

    <p>Land Surveys dominate the Mobile Mapping Market due to their established methodologies and wide applicability in various engineering and environmental projects. Utilizing technologies like GPS and terrestrial laser scanning, Land Surveys provide accurate terrain mapping and topographical data, which are essential for infrastructure development. On the other hand, Aerial Surveys are emerging as a crucial tool in this market due to the proliferation of UAV (drone) technology, which enables rapid data capture over large areas. This shift not only reduces time and labor costs but also enhances the scope of survey exploration, making aerial methods increasingly preferred in various sectors.</p>

    By End User: Real Estate & Construction (Largest) vs. IT & Telecom (Fastest-Growing)

    <p>The Mobile Mapping Market shares its focus among several end users, with Real Estate and Construction leading due to heightened demand for precision in surveying and infrastructure development. This segment capitalizes on mobile mapping technologies to enhance project planning and execution, thereby establishing its significant market presence. Meanwhile, the IT and Telecom sectors are also crucial end users, leveraging mobile mapping solutions for network planning, asset management, and service enhancement, contributing to a robust market composition.</p>

    <p>Real Estate & Construction: Dominant vs. IT & Telecom: Emerging</p>

    <p>The Real Estate and Construction sector stands as the dominant end user in the Mobile Mapping Market, driven by a continual need for high-accuracy data in land surveying, urban planning, and construction management. Companies in this sector are increasingly utilizing mobile mapping systems equipped with high-definition cameras and LiDAR to streamline workflows and improve project outcomes. On the other hand, the IT and Telecom segment represents an emerging market force, utilizing mobile mapping to enhance network deployments, optimize infrastructure, and provide geographic insights for improving service delivery. As this segment grows, it shows significant potential for innovative applications and market expansion in the future.</p>

    Get more detailed insights about Mobile Mapping Market Research Report - Global Forecast till 2035

    Regional Insights

    North America : Technological Innovation Leader

    North America is the largest market for mobile mapping, holding approximately 45% of the global share. The region's growth is driven by advancements in technology, increasing demand for accurate mapping solutions, and supportive regulatory frameworks. The U.S. government has been investing in infrastructure projects that require precise mapping, further fueling market expansion. Additionally, the rise of autonomous vehicles and smart city initiatives are significant catalysts for growth. The United States is the leading country in this sector, with major players like Google, Apple, and Esri headquartered here. The competitive landscape is characterized by rapid innovation and collaboration among tech giants and startups. Canada also plays a vital role, contributing to the market with its focus on geographic information systems (GIS) and mobile mapping technologies. The presence of key players ensures a dynamic and competitive environment.

    Europe : Emerging Market with Regulations

    Europe is the second-largest market for mobile mapping, accounting for approximately 30% of the global share. The region's growth is propelled by stringent regulations aimed at improving urban planning and environmental monitoring. Countries like Germany and the Netherlands are leading the charge, with government initiatives promoting the use of mobile mapping for infrastructure development and smart city projects. The European Union's focus on digital transformation is also a significant driver of demand. Germany, the UK, and the Netherlands are at the forefront of mobile mapping technologies, with a strong presence of companies like HERE Technologies and Fugro. The competitive landscape is marked by collaborations between public and private sectors, enhancing the development of innovative solutions. The region's emphasis on sustainability and efficiency in urban planning further solidifies its position in the mobile mapping market.

    Asia-Pacific : Rapid Growth and Adoption

    Asia-Pacific is witnessing rapid growth in the mobile mapping market, holding approximately 20% of the global share. The region's expansion is driven by increasing urbanization, government investments in smart city initiatives, and the rising demand for accurate geographic data. Countries like China and Japan are leading the market, with significant advancements in technology and infrastructure development. Regulatory support for digital mapping solutions is also a key factor in this growth. China is the largest market in the region, with a strong focus on integrating mobile mapping into various sectors, including transportation and urban planning. Japan follows closely, emphasizing precision and innovation in mapping technologies. The competitive landscape features both established players and emerging startups, fostering a dynamic environment for growth and innovation in mobile mapping solutions.

    Middle East and Africa : Untapped Potential and Growth

    The Middle East and Africa region is gradually emerging in the mobile mapping market, currently holding about 5% of the global share. The growth is primarily driven by increasing investments in infrastructure and urban development projects. Countries like the UAE and South Africa are leading the way, with government initiatives aimed at enhancing geographic data collection and usage. The region's potential is further supported by the growing demand for smart city solutions and improved transportation systems. The UAE is at the forefront, leveraging mobile mapping technologies for urban planning and development. South Africa is also making strides, focusing on integrating mobile mapping into various sectors, including mining and agriculture. The competitive landscape is characterized by a mix of local and international players, creating opportunities for collaboration and innovation in the mobile mapping space.

    Key Players and Competitive Insights

    The Mobile Mapping Market is currently characterized by a dynamic competitive landscape, driven by technological advancements and increasing demand for geospatial data across various sectors. Key players such as Google (US), HERE Technologies (NL), and Trimble (US) are at the forefront, each adopting distinct strategies to enhance their market positioning. Google (US) continues to leverage its extensive data ecosystem, focusing on integrating AI and machine learning into its mapping solutions, thereby improving user experience and operational efficiency. HERE Technologies (NL), on the other hand, emphasizes partnerships with automotive manufacturers to enhance its mapping capabilities for autonomous vehicles, indicating a strategic pivot towards the burgeoning automotive sector. Trimble (US) appears to be concentrating on expanding its software solutions for construction and agriculture, which suggests a diversification strategy aimed at tapping into niche markets within the mobile mapping domain.

    The business tactics employed by these companies reflect a moderately fragmented market structure, where localized manufacturing and supply chain optimization are becoming increasingly vital. Companies are actively seeking to enhance their operational efficiencies while also addressing regional market needs. This competitive structure allows for a variety of players to coexist, each contributing to the overall growth of the mobile mapping ecosystem. The collective influence of these key players is shaping a landscape where innovation and strategic partnerships are paramount.

    In August 2025, HERE Technologies (NL) announced a collaboration with a leading automotive manufacturer to integrate its mapping solutions into next-generation vehicles. This partnership is strategically significant as it positions HERE at the forefront of the autonomous driving revolution, potentially increasing its market share in the automotive sector. The integration of real-time mapping data into vehicles could enhance safety and navigation, thereby solidifying HERE's reputation as a leader in mobile mapping technology.

    In September 2025, Trimble (US) launched a new suite of software tools designed specifically for the construction industry, aimed at improving project management and site efficiency. This move underscores Trimble's commitment to innovation and its focus on providing tailored solutions that meet the specific needs of its clients. By enhancing its software offerings, Trimble is likely to strengthen its competitive edge and attract a broader customer base within the construction sector.

    In October 2025, Google (US) unveiled an upgraded version of its mapping platform, incorporating advanced AI features that enhance real-time data processing and user interaction. This development is indicative of Google's ongoing investment in technology and innovation, which may further entrench its position as a market leader. The emphasis on AI integration not only improves user experience but also aligns with broader trends in digital transformation across industries.

    As of October 2025, the Mobile Mapping Market is witnessing trends that emphasize digitalization, sustainability, and the integration of artificial intelligence. Strategic alliances are increasingly shaping the competitive landscape, as companies recognize the value of collaboration in driving innovation. Looking ahead, it appears that competitive differentiation will evolve from traditional price-based competition to a focus on technological advancements, innovative solutions, and reliable supply chains. This shift may redefine how companies position themselves in the market, ultimately fostering a more resilient and adaptive mobile mapping ecosystem.

    Key Companies in the Mobile Mapping Market market include

    Industry Developments

    • Q2 2024: Hexagon launches Leica Pegasus TRK100 mobile mapping solution Hexagon AB announced the launch of the Leica Pegasus TRK100, a new mobile mapping system designed for capturing geospatial data with enhanced efficiency and accuracy. The product is aimed at professionals in surveying, construction, and asset management.
    • Q1 2024: Trimble Introduces New Mobile Mapping Market System for Transportation Infrastructure Trimble unveiled a new mobile mapping system specifically designed for transportation infrastructure projects, offering improved data collection capabilities for road and rail asset management.
    • Q2 2024: Topcon Launches Next-Generation Mobile Mapping Market Platform Topcon Corporation announced the release of its next-generation mobile mapping platform, featuring advanced LiDAR and imaging technologies for enhanced geospatial data acquisition.
    • Q2 2024: Cyclomedia Expands Mobile Mapping Market Operations with New Facility in North America Cyclomedia Technology B.V. opened a new facility in North America to support its expanding mobile mapping operations and meet growing demand for high-resolution geospatial data services.
    • Q1 2024: Javad GNSS Announces Strategic Partnership with Geosystems for Mobile Mapping Market Solutions Javad GNSS Inc. entered into a strategic partnership with Geosystems to jointly develop and market advanced mobile mapping solutions targeting infrastructure and urban planning sectors.
    • Q2 2024: OpTech LLC Secures Major Contract for Mobile Mapping Market of State Highways OpTech LLC was awarded a significant contract to provide mobile mapping services for state highway infrastructure, focusing on asset inventory and condition assessment.
    • Q1 2024: Mitsubishi Corporation Invests in Mobile Mapping Market Startup for Smart City Applications Mitsubishi Corporation announced an investment in a mobile mapping startup to accelerate the development of smart city solutions leveraging advanced geospatial technologies.
    • Q2 2024: EveryScape Inc. Launches AI-Powered Mobile Mapping Market Platform EveryScape Inc. introduced a new AI-powered mobile mapping platform designed to automate geospatial data processing and improve mapping accuracy for urban environments.
    • Q1 2025: Hexagon AB Acquires Geospatial Startup to Enhance Mobile Mapping Market Capabilities Hexagon AB completed the acquisition of a geospatial technology startup to strengthen its mobile mapping product portfolio and accelerate innovation in 3D mapping solutions.
    • Q2 2025: Trimble Wins Contract for Mobile Mapping Market of National Rail Network Trimble Inc. secured a contract to provide mobile mapping services for a national rail network, supporting infrastructure monitoring and digital asset management.
    • Q1 2025: Topcon Corporation Appoints New Head of Mobile Mapping Market Division Topcon Corporation announced the appointment of a new executive to lead its mobile mapping division, aiming to drive growth and innovation in geospatial technologies.
    • Q2 2025: Cyclomedia Technology B.V. Partners with Municipalities for Urban Mobile Mapping Market Projects Cyclomedia Technology B.V. entered into partnerships with several municipalities to deliver urban mobile mapping projects focused on infrastructure planning and asset management.

    Future Outlook

    Mobile Mapping Market Future Outlook

    <p>The Mobile Mapping Market is poised for growth at a 10.69% CAGR from 2024 to 2035, driven by advancements in technology, increased demand for geospatial data, and urbanization.</p>

    New opportunities lie in:

    • <p>Integration of AI-driven analytics for enhanced data interpretation.</p>
    • <p>Development of subscription-based mapping services for continuous revenue.</p>
    • <p>Expansion into emerging markets with tailored mobile mapping solutions.</p>

    <p>By 2035, the Mobile Mapping Market is expected to achieve substantial growth, driven by innovation and strategic market positioning.</p>

    Market Segmentation

    Mobile Mapping Market End User Outlook

    • Real Estate & Construction
    • IT & Telecom
    • Others

    Mobile Mapping Market Solution Outlook

    • Location-Based
    • Indoor Mapping
    • Asset Management
    • 3D Mapping

    Mobile Mapping Market Component Outlook

    • Hardware
    • Software
    • Services

    Mobile Mapping Market Application Outlook

    • Land Surveys
    • Aerial Surveys

    Report Scope

    MARKET SIZE 202431.76(USD Billion)
    MARKET SIZE 202535.16(USD Billion)
    MARKET SIZE 203597.09(USD Billion)
    COMPOUND ANNUAL GROWTH RATE (CAGR)10.69% (2024 - 2035)
    REPORT COVERAGERevenue Forecast, Competitive Landscape, Growth Factors, and Trends
    BASE YEAR2024
    Market Forecast Period2025 - 2035
    Historical Data2019 - 2024
    Market Forecast UnitsUSD Billion
    Key Companies ProfiledMarket analysis in progress
    Segments CoveredMarket segmentation analysis in progress
    Key Market OpportunitiesIntegration of artificial intelligence and machine learning enhances data accuracy in the Mobile Mapping Market.
    Key Market DynamicsTechnological advancements and regulatory changes drive innovation and competition in the Mobile Mapping Market.
    Countries CoveredNorth America, Europe, APAC, South America, MEA

    FAQs

    What is the current valuation of the Mobile Mapping Market as of 2024?

    The Mobile Mapping Market was valued at 31.76 USD Billion in 2024.

    What is the projected market size for the Mobile Mapping Market by 2035?

    The Mobile Mapping Market is projected to reach 97.09 USD Billion by 2035.

    What is the expected CAGR for the Mobile Mapping Market during the forecast period 2025 - 2035?

    The expected CAGR for the Mobile Mapping Market during the forecast period 2025 - 2035 is 10.69%.

    Which companies are considered key players in the Mobile Mapping Market?

    Key players in the Mobile Mapping Market include Google, Apple, HERE Technologies, Esri, Trimble, Autodesk, Fugro, RIEGL, and Leica Geosystems.

    What are the main components of the Mobile Mapping Market and their valuations?

    The main components include Hardware valued at 30.0 USD Billion, Software at 36.0 USD Billion, and Services at 31.09 USD Billion.

    What solutions are driving growth in the Mobile Mapping Market?

    Key solutions include Location-Based services valued at 25.0 USD Billion, Indoor Mapping at 20.0 USD Billion, Asset Management at 30.0 USD Billion, and 3D Mapping at 22.09 USD Billion.

    1. SECTION I: EXECUTIVE SUMMARY AND KEY HIGHLIGHTS
      1. EXECUTIVE SUMMARY
        1. Market Overview
        2. Key Findings
        3. Market Segmentation
        4. Competitive Landscape
        5. Challenges and Opportunities
        6. Future Outlook
    2. SECTION II: SCOPING, METHODOLOGY AND MARKET STRUCTURE
      1. MARKET INTRODUCTION
        1. Definition
        2. Scope of the study
      2. RESEARCH METHODOLOGY
        1. Overview
        2. Data Mining
        3. Secondary Research
        4. Primary Research
        5. Forecasting Model
        6. Market Size Estimation
        7. Data Triangulation
        8. Validation
    3. SECTION III: QUALITATIVE ANALYSIS
      1. MARKET DYNAMICS
        1. Overview
        2. Drivers
        3. Restraints
        4. Opportunities
      2. MARKET FACTOR ANALYSIS
        1. Value chain Analysis
        2. Porter's Five Forces Analysis
        3. COVID-19 Impact Analysis
    4. SECTION IV: QUANTITATIVE ANALYSIS
      1. Information and Communications Technology, BY Component (USD Billion)
        1. Hardware
        2. Software
        3. Services
      2. Information and Communications Technology, BY Solution (USD Billion)
        1. Location-Based
        2. Indoor Mapping
        3. Asset Management
        4. 3D Mapping
      3. Information and Communications Technology, BY Application (USD Billion)
        1. Land Surveys
        2. Aerial Surveys
      4. Information and Communications Technology, BY End User (USD Billion)
        1. Real Estate & Construction
        2. IT & Telecom
        3. Others
      5. Information and Communications Technology, BY Region (USD Billion)
        1. North America
        2. Europe
        3. APAC
        4. South America
        5. MEA
    5. SECTION V: COMPETITIVE ANALYSIS
      1. Competitive Landscape
        1. Overview
        2. Competitive Analysis
        3. Market share Analysis
        4. Major Growth Strategy in the Information and Communications Technology
        5. Competitive Benchmarking
        6. Leading Players in Terms of Number of Developments in the Information and Communications Technology
        7. Key developments and growth strategies
        8. Major Players Financial Matrix
      2. Company Profiles
        1. Google (US)
        2. Apple (US)
        3. HERE Technologies (NL)
        4. Esri (US)
        5. Trimble (US)
        6. Autodesk (US)
        7. Fugro (NL)
        8. RIEGL (AT)
        9. Leica Geosystems (CH)
      3. Appendix
        1. References
        2. Related Reports
    6. LIST OF FIGURES
      1. MARKET SYNOPSIS
      2. NORTH AMERICA MARKET ANALYSIS
      3. US MARKET ANALYSIS BY COMPONENT
      4. US MARKET ANALYSIS BY SOLUTION
      5. US MARKET ANALYSIS BY APPLICATION
      6. US MARKET ANALYSIS BY END USER
      7. CANADA MARKET ANALYSIS BY COMPONENT
      8. CANADA MARKET ANALYSIS BY SOLUTION
      9. CANADA MARKET ANALYSIS BY APPLICATION
      10. CANADA MARKET ANALYSIS BY END USER
      11. EUROPE MARKET ANALYSIS
      12. GERMANY MARKET ANALYSIS BY COMPONENT
      13. GERMANY MARKET ANALYSIS BY SOLUTION
      14. GERMANY MARKET ANALYSIS BY APPLICATION
      15. GERMANY MARKET ANALYSIS BY END USER
      16. UK MARKET ANALYSIS BY COMPONENT
      17. UK MARKET ANALYSIS BY SOLUTION
      18. UK MARKET ANALYSIS BY APPLICATION
      19. UK MARKET ANALYSIS BY END USER
      20. FRANCE MARKET ANALYSIS BY COMPONENT
      21. FRANCE MARKET ANALYSIS BY SOLUTION
      22. FRANCE MARKET ANALYSIS BY APPLICATION
      23. FRANCE MARKET ANALYSIS BY END USER
      24. RUSSIA MARKET ANALYSIS BY COMPONENT
      25. RUSSIA MARKET ANALYSIS BY SOLUTION
      26. RUSSIA MARKET ANALYSIS BY APPLICATION
      27. RUSSIA MARKET ANALYSIS BY END USER
      28. ITALY MARKET ANALYSIS BY COMPONENT
      29. ITALY MARKET ANALYSIS BY SOLUTION
      30. ITALY MARKET ANALYSIS BY APPLICATION
      31. ITALY MARKET ANALYSIS BY END USER
      32. SPAIN MARKET ANALYSIS BY COMPONENT
      33. SPAIN MARKET ANALYSIS BY SOLUTION
      34. SPAIN MARKET ANALYSIS BY APPLICATION
      35. SPAIN MARKET ANALYSIS BY END USER
      36. REST OF EUROPE MARKET ANALYSIS BY COMPONENT
      37. REST OF EUROPE MARKET ANALYSIS BY SOLUTION
      38. REST OF EUROPE MARKET ANALYSIS BY APPLICATION
      39. REST OF EUROPE MARKET ANALYSIS BY END USER
      40. APAC MARKET ANALYSIS
      41. CHINA MARKET ANALYSIS BY COMPONENT
      42. CHINA MARKET ANALYSIS BY SOLUTION
      43. CHINA MARKET ANALYSIS BY APPLICATION
      44. CHINA MARKET ANALYSIS BY END USER
      45. INDIA MARKET ANALYSIS BY COMPONENT
      46. INDIA MARKET ANALYSIS BY SOLUTION
      47. INDIA MARKET ANALYSIS BY APPLICATION
      48. INDIA MARKET ANALYSIS BY END USER
      49. JAPAN MARKET ANALYSIS BY COMPONENT
      50. JAPAN MARKET ANALYSIS BY SOLUTION
      51. JAPAN MARKET ANALYSIS BY APPLICATION
      52. JAPAN MARKET ANALYSIS BY END USER
      53. SOUTH KOREA MARKET ANALYSIS BY COMPONENT
      54. SOUTH KOREA MARKET ANALYSIS BY SOLUTION
      55. SOUTH KOREA MARKET ANALYSIS BY APPLICATION
      56. SOUTH KOREA MARKET ANALYSIS BY END USER
      57. MALAYSIA MARKET ANALYSIS BY COMPONENT
      58. MALAYSIA MARKET ANALYSIS BY SOLUTION
      59. MALAYSIA MARKET ANALYSIS BY APPLICATION
      60. MALAYSIA MARKET ANALYSIS BY END USER
      61. THAILAND MARKET ANALYSIS BY COMPONENT
      62. THAILAND MARKET ANALYSIS BY SOLUTION
      63. THAILAND MARKET ANALYSIS BY APPLICATION
      64. THAILAND MARKET ANALYSIS BY END USER
      65. INDONESIA MARKET ANALYSIS BY COMPONENT
      66. INDONESIA MARKET ANALYSIS BY SOLUTION
      67. INDONESIA MARKET ANALYSIS BY APPLICATION
      68. INDONESIA MARKET ANALYSIS BY END USER
      69. REST OF APAC MARKET ANALYSIS BY COMPONENT
      70. REST OF APAC MARKET ANALYSIS BY SOLUTION
      71. REST OF APAC MARKET ANALYSIS BY APPLICATION
      72. REST OF APAC MARKET ANALYSIS BY END USER
      73. SOUTH AMERICA MARKET ANALYSIS
      74. BRAZIL MARKET ANALYSIS BY COMPONENT
      75. BRAZIL MARKET ANALYSIS BY SOLUTION
      76. BRAZIL MARKET ANALYSIS BY APPLICATION
      77. BRAZIL MARKET ANALYSIS BY END USER
      78. MEXICO MARKET ANALYSIS BY COMPONENT
      79. MEXICO MARKET ANALYSIS BY SOLUTION
      80. MEXICO MARKET ANALYSIS BY APPLICATION
      81. MEXICO MARKET ANALYSIS BY END USER
      82. ARGENTINA MARKET ANALYSIS BY COMPONENT
      83. ARGENTINA MARKET ANALYSIS BY SOLUTION
      84. ARGENTINA MARKET ANALYSIS BY APPLICATION
      85. ARGENTINA MARKET ANALYSIS BY END USER
      86. REST OF SOUTH AMERICA MARKET ANALYSIS BY COMPONENT
      87. REST OF SOUTH AMERICA MARKET ANALYSIS BY SOLUTION
      88. REST OF SOUTH AMERICA MARKET ANALYSIS BY APPLICATION
      89. REST OF SOUTH AMERICA MARKET ANALYSIS BY END USER
      90. MEA MARKET ANALYSIS
      91. GCC COUNTRIES MARKET ANALYSIS BY COMPONENT
      92. GCC COUNTRIES MARKET ANALYSIS BY SOLUTION
      93. GCC COUNTRIES MARKET ANALYSIS BY APPLICATION
      94. GCC COUNTRIES MARKET ANALYSIS BY END USER
      95. SOUTH AFRICA MARKET ANALYSIS BY COMPONENT
      96. SOUTH AFRICA MARKET ANALYSIS BY SOLUTION
      97. SOUTH AFRICA MARKET ANALYSIS BY APPLICATION
      98. SOUTH AFRICA MARKET ANALYSIS BY END USER
      99. REST OF MEA MARKET ANALYSIS BY COMPONENT
      100. REST OF MEA MARKET ANALYSIS BY SOLUTION
      101. REST OF MEA MARKET ANALYSIS BY APPLICATION
      102. REST OF MEA MARKET ANALYSIS BY END USER
      103. KEY BUYING CRITERIA OF INFORMATION AND COMMUNICATIONS TECHNOLOGY
      104. RESEARCH PROCESS OF MRFR
      105. DRO ANALYSIS OF INFORMATION AND COMMUNICATIONS TECHNOLOGY
      106. DRIVERS IMPACT ANALYSIS: INFORMATION AND COMMUNICATIONS TECHNOLOGY
      107. RESTRAINTS IMPACT ANALYSIS: INFORMATION AND COMMUNICATIONS TECHNOLOGY
      108. SUPPLY / VALUE CHAIN: INFORMATION AND COMMUNICATIONS TECHNOLOGY
      109. INFORMATION AND COMMUNICATIONS TECHNOLOGY, BY COMPONENT, 2024 (% SHARE)
      110. INFORMATION AND COMMUNICATIONS TECHNOLOGY, BY COMPONENT, 2024 TO 2035 (USD Billion)
      111. INFORMATION AND COMMUNICATIONS TECHNOLOGY, BY SOLUTION, 2024 (% SHARE)
      112. INFORMATION AND COMMUNICATIONS TECHNOLOGY, BY SOLUTION, 2024 TO 2035 (USD Billion)
      113. INFORMATION AND COMMUNICATIONS TECHNOLOGY, BY APPLICATION, 2024 (% SHARE)
      114. INFORMATION AND COMMUNICATIONS TECHNOLOGY, BY APPLICATION, 2024 TO 2035 (USD Billion)
      115. INFORMATION AND COMMUNICATIONS TECHNOLOGY, BY END USER, 2024 (% SHARE)
      116. INFORMATION AND COMMUNICATIONS TECHNOLOGY, BY END USER, 2024 TO 2035 (USD Billion)
      117. BENCHMARKING OF MAJOR COMPETITORS
    7. LIST OF TABLES
      1. LIST OF ASSUMPTIONS
      2. 7.1.1
      3. North America MARKET SIZE ESTIMATES; FORECAST
        1. BY COMPONENT, 2025-2035 (USD Billion)
        2. BY SOLUTION, 2025-2035 (USD Billion)
        3. BY APPLICATION, 2025-2035 (USD Billion)
        4. BY END USER, 2025-2035 (USD Billion)
      4. US MARKET SIZE ESTIMATES; FORECAST
        1. BY COMPONENT, 2025-2035 (USD Billion)
        2. BY SOLUTION, 2025-2035 (USD Billion)
        3. BY APPLICATION, 2025-2035 (USD Billion)
        4. BY END USER, 2025-2035 (USD Billion)
      5. Canada MARKET SIZE ESTIMATES; FORECAST
        1. BY COMPONENT, 2025-2035 (USD Billion)
        2. BY SOLUTION, 2025-2035 (USD Billion)
        3. BY APPLICATION, 2025-2035 (USD Billion)
        4. BY END USER, 2025-2035 (USD Billion)
      6. Europe MARKET SIZE ESTIMATES; FORECAST
        1. BY COMPONENT, 2025-2035 (USD Billion)
        2. BY SOLUTION, 2025-2035 (USD Billion)
        3. BY APPLICATION, 2025-2035 (USD Billion)
        4. BY END USER, 2025-2035 (USD Billion)
      7. Germany MARKET SIZE ESTIMATES; FORECAST
        1. BY COMPONENT, 2025-2035 (USD Billion)
        2. BY SOLUTION, 2025-2035 (USD Billion)
        3. BY APPLICATION, 2025-2035 (USD Billion)
        4. BY END USER, 2025-2035 (USD Billion)
      8. UK MARKET SIZE ESTIMATES; FORECAST
        1. BY COMPONENT, 2025-2035 (USD Billion)
        2. BY SOLUTION, 2025-2035 (USD Billion)
        3. BY APPLICATION, 2025-2035 (USD Billion)
        4. BY END USER, 2025-2035 (USD Billion)
      9. France MARKET SIZE ESTIMATES; FORECAST
        1. BY COMPONENT, 2025-2035 (USD Billion)
        2. BY SOLUTION, 2025-2035 (USD Billion)
        3. BY APPLICATION, 2025-2035 (USD Billion)
        4. BY END USER, 2025-2035 (USD Billion)
      10. Russia MARKET SIZE ESTIMATES; FORECAST
        1. BY COMPONENT, 2025-2035 (USD Billion)
        2. BY SOLUTION, 2025-2035 (USD Billion)
        3. BY APPLICATION, 2025-2035 (USD Billion)
        4. BY END USER, 2025-2035 (USD Billion)
      11. Italy MARKET SIZE ESTIMATES; FORECAST
        1. BY COMPONENT, 2025-2035 (USD Billion)
        2. BY SOLUTION, 2025-2035 (USD Billion)
        3. BY APPLICATION, 2025-2035 (USD Billion)
        4. BY END USER, 2025-2035 (USD Billion)
      12. Spain MARKET SIZE ESTIMATES; FORECAST
        1. BY COMPONENT, 2025-2035 (USD Billion)
        2. BY SOLUTION, 2025-2035 (USD Billion)
        3. BY APPLICATION, 2025-2035 (USD Billion)
        4. BY END USER, 2025-2035 (USD Billion)
      13. Rest of Europe MARKET SIZE ESTIMATES; FORECAST
        1. BY COMPONENT, 2025-2035 (USD Billion)
        2. BY SOLUTION, 2025-2035 (USD Billion)
        3. BY APPLICATION, 2025-2035 (USD Billion)
        4. BY END USER, 2025-2035 (USD Billion)
      14. APAC MARKET SIZE ESTIMATES; FORECAST
        1. BY COMPONENT, 2025-2035 (USD Billion)
        2. BY SOLUTION, 2025-2035 (USD Billion)
        3. BY APPLICATION, 2025-2035 (USD Billion)
        4. BY END USER, 2025-2035 (USD Billion)
      15. China MARKET SIZE ESTIMATES; FORECAST
        1. BY COMPONENT, 2025-2035 (USD Billion)
        2. BY SOLUTION, 2025-2035 (USD Billion)
        3. BY APPLICATION, 2025-2035 (USD Billion)
        4. BY END USER, 2025-2035 (USD Billion)
      16. India MARKET SIZE ESTIMATES; FORECAST
        1. BY COMPONENT, 2025-2035 (USD Billion)
        2. BY SOLUTION, 2025-2035 (USD Billion)
        3. BY APPLICATION, 2025-2035 (USD Billion)
        4. BY END USER, 2025-2035 (USD Billion)
      17. Japan MARKET SIZE ESTIMATES; FORECAST
        1. BY COMPONENT, 2025-2035 (USD Billion)
        2. BY SOLUTION, 2025-2035 (USD Billion)
        3. BY APPLICATION, 2025-2035 (USD Billion)
        4. BY END USER, 2025-2035 (USD Billion)
      18. South Korea MARKET SIZE ESTIMATES; FORECAST
        1. BY COMPONENT, 2025-2035 (USD Billion)
        2. BY SOLUTION, 2025-2035 (USD Billion)
        3. BY APPLICATION, 2025-2035 (USD Billion)
        4. BY END USER, 2025-2035 (USD Billion)
      19. Malaysia MARKET SIZE ESTIMATES; FORECAST
        1. BY COMPONENT, 2025-2035 (USD Billion)
        2. BY SOLUTION, 2025-2035 (USD Billion)
        3. BY APPLICATION, 2025-2035 (USD Billion)
        4. BY END USER, 2025-2035 (USD Billion)
      20. Thailand MARKET SIZE ESTIMATES; FORECAST
        1. BY COMPONENT, 2025-2035 (USD Billion)
        2. BY SOLUTION, 2025-2035 (USD Billion)
        3. BY APPLICATION, 2025-2035 (USD Billion)
        4. BY END USER, 2025-2035 (USD Billion)
      21. Indonesia MARKET SIZE ESTIMATES; FORECAST
        1. BY COMPONENT, 2025-2035 (USD Billion)
        2. BY SOLUTION, 2025-2035 (USD Billion)
        3. BY APPLICATION, 2025-2035 (USD Billion)
        4. BY END USER, 2025-2035 (USD Billion)
      22. Rest of APAC MARKET SIZE ESTIMATES; FORECAST
        1. BY COMPONENT, 2025-2035 (USD Billion)
        2. BY SOLUTION, 2025-2035 (USD Billion)
        3. BY APPLICATION, 2025-2035 (USD Billion)
        4. BY END USER, 2025-2035 (USD Billion)
      23. South America MARKET SIZE ESTIMATES; FORECAST
        1. BY COMPONENT, 2025-2035 (USD Billion)
        2. BY SOLUTION, 2025-2035 (USD Billion)
        3. BY APPLICATION, 2025-2035 (USD Billion)
        4. BY END USER, 2025-2035 (USD Billion)
      24. Brazil MARKET SIZE ESTIMATES; FORECAST
        1. BY COMPONENT, 2025-2035 (USD Billion)
        2. BY SOLUTION, 2025-2035 (USD Billion)
        3. BY APPLICATION, 2025-2035 (USD Billion)
        4. BY END USER, 2025-2035 (USD Billion)
      25. Mexico MARKET SIZE ESTIMATES; FORECAST
        1. BY COMPONENT, 2025-2035 (USD Billion)
        2. BY SOLUTION, 2025-2035 (USD Billion)
        3. BY APPLICATION, 2025-2035 (USD Billion)
        4. BY END USER, 2025-2035 (USD Billion)
      26. Argentina MARKET SIZE ESTIMATES; FORECAST
        1. BY COMPONENT, 2025-2035 (USD Billion)
        2. BY SOLUTION, 2025-2035 (USD Billion)
        3. BY APPLICATION, 2025-2035 (USD Billion)
        4. BY END USER, 2025-2035 (USD Billion)
      27. Rest of South America MARKET SIZE ESTIMATES; FORECAST
        1. BY COMPONENT, 2025-2035 (USD Billion)
        2. BY SOLUTION, 2025-2035 (USD Billion)
        3. BY APPLICATION, 2025-2035 (USD Billion)
        4. BY END USER, 2025-2035 (USD Billion)
      28. MEA MARKET SIZE ESTIMATES; FORECAST
        1. BY COMPONENT, 2025-2035 (USD Billion)
        2. BY SOLUTION, 2025-2035 (USD Billion)
        3. BY APPLICATION, 2025-2035 (USD Billion)
        4. BY END USER, 2025-2035 (USD Billion)
      29. GCC Countries MARKET SIZE ESTIMATES; FORECAST
        1. BY COMPONENT, 2025-2035 (USD Billion)
        2. BY SOLUTION, 2025-2035 (USD Billion)
        3. BY APPLICATION, 2025-2035 (USD Billion)
        4. BY END USER, 2025-2035 (USD Billion)
      30. South Africa MARKET SIZE ESTIMATES; FORECAST
        1. BY COMPONENT, 2025-2035 (USD Billion)
        2. BY SOLUTION, 2025-2035 (USD Billion)
        3. BY APPLICATION, 2025-2035 (USD Billion)
        4. BY END USER, 2025-2035 (USD Billion)
      31. Rest of MEA MARKET SIZE ESTIMATES; FORECAST
        1. BY COMPONENT, 2025-2035 (USD Billion)
        2. BY SOLUTION, 2025-2035 (USD Billion)
        3. BY APPLICATION, 2025-2035 (USD Billion)
        4. BY END USER, 2025-2035 (USD Billion)
      32. PRODUCT LAUNCH/PRODUCT DEVELOPMENT/APPROVAL
      33. 7.31.1
      34. ACQUISITION/PARTNERSHIP
      35. 7.32.1

    Mobile Mapping Market Segmentation

    Mobile Mapping Component Outlook (USD Billion, 2018-2032)

    • Hardware
    • Software
    • Services

    Mobile Mapping Solution Outlook (USD Billion, 2018-2032)

    • Location-Based
    • Indoor Mapping
    • Asset Management
    • 3D Mapping

    Mobile Mapping Application Outlook (USD Billion, 2018-2032)

    • Land Surveys
    • Aerial Surveys

    Mobile Mapping End-User Outlook (USD Billion, 2018-2032)

    • Real Estate & Construction
    • IT & Telecom
    • Others

    Mobile Mapping Regional Outlook (USD Billion, 2018-2032)

    • North America Outlook (USD Billion, 2018-2032)

      • North America Mobile Mapping by Component
        • Hardware
        • Software
        • Services
      • North America Mobile Mapping by Solution
        • Location-Based
        • Indoor Mapping
        • Asset Management
        • 3D Mapping
      • North America Mobile Mapping by Application
        • Land Surveys
        • Aerial Surveys
      • North America Mobile Mapping by End-User
        • Real Estate & Construction
        • IT & Telecom
        • Others
      • US Outlook (USD Billion, 2018-2032)

      • US Mobile Mapping by Component
        • Hardware
        • Software
        • Services
      • US Mobile Mapping by Solution
        • Location-Based
        • Indoor Mapping
        • Asset Management
        • 3D Mapping
      • US Mobile Mapping by Application
        • Land Surveys
        • Aerial Surveys
      • US Mobile Mapping by End-User
        • Real Estate & Construction
        • IT & Telecom
        • Others
      • CANADA Outlook (USD Billion, 2018-2032)

      • CANADA Mobile Mapping by Component
        • Hardware
        • Software
        • Services
      • CANADA Mobile Mapping by Solution
        • Location-Based
        • Indoor Mapping
        • Asset Management
        • 3D Mapping
      • CANADA Mobile Mapping by Application
        • Land Surveys
        • Aerial Surveys
      • CANADA Mobile Mapping by End-User
        • Real Estate & Construction
        • IT & Telecom
        • Others
    • Europe Outlook (USD Billion, 2018-2032)

      • Europe Mobile Mapping by Component
        • Hardware
        • Software
        • Services
      • Europe Mobile Mapping by Solution
        • Location-Based
        • Indoor Mapping
        • Asset Management
        • 3D Mapping
      • Europe Mobile Mapping by Application
        • Land Surveys
        • Aerial Surveys
      • Europe Mobile Mapping by End-User
        • Real Estate & Construction
        • IT & Telecom
        • Others
      • Germany Outlook (USD Billion, 2018-2032)

      • Germany Mobile Mapping by Component
        • Hardware
        • Software
        • Services
      • Germany Mobile Mapping by Solution
        • Location-Based
        • Indoor Mapping
        • Asset Management
        • 3D Mapping
      • Germany Mobile Mapping by Application
        • Land Surveys
        • Aerial Surveys
      • Germany Mobile Mapping by End-User
        • Real Estate & Construction
        • IT & Telecom
        • Others
      • France Outlook (USD Billion, 2018-2032)

      • France Mobile Mapping by Component
        • Hardware
        • Software
        • Services
      • France Mobile Mapping by Solution
        • Location-Based
        • Indoor Mapping
        • Asset Management
        • 3D Mapping
      • France Mobile Mapping by Application
        • Land Surveys
        • Aerial Surveys
      • France Mobile Mapping by End-User
        • Real Estate & Construction
        • IT & Telecom
        • Others
      • UK Outlook (USD Billion, 2018-2032)

      • UK Mobile Mapping by Component
        • Hardware
        • Software
        • Services
      • UK Mobile Mapping by Solution
        • Location-Based
        • Indoor Mapping
        • Asset Management
        • 3D Mapping
      • UK Mobile Mapping by Application
        • Land Surveys
        • Aerial Surveys
      • UK Mobile Mapping by End-User
        • Real Estate & Construction
        • IT & Telecom
        • Others
      • ITALY Outlook (USD Billion, 2018-2032)

      • ITALY Mobile Mapping by Component
        • Hardware
        • Software
        • Services
      • ITALY Mobile Mapping by Solution
        • Location-Based
        • Indoor Mapping
        • Asset Management
        • 3D Mapping
      • ITALY Mobile Mapping by Application
        • Land Surveys
        • Aerial Surveys
      • ITALY Mobile Mapping by End-User
        • Real Estate & Construction
        • IT & Telecom
        • Others
      • SPAIN Outlook (USD Billion, 2018-2032)

      • Spain Mobile Mapping by Component
        • Hardware
        • Software
        • Services
      • Spain Mobile Mapping by Solution
        • Location-Based
        • Indoor Mapping
        • Asset Management
        • 3D Mapping
      • Spain Mobile Mapping by Application
        • Land Surveys
        • Aerial Surveys
      • Spain Mobile Mapping by End-User
        • Real Estate & Construction
        • IT & Telecom
        • Others
      • Rest Of Europe Outlook (USD Billion, 2018-2032)

      • Rest Of Europe Mobile Mapping by Component
        • Hardware
        • Software
        • Services
      • Rest Of Europe Mobile Mapping by Solution
        • Location-Based
        • Indoor Mapping
        • Asset Management
        • 3D Mapping
      • Rest Of Europe Mobile Mapping by Application
        • Land Surveys
        • Aerial Surveys
      • Rest Of Europe Mobile Mapping by End-User
        • Real Estate & Construction
        • IT & Telecom
        • Others
    • Asia-Pacific Outlook (USD Billion, 2018-2032)

      • Asia-Pacific Mobile Mapping by Component
        • Hardware
        • Software
        • Services
      • Asia-Pacific Mobile Mapping by Solution
        • Location-Based
        • Indoor Mapping
        • Asset Management
        • 3D Mapping
      • Asia-Pacific Mobile Mapping by Application
        • Land Surveys
        • Aerial Surveys
      • Asia-Pacific Mobile Mapping by End-User
        • Real Estate & Construction
        • IT & Telecom
        • Others
      • China Outlook (USD Billion, 2018-2032)

      • China Mobile Mapping by Component
        • Hardware
        • Software
        • Services
      • China Mobile Mapping by Solution
        • Location-Based
        • Indoor Mapping
        • Asset Management
        • 3D Mapping
      • China Mobile Mapping by Application
        • Land Surveys
        • Aerial Surveys
      • China Mobile Mapping by End-User
        • Real Estate & Construction
        • IT & Telecom
        • Others
      • Japan Outlook (USD Billion, 2018-2032)

      • Japan Mobile Mapping by Component
        • Hardware
        • Software
        • Services
      • Japan Mobile Mapping by Solution
        • Location-Based
        • Indoor Mapping
        • Asset Management
        • 3D Mapping
      • Japan Mobile Mapping by Application
        • Land Surveys
        • Aerial Surveys
      • Japan Mobile Mapping by End-User
        • Real Estate & Construction
        • IT & Telecom
        • Others
      • India Outlook (USD Billion, 2018-2032)

      • India Mobile Mapping by Component
        • Hardware
        • Software
        • Services
      • India Mobile Mapping by Solution
        • Location-Based
        • Indoor Mapping
        • Asset Management
        • 3D Mapping
      • India Mobile Mapping by Application
        • Land Surveys
        • Aerial Surveys
      • India Mobile Mapping by End-User
        • Real Estate & Construction
        • IT & Telecom
        • Others
      • Australia Outlook (USD Billion, 2018-2032)

      • Australia Mobile Mapping by Component
        • Hardware
        • Software
        • Services
      • Australia Mobile Mapping by Solution
        • Location-Based
        • Indoor Mapping
        • Asset Management
        • 3D Mapping
      • Australia Mobile Mapping by Application
        • Land Surveys
        • Aerial Surveys
      • Australia Mobile Mapping by End-User
        • Real Estate & Construction
        • IT & Telecom
        • Others
      • Rest of Asia-Pacific Outlook (USD Billion, 2018-2032)

      • Rest of Asia-Pacific Mobile Mapping by Component
        • Hardware
        • Software
        • Services
      • Rest of Asia-Pacific Mobile Mapping by Solution
        • Location-Based
        • Indoor Mapping
        • Asset Management
        • 3D Mapping
      • Rest of Asia-Pacific Mobile Mapping by Application
        • Land Surveys
        • Aerial Surveys
      • Rest of Asia-Pacific Mobile Mapping by End-User
        • Real Estate & Construction
        • IT & Telecom
        • Others
    • Rest of the World Outlook (USD Billion, 2018-2032)

      • Rest of the World Mobile Mapping by Component
        • Hardware
        • Software
        • Services
      • Rest of the World Mobile Mapping by Solution
        • Location-Based
        • Indoor Mapping
        • Asset Management
        • 3D Mapping
      • Rest of the World Mobile Mapping by Application
        • Land Surveys
        • Aerial Surveys
      • Rest of the World Mobile Mapping by End-User
        • Real Estate & Construction
        • IT & Telecom
        • Others
      • Middle East Outlook (USD Billion, 2018-2032)

      • Middle East Mobile Mapping by Component
        • Hardware
        • Software
        • Services
      • Middle East Mobile Mapping by Solution
        • Location-Based
        • Indoor Mapping
        • Asset Management
        • 3D Mapping
      • Middle East Mobile Mapping by Application
        • Land Surveys
        • Aerial Surveys
      • Middle East Mobile Mapping by End-User
        • Real Estate & Construction
        • IT & Telecom
        • Others
      • Africa Outlook (USD Billion, 2018-2032)

      • Africa Mobile Mapping by Component
        • Hardware
        • Software
        • Services
      • Africa Mobile Mapping by Solution
        • Location-Based
        • Indoor Mapping
        • Asset Management
        • 3D Mapping
      • Africa Mobile Mapping by Application
        • Land Surveys
        • Aerial Surveys
      • Africa Mobile Mapping by End-User
        • Real Estate & Construction
        • IT & Telecom
        • Others
      • Latin America Outlook (USD Billion, 2018-2032)

      • Latin America Mobile Mapping by Component
        • Hardware
        • Software
        • Services
      • Latin America Mobile Mapping by Solution
        • Location-Based
        • Indoor Mapping
        • Asset Management
        • 3D Mapping
      • Latin America Mobile Mapping by Application
        • Land Surveys
        • Aerial Surveys
      • Latin America Mobile Mapping by End-User
        • Real Estate & Construction
        • IT & Telecom
        • Others
    Infographic

    Free Sample Request

    Kindly complete the form below to receive a free sample of this Report

    Get Free Sample

    Customer Strories

    “I am very pleased with how market segments have been defined in a relevant way for my purposes (such as "Portable Freezers & refrigerators" and "last-mile"). In general the report is well structured. Thanks very much for your efforts.”

    Victoria Milne

    Founder
    Case Study
    Chemicals and Materials

    Compare Licence

    ×
    Features License Type
    Single User Multiuser License Enterprise User
    Price $4,950 $5,950 $7,250
    Maximum User Access Limit 1 User Upto 10 Users Unrestricted Access Throughout the Organization
    Free Customization
    Direct Access to Analyst
    Deliverable Format
    Platform Access
    Discount on Next Purchase 10% 15% 15%
    Printable Versions