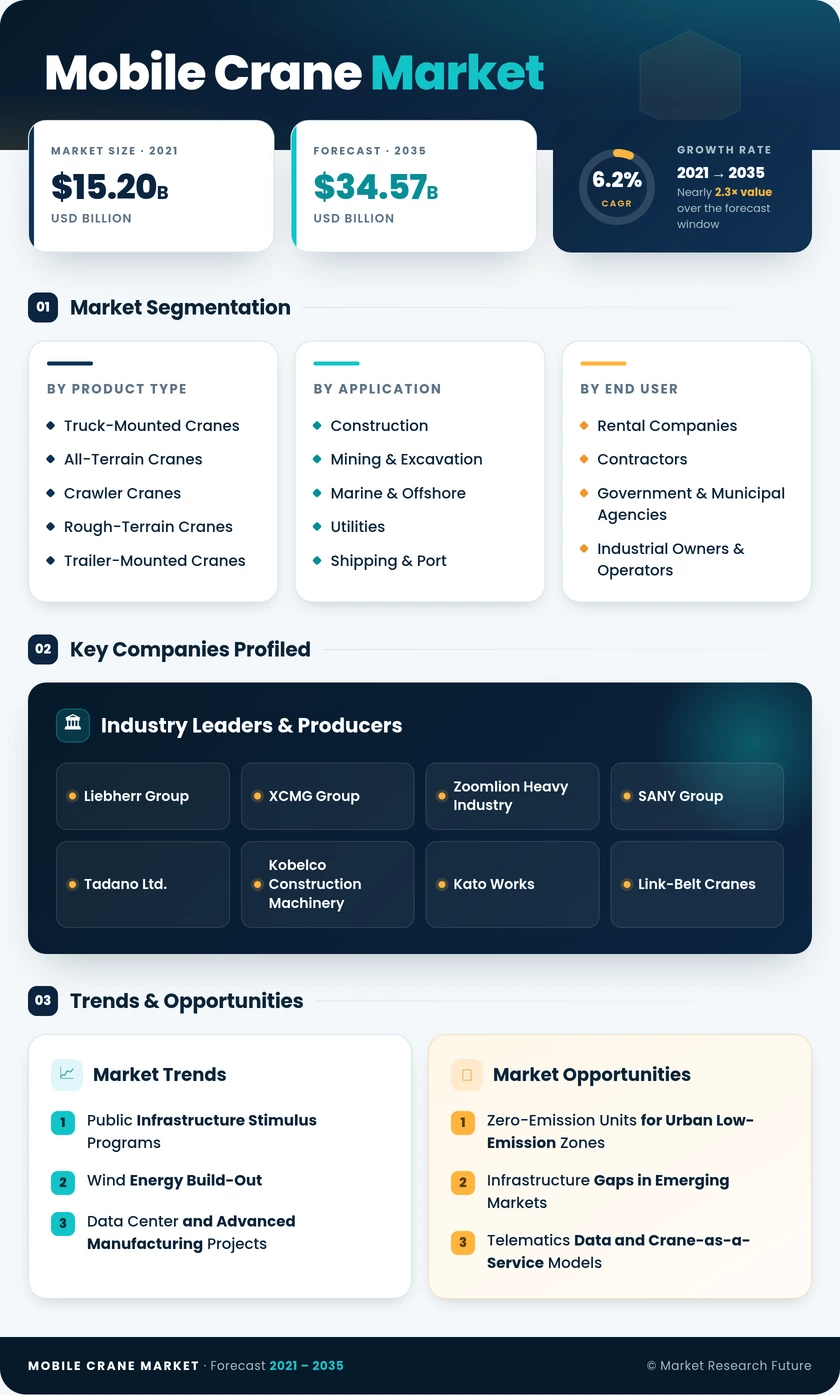
Mobile Crane Market (2026 - 2035)

ID: MRFR/PCM/2178-HCR 111 Pages Pradeep Nandi Last Updated: October 13, 2026
Mobile Crane Market Research Report Information By Product Type (Truck-Mounted Cranes, All-Terrain Cranes, Crawler Cranes, Rough-Terrain Cranes, and Trailer-Mounted Cranes), By Application (Construction, Mining & Excavation, Marine & Offshore, Utilities, Shipping & Port, and Others), By End User (Rental Companies, Contractors, Government & Municipal Agencies, and Industrial Owners & Operators), and By Lifting Capacity (Below 50 Tons, 50-150 Tons, 151-300 Tons, and Above 300 Tons) – Forecast Till 2035.
Mobile Crane Market
Market Size
Forecast Period2026-2035
CAGR (2026-2035)6.2%
2025 Market SizeUSD 19.00 billion
2035 Market SizeUSD 34.57 billion
Key Players
Liebherr Group
XCMG Group
Zoomlion Heavy Industry
SANY Group
Tadano Ltd.
Kobelco Construction Machinery
Opportunities
  • Zero-Emission Units for Urban Low-Emission Zones
  • Infrastructure Gaps in Emerging Markets
  • Telematics Data and Crane-as-a-Service Models
  1. 1 Market Summary | |
  2. 2 Key Report Takeaways | |
    1. 2.1 By Product Type | |
    2. 2.2 By Application | |
    3. 2.3 By End User | |
    4. 2.4 By Lifting Capacity | |
    5. 2.5 By Region | |
  3. 3 Market Size and Forecast (2021–2035) | |
  4. 4 Driver Impact Analysis | |
    1. 4.1 Public Infrastructure Stimulus Programs | |
    2. 4.2 Wind Energy Build-Out | |
    3. 4.3 Data Center and Advanced Manufacturing Projects | |
    4. 4.4 Emissions-Driven Fleet Renewal | |
    5. 4.5 Urbanization and Housing in Emerging Asia | |
    6. 4.6 Gulf Giga-Projects and Port Expansion | |
    7. 4.7 Telematics and Operator-Assist Automation | |
  5. 5 Restraints Impact Analysis | |
    1. 5.1 High Capital Cost and Financing Rates | |
    2. 5.2 China Property Sector Downturn | |
    3. 5.3 Skilled Operator Shortage | |
    4. 5.4 Steel and Component Cost Volatility | |
    5. 5.5 Used-Unit Overhang and Price Competition | |
  6. 6 Opportunities | |
    1. 6.1 Zero-Emission Units for Urban Low-Emission Zones | |
    2. 6.2 Infrastructure Gaps in Emerging Markets | |
    3. 6.3 Telematics Data and Crane-as-a-Service Models | |
    4. 6.4 Ultra-Heavy Lift for Nuclear and Energy Megaprojects | |
    5. 6.5 Remanufacturing and Aftermarket Services | |
  7. 7 Regional Market Share and Country-Level Analysis | |
    1. 7.1 North America | | |
      1. 7.1.1 United States | | |
      2. 7.1.2 Canada | | |
      3. 7.1.3 Rest of North America | |
    2. 7.2 Europe | | |
      1. 7.2.1 Germany | | |
      2. 7.2.2 United Kingdom | | |
      3. 7.2.3 France | | |
      4. 7.2.4 Rest of Europe | |
    3. 7.3 Asia-Pacific | | |
      1. 7.3.1 China | | |
      2. 7.3.2 India | | |
      3. 7.3.3 Japan | | |
      4. 7.3.4 Rest of Asia-Pacific | |
    4. 7.4 South America | | |
      1. 7.4.1 Brazil | | |
      2. 7.4.2 Rest of South America | |
    5. 7.5 Middle East & Africa | | |
      1. 7.5.1 Saudi Arabia | | |
      2. 7.5.2 United Arab Emirates | | |
      3. 7.5.3 Rest of Middle East & Africa | |
  8. 8 Future Outlook (2026–2035) | |
    1. 8.1 Automation and Digital Lift Planning | |
    2. 8.2 Fleet Electrification | |
    3. 8.3 Energy Transition Megaprojects | |
    4. 8.4 Rental Consolidation and ESG Disclosure | |
  9. 9 Segmentation Analysis | |
    1. 9.1 By Product Type | | |
      1. 9.1.1 Truck-Mounted Cranes | | |
      2. 9.1.2 All-Terrain Cranes | | |
      3. 9.1.3 Crawler Cranes | | |
      4. 9.1.4 Rough-Terrain Cranes | | |
      5. 9.1.5 Trailer-Mounted Cranes | |
    2. 9.2 By Application | | |
      1. 9.2.1 Construction | | |
      2. 9.2.2 Mining & Excavation | | |
      3. 9.2.3 Marine & Offshore | | |
      4. 9.2.4 Utilities | | |
      5. 9.2.5 Shipping & Port | | |
      6. 9.2.6 Others | |
    3. 9.3 By End User | | |
      1. 9.3.1 Rental Companies | | |
      2. 9.3.2 Contractors | | |
      3. 9.3.3 Government & Municipal Agencies | | |
      4. 9.3.4 Industrial Owners & Operators | |
    4. 9.4 By Lifting Capacity | | |
      1. 9.4.1 Below 50 Tons | | |
      2. 9.4.2 50-150 Tons | | |
      3. 9.4.3 151-300 Tons | | |
      4. 9.4.4 Above 300 Tons | |
  10. 10 Competitive Landscape | |
    1. 10.1 Market Concentration Analysis | |
    2. 10.2 Competitive Benchmarking Matrix | |
  11. 11 Recent News & Developments | |
  12. 12 Report Scope and Methodology | |
  13. 13 Detailed Sources and Citations | |
  14. 14 Frequently Asked Questions (FAQs) | | LIST OF TABLES | |
  15. TABLE 1 Global Market Snapshot – Key Metrics, 2025–2035 | |
  16. TABLE 2 Global Market Size and Forecast, 2021–2035 (USD billion) | |
  17. TABLE 3 Driver Impact Analysis – Directional CAGR Contribution | |
  18. TABLE 4 Restraints Impact Analysis – Directional CAGR Pressure | |
  19. TABLE 5 Regional Summary, 2025 | |
  20. TABLE 6 North America – Country-Level Analysis, 2025 | |
  21. TABLE 7 Europe – Country-Level Analysis, 2025 | |
  22. TABLE 8 Asia-Pacific – Country-Level Analysis, 2025 | |
  23. TABLE 9 South America – Country-Level Analysis, 2025 | |
  24. TABLE 10 Middle East & Africa – Country-Level Analysis, 2025 | |
  25. TABLE 11 Global Market by Product Type, 2025 | |
  26. TABLE 12 Global Market by Application, 2025 | |
  27. TABLE 13 Global Market by End User, 2025 | |
  28. TABLE 14 Global Market by Lifting Capacity, 2025 | |
  29. TABLE 15 Competitive Benchmarking Matrix, 2025 | |
  30. TABLE 16 Report Scope and Methodology | |
  31. TABLE 17 Detailed Sources and Citations | | LIST OF FIGURES | |
  32. FIGURE 1 Market Dynamics Overview – Drivers, Restraints and Opportunities | |
  33. FIGURE 2 Industry Value Chain Analysis | |
  34. FIGURE 3 Porter's Five Forces Analysis | |
  35. FIGURE 4 Global Market Size Trend, 2021–2035 (USD billion) | |
  36. FIGURE 5 Year-over-Year Growth Rate, 2021–2035 | |
  37. FIGURE 6 Market Share by Product Type, 2025 | |
  38. FIGURE 7 Market Share by Application, 2025 | |
  39. FIGURE 8 Market Share by End User, 2025 | |
  40. FIGURE 9 Market Share by Lifting Capacity, 2025 | |
  41. FIGURE 10 Regional Market Share, 2025 | |
  42. FIGURE 11 Regional Growth Comparison, 2026–2035 | |
  43. FIGURE 12 Competitive Landscape – Estimated Revenue Share Ranges, 2025

Segmentation Quick Reference

DimensionSub-SegmentsDominant SegmentFastest Growing Segment
By Product TypeTruck-Mounted Cranes; All-Terrain Cranes; Crawler Cranes; Rough-Terrain Cranes; Trailer-Mounted CranesTruck-Mounted Cranes (34.6% share)All-Terrain Cranes (6.3% CAGR)
By ApplicationConstruction; Mining & Excavation; Marine & Offshore; Utilities; Shipping & Port; OthersConstruction (49.8% share)Marine & Offshore (6.4% CAGR)
By End UserRental Companies; Contractors; Government & Municipal Agencies; Industrial Owners & OperatorsRental Companies (40.4% share)Government & Municipal Agencies (6.3% CAGR)
By Lifting CapacityBelow 50 Tons; 50-150 Tons; 151-300 Tons; Above 300 Tons50-150 Tons (36.1% share)Above 300 Tons (6.4% CAGR)
By RegionNorth America; Europe; Asia-Pacific; South America; Middle East & AfricaAsia-Pacific (41.5% share)Middle East & Africa (6.9% CAGR)

Market Segmentation Overview

By Product Type

Sub-SegmentKey Trend
Truck-Mounted CranesPrice-led demand in China, India and the Gulf
All-Terrain CranesStage V single-engine designs drive fleet consolidation.
Crawler CranesWind and petrochemical heavy lifts
Rough-Terrain CranesMining and industrial maintenance
Trailer-Mounted CranesUtility and shutdown work

Truck-Mounted Cranes lead on volume because buyers in emerging economies value low purchase prices and established service networks. All-Terrain Cranes grow fastest as rental firms in Europe and North America swap several older units for one emission-compliant machine that travels on highways and works off-road. Crawler Cranes and Rough-Terrain Cranes remain project- and commodity-driven rather than broad-based.

By Application

Sub-SegmentKey Trend
ConstructionPublic works offset weaker private housing
Mining & ExcavationReplacement tied to commodity prices
Marine & OffshoreOffshore wind feeder and port lifts
UtilitiesGrid reinforcement budgets
Shipping & PortGulf logistics hub expansion
OthersData center and semiconductor modules

Construction holds the largest share because bridges, transit and public buildings need daily lift capacity regardless of housing cycles. Marine & Offshore grows fastest as offshore wind rounds create sustained demand for heavy feeder lifts at marshaling ports. Utilities and Shipping & Port add steady, budget-backed volume that cushions cyclical Mining & Excavation demand.

By End User

Sub-SegmentKey Trend
Rental CompaniesDefault channel for contractors with volatile schedules
ContractorsOwned core fleets for recurring work
Government & Municipal AgenciesDirect purchases under stimulus frameworks
Industrial Owners & OperatorsMaintenance fleets for refineries and power plants

Rental Companies lead because contractors prefer to offload ownership, certification and residual-value risk. Government & Municipal Agencies grow fastest as multi-year infrastructure programs and domestic-content clauses encourage direct fleet acquisition. Contractors and Industrial Owners & Operators keep owned units for predictable, recurring lifts.

By Lifting Capacity

Sub-SegmentKey Trend
Below 50 TonsElectric and hybrid units for city cores
50-150 TonsVersatile highway-legal workhorse class
151-300 TonsBridge girders and wind nacelles
Above 300 TonsNuclear, offshore wind and data center modules

The 50-150 Tons class leads because one unit covers most building, bridge and plant work. Above 300 Tons grows fastest as modular construction in nuclear, offshore wind and hyperscale data centers raises single-lift weights. Below 50 Tons units gain from low-emission zone rules that favour compact electric and hybrid drives.


Download PDF ×

We do not share your information with anyone. However, we may send you emails based on your report interest from time to time. You may contact us at any time to opt-out.