Segmentation Quick Reference
| Dimension | Sub-Segments | Dominant Segment | Fastest Growing Segment |
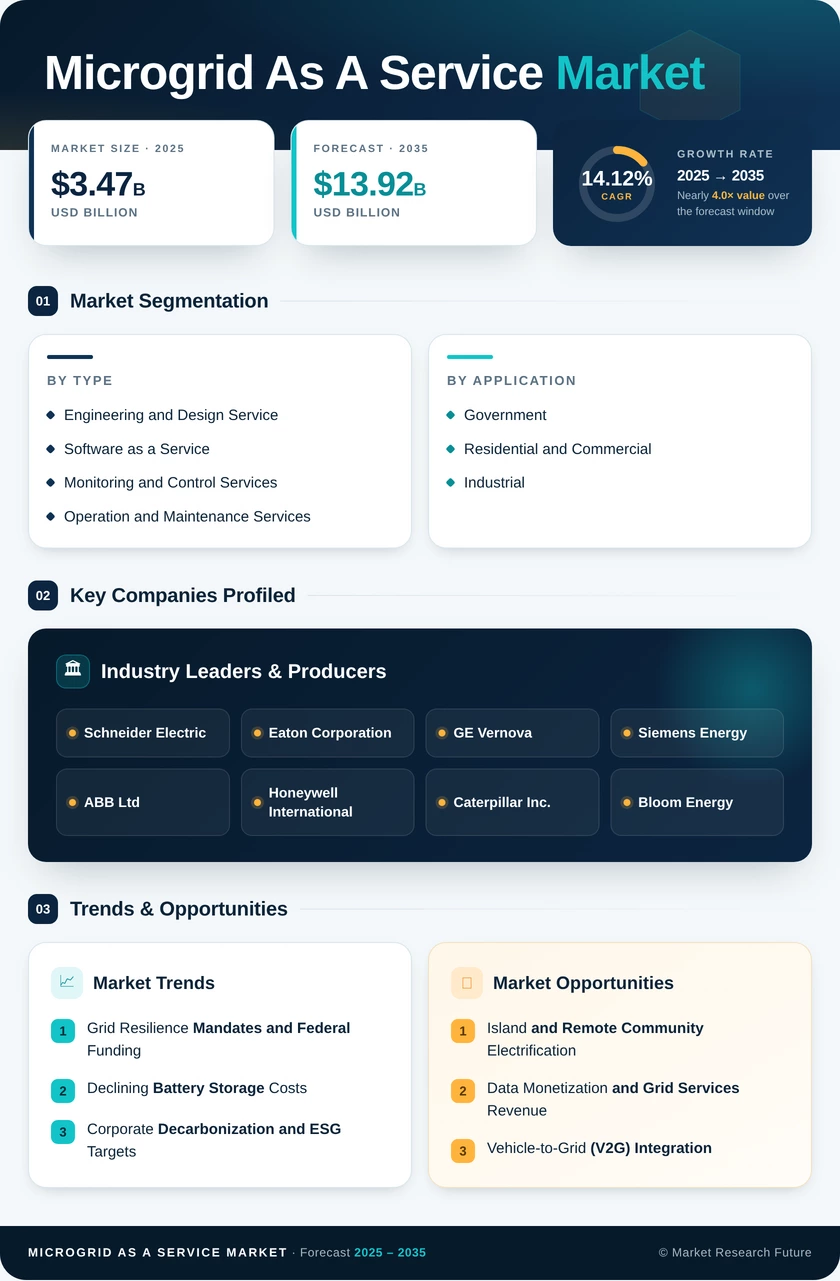
| By Service Type | Engineering and Design Service, Software as a Service, Monitoring and Control Services, Operation and Maintenance Services | Software as a Service | Monitoring and Control Services |
| By End-User Vertical | Government, Residential and Commercial, Industrial | Industrial | Government |
| By Geography | North America, Europe, Asia-Pacific, South America, Middle East & Africa | Asia-Pacific | Asia-Pacific |
Market Segmentation Overview
By Service Type
| Sub-Segment | Key Trend |
| Engineering and Design Service | Growing demand for turnkey greenfield microgrid project development |
| Software as a Service | Cloud-native energy-as-a-service platforms are driving rapid enterprise onboarding |
| Monitoring and Control Services | AI-powered microgrid control systems enabling real-time hybrid asset optimization |
| Operation and Maintenance Services | Long-term recurring contracts with guaranteed uptime SLAs |
The service type segmentation reflects the full lifecycle of microgrid deployment. Software as a Service has emerged as the leading adoption vector because cloud-based distributed energy management eliminates upfront IT investment, while Monitoring and Control Services are accelerating fastest as operators demand granular visibility into renewable microgrid technology performance.
By End-User Vertical
| Sub-Segment | Key Trend |
| Government | Federal resilience mandates and defense-sector procurement are driving large-scale deployments |
| Residential and Commercial | Multi-tenant buildings and campus environments adopting smart grid solutions |
| Industrial | Manufacturing continuity requirements and mining electrification are fueling a dominant share |
Industrial end users dominate because power-disruption penalties are steepest in manufacturing and extraction environments. The Government vertical is growing fastest, propelled by defense energy-independence mandates and municipal resilience programs that prioritize microgrid control systems for critical infrastructure.