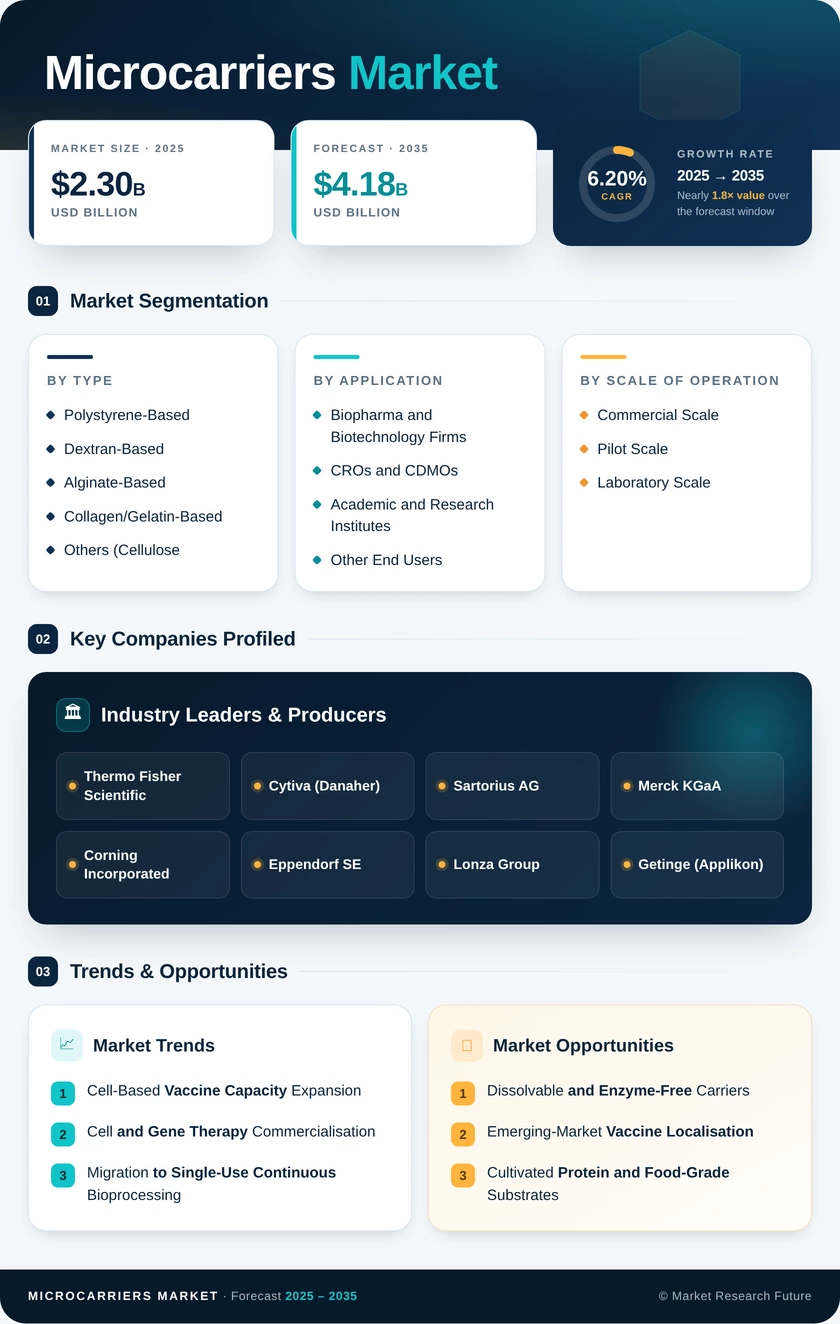
Microcarriers Market (2026 - 2035)

Microcarriers Market Research Report Information By Product Type (Equipment {Bioreactors, Culture Vessels, Cell Counters, Filtration Systems, and Other Equipment}, Consumables {Media [Serum-Based Media, Serum-Free Media, and Other Media], Reagents, Microcarrier Beads {Cationic Microcarriers, Collagen-coated Microcarriers, Protein-coated Microcarriers, and Other Microcarrier Beads}), By Application (Vaccine Manufacturing, Cell Therapy, Biologics Manufacturing, and Other Applications), By End User (Pharmaceutical & Biotechnology Companies, Research Institutes, and Contract Research Organizations), and Region (North America, Europe, Asia-Pacific, and the Rest of the World)—Forecast till 2035

Forecast Period
2026-2035
CAGR
6.20%
2025 Market Size
USD 2.30 Billion
2035 Market Size
USD 4.18 Billion
Life Sciences ● Updated August 2026 Report ID: MRFR/LS/5446-HCR | Pages: 90 | Author: Vikita Thakur, Kinjoll Dey
  1. 1 Market Summary |
    1. 1.1 Study Assumptions & Market Definition |
    2. 1.2 Scope of the Study |
    3. 1.3 Research Methodology
  2. 2 Key Report Takeaways |
    1. 2.1 By Technology (Material Type) |
    2. 2.2 By Sector (Application & End User) |
    3. 2.3 By Geography
  3. 3 Market Size and Forecast (2021–2035) |
    1. 3.1 Historical Market Size (2021–2024) |
    2. 3.2 Base Year Estimate (2025) |
    3. 3.3 Forecast Market Size (2026–2035) |
    4. 3.4 Year-over-Year Growth Analysis
  4. 4 Driver Impact Analysis |
    1. 4.1 Cell-Based Vaccine Capacity Expansion |
    2. 4.2 Cell and Gene Therapy Commercialisation |
    3. 4.3 Migration to Single-Use Continuous Bioprocessing |
    4. 4.4 CDMO Capacity Buildout in Asia-Pacific
  5. 5 Restraints Impact Analysis |
    1. 5.1 Biologics Price Compression |
    2. 5.2 Harvest Yield and Detachment Losses |
    3. 5.3 Scale-Up Hydrodynamic Complexity
  6. 6 Opportunities |
    1. 6.1 Dissolvable and Enzyme-Free Carriers |
    2. 6.2 Emerging-Market Vaccine Localisation |
    3. 6.3 Cultivated Protein and Food-Grade Substrates |
    4. 6.4 Carrier-as-a-Service and Process Data Monetisation |
    5. 6.5 Xeno-Free and Recombinant Coating Chemistries
  7. 7 Regional Market Share and Country-Level Analysis |
    1. 7.1 North America | |
      1. 7.1.1 US | |
      2. 7.1.2 Canada | |
      3. 7.1.3 Mexico |
    2. 7.2 Europe | |
      1. 7.2.1 Germany | |
      2. 7.2.2 UK | |
      3. 7.2.3 France | |
      4. 7.2.4 Italy | |
      5. 7.2.5 Spain | |
      6. 7.2.6 Nordic Countries | |
      7. 7.2.7 Russia | |
      8. 7.2.8 Rest of Europe |
    3. 7.3 Asia-Pacific | |
      1. 7.3.1 China | |
      2. 7.3.2 India | |
      3. 7.3.3 Japan | |
      4. 7.3.4 South Korea | |
      5. 7.3.5 ASEAN | |
      6. 7.3.6 Rest of Asia-Pacific |
    4. 7.4 South America | |
      1. 7.4.1 Brazil | |
      2. 7.4.2 Argentina | |
      3. 7.4.3 Rest of South America |
    5. 7.5 Middle East & Africa | |
      1. 7.5.1 Saudi Arabia | |
      2. 7.5.2 UAE | |
      3. 7.5.3 South Africa | |
      4. 7.5.4 Egypt | |
      5. 7.5.5 Rest of Middle East & Africa
  8. 8 Future Outlook (2026–2035) |
    1. 8.1 Autonomous Bioprocessing and Digital Twins |
    2. 8.2 Platform Economics and Supplier Consolidation |
    3. 8.3 The Cultivated Protein Volume Shock |
    4. 8.4 Sustainability Reporting and Single-Use Waste
  9. 9 Market Segmentation Analysis |
    1. 9.1 By Material Type | |
      1. 9.1.1 Polystyrene-Based | |
      2. 9.1.2 Dextran-Based | |
      3. 9.1.3 Alginate-Based | |
      4. 9.1.4 Collagen/Gelatin-Based | |
      5. 9.1.5 Others (Cellulose, PLGA, Glass) |
    2. 9.2 By Application | |
      1. 9.2.1 Vaccine Manufacturing | |
      2. 9.2.2 Cell Therapy | |
      3. 9.2.3 Regenerative Medicine | |
      4. 9.2.4 Recombinant Proteins | |
      5. 9.2.5 Other Applications |
    3. 9.3 By End User | |
      1. 9.3.1 Biopharma and Biotechnology Firms | |
      2. 9.3.2 CROs and CDMOs | |
      3. 9.3.3 Academic and Research Institutes | |
      4. 9.3.4 Other End Users |
    4. 9.4 By Scale of Operation | |
      1. 9.4.1 Laboratory Scale | |
      2. 9.4.2 Pilot Scale | |
      3. 9.4.3 Commercial Scale
  10. 10 Competitive Landscape |
    1. 10.1 Market Concentration Analysis |
    2. 10.2 Competitive Benchmarking Matrix |
    3. 10.3 Company Profiles | |
      1. 10.3.1 Thermo Fisher Scientific | |
      2. 10.3.2 Cytiva (Danaher) | |
      3. 10.3.3 Sartorius AG | |
      4. 10.3.4 Merck KGaA | |
      5. 10.3.5 Corning Incorporated | |
      6. 10.3.6 Eppendorf SE | |
      7. 10.3.7 Lonza Group | |
      8. 10.3.8 Getinge (Applikon) | |
      9. 10.3.9 Repligen Corporation | |
      10. 10.3.10 HiMedia Laboratories
  11. 11 Recent News & Developments
  12. 12 Report Scope and Methodology |
    1. 12.1 Study Period & Base Year |
    2. 12.2 Valuation Currency & Assumptions |
    3. 12.3 Abbreviations
  13. 13 Detailed Sources and Citations
  14. 14 Frequently Asked Questions
  15. 15 LIST OF TABLES |
  16. TABLE 1 Global Microcarriers Market Size & Forecast, by Revenue (USD Billion), 2021–2035 |
  17. TABLE 2 Global Microcarriers Market – Year-over-Year Growth Analysis, 2021–2035 |
  18. TABLE 3 Driver Impact Analysis Matrix, 2026–2035 |
  19. TABLE 4 Restraint Impact Analysis Matrix, 2026–2035 |
  20. TABLE 5 Global Microcarriers Market Size, by Region, 2021–2035 (USD Billion) |
  21. TABLE 6 North America Microcarriers Market Size, by Country, 2021–2035 (USD Billion) |
  22. TABLE 7 Europe Microcarriers Market Size, by Country, 2021–2035 (USD Billion) |
  23. TABLE 8 Asia-Pacific Microcarriers Market Size, by Country, 2021–2035 (USD Billion) |
  24. TABLE 9 South America Microcarriers Market Size, by Country, 2021–2035 (USD Billion) |
  25. TABLE 10 Middle East & Africa Microcarriers Market Size, by Country, 2021–2035 (USD Billion) |
  26. TABLE 11 Global Microcarriers Market Size, by Material Type, 2021–2035 (USD Billion) |
  27. TABLE 12 Global Microcarriers Market Size, by Application, 2021–2035 (USD Billion) |
  28. TABLE 13 Global Microcarriers Market Size, by End User, 2021–2035 (USD Billion) |
  29. TABLE 14 Global Microcarriers Market Size, by Scale of Operation, 2021–2035 (USD Billion) |
  30. TABLE 15 North America Microcarriers Market Size, by Material Type, 2021–2035 (USD Billion) |
  31. TABLE 16 North America Microcarriers Market Size, by Application, 2021–2035 (USD Billion) |
  32. TABLE 17 Europe Microcarriers Market Size, by Material Type, 2021–2035 (USD Billion) |
  33. TABLE 18 Europe Microcarriers Market Size, by Application, 2021–2035 (USD Billion) |
  34. TABLE 19 Asia-Pacific Microcarriers Market Size, by Material Type, 2021–2035 (USD Billion) |
  35. TABLE 20 Asia-Pacific Microcarriers Market Size, by Application, 2021–2035 (USD Billion) |
  36. TABLE 21 South America Microcarriers Market Size, by End User, 2021–2035 (USD Billion) |
  37. TABLE 22 Middle East & Africa Microcarriers Market Size, by End User, 2021–2035 (USD Billion) |
  38. TABLE 23 Competitive Benchmarking Matrix – Global Microcarriers Market, 2026 |
  39. TABLE 24 Company Profiles – Key Players, Global Microcarriers Market |
  40. TABLE 25 Recent Developments & Strategic Announcements, 2023–2025 |
  41. TABLE 26 Report Scope & Methodology Summary |
  42. TABLE 27 Detailed Sources and Citations Index
  43. 16 LIST OF FIGURES |
  44. FIGURE 1 Global Microcarriers Market Dynamics – Drivers, Restraints and Opportunities |
  45. FIGURE 2 Industry Value Chain Analysis – Resin Supply to End-User Qualification |
  46. FIGURE 3 Porter's Five Forces Analysis – Global Microcarriers Market |
  47. FIGURE 4 Global Market Size Trend Line, 2021–2035 (USD Billion) |
  48. FIGURE 5 Year-over-Year Growth Curve, 2022–2035 (%) |
  49. FIGURE 6 Market Share by Material Type, 2025 vs 2035 (%) |
  50. FIGURE 7 Market Share by Application, 2025 vs 2035 (%) |
  51. FIGURE 8 Market Share by End User, 2025 (%) |
  52. FIGURE 9 Market Share by Scale of Operation, 2025 (%) |
  53. FIGURE 10 Regional Market Share Distribution, 2025 (%) |
  54. FIGURE 11 Regional CAGR Comparison, 2026–2035 (%) |
  55. FIGURE 12 North America Country-Level Share Breakdown, 2025 (%) |
  56. FIGURE 13 Europe Country-Level Share Breakdown, 2025 (%) |
  57. FIGURE 14 Asia-Pacific Country-Level CAGR Comparison, 2026–2035 (%) |
  58. FIGURE 15 Competitive Landscape – Estimated Revenue Share Bands, 2026 |
  59. FIGURE 16 Strategic Positioning Map – Scale vs Specialisation |
  60. FIGURE 17 Technology Adoption Curve – Conventional to Dissolvable Carriers
Share::
Request Free Sample

Segmentation Quick Reference

DimensionSub-SegmentsDominant SegmentFastest Growing Segment
Material TypePolystyrene-Based, Dextran-Based, Alginate-Based, Collagen/Gelatin-Based, OthersPolystyrene-BasedAlginate-Based
ApplicationVaccine Manufacturing, Cell Therapy, Regenerative Medicine, Recombinant Proteins, Other ApplicationsVaccine ManufacturingCell Therapy
End UserBiopharma and Biotechnology Firms, CROs and CDMOs, Academic and Research Institutes, Other End UsersBiopharma and Biotechnology FirmsCROs and CDMOs
Scale of OperationLaboratory Scale, Pilot Scale, Commercial ScaleCommercial ScalePilot Scale
GeographyNorth America, Europe, Asia-Pacific, South America, Middle East & AfricaNorth AmericaAsia-Pacific


Market Segmentation Overview

By Material Type

Sub-SegmentKey Trend
Polystyrene-BasedSurface treatments diversifying toward recombinant coatings for xeno-free compliance
Dextran-BasedStable legacy demand protected by decades of licensed-process precedent
Alginate-BasedDissolvable formats gaining traction in cell therapy and food-grade applications
Collagen/Gelatin-BasedMigration from porcine-derived toward recombinant gelatin sources
Others (Cellulose, PLGA, Glass)Niche adoption in research, implantable scaffolds and specialty screening


Material selection is the stickiest decision in the entire workflow. Once a chemistry is written into a licensed process, comparability requirements make substitution expensive enough that most sponsors simply live with the incumbent. That inertia protects polystyrene and dextran incumbents, while newer chemistries win primarily at greenfield sites and in programmes still in early development.

By Application

Sub-SegmentKey Trend
Vaccine ManufacturingRegional localisation programmes creating new demand centres outside traditional hubs
Cell TherapyAllogeneic MSC and iPSC platforms driving demand for closed, scalable expansion
Regenerative MedicineTissue-engineering constructs adopting biodegradable carrier scaffolds
Recombinant ProteinsSelective use of adherent expression where suspension adaptation is impractical
Other ApplicationsGrowth in toxicology screening and 3D organoid model production


Applications split along a clear economic line. Vaccine programmes buy on cost per kilogram and supply security; therapy programmes buy on documentation quality and lot consistency. Suppliers that try to serve both with a single portfolio and pricing structure tend to underperform against specialists on one side or the other.

By End User

Sub-SegmentKey Trend
Biopharma and Biotechnology FirmsIn-house commercial capacity retained for platform products
CROs and CDMOsStandardising on fewer chemistries across many client programmes
Academic and Research InstitutesGrant-funded purchasing concentrated in small-pack laboratory formats
Other End UsersCultivated-protein and industrial biotech entrants emerging as a distinct cohort


Contract manufacturers are quietly becoming the most influential buyers. Because a single CDMO site may run a dozen client programmes on two or three standardised carrier chemistries, its qualification decision effectively locks in downstream sponsors. Suppliers increasingly sell to the CDMO first and the sponsor second.

By Scale of Operation

Sub-SegmentKey Trend
Laboratory ScaleSmall-format, ready-to-use packs replacing bulk powder for convenience
Pilot ScaleFastest expansion as clinical pipelines mature toward late-phase manufacturing
Commercial ScaleVolume concentration in vaccine and allogeneic therapy production


Scale determines purchasing behaviour more than most vendors acknowledge. Laboratory buyers optimise for convenience and catalogue availability; commercial buyers negotiate multi-year supply agreements with penalty clauses. Pilot scale sits awkwardly between the two, and it is precisely where suppliers win or lose the commercial relationship that follows.




Share::
Request Free Sample
Download PDF ×

We do not share your information with anyone. However, we may send you emails based on your report interest from time to time. You may contact us at any time to opt-out.