Microbial Products Market Segmentation
Microbial Products Market Type Outlook (USD Billion, 2018-2032)
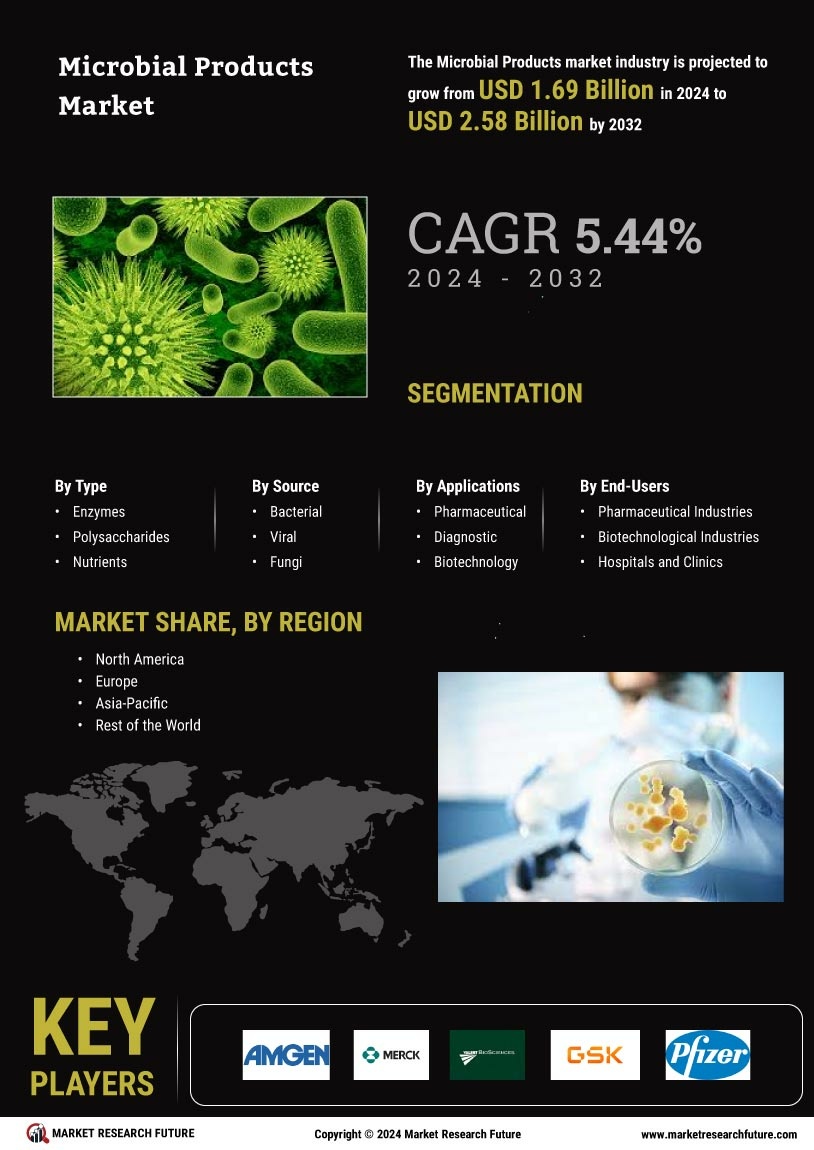
- Enzymes
- Polysaccharides
- Nutrients
- Chemotherapeutic Agents
- Antibiotics
- Vaccines
Microbial Products Market Source Outlook (USD Billion, 2018-2032)
- Bacterial
- Viral
- Fungi
Microbial Products Market Application Outlook (USD Billion, 2018-2032)
- Microbial Products Market
- Diagnostic
- Biotechnology
Microbial Products Market End-Users Outlook (USD Billion, 2018-2032)
- Microbial Products Market Industries
- Biotechnological Industries
- Hospitals and Clinics
- Diagnostic Labs
- Research
- Academics
Microbial Products Market Regional Outlook (USD Billion, 2018-2032)
North America Outlook (USD Billion, 2018-2032)
- Microbial Products Market by Type
- Enzymes
- Polysaccharides
- Nutrients
- Chemotherapeutic Agents
- Antibiotics
- Vaccines
- Microbial Products Market by Source
- Bacterial
- Viral
- Fungi
- Microbial Products Market by Application
- Microbial Products Market
- Diagnostic
- Biotechnology
- Microbial Products Market by End-Users
- Microbial Products Market Industries
- Biotechnological Industries
- Hospitals and Clinics
- Diagnostic Labs
- Research
- Academics
US Outlook (USD Billion, 2018-2032)
- Microbial Products Market by Type
- Enzymes
- Polysaccharides
- Nutrients
- Chemotherapeutic Agents
- Antibiotics
- Vaccines
- Microbial Products Market by Source
- Bacterial
- Viral
- Fungi
- Microbial Products Market by Application
- Microbial Products Market
- Diagnostic
- Biotechnology
- Microbial Products Market by End-Users
- Microbial Products Market Industries
- Biotechnological Industries
- Hospitals and Clinics
- Diagnostic Labs
- Research
- Academics
CANADA Outlook (USD Billion, 2018-2032)
- Microbial Products Market by Type
- Enzymes
- Polysaccharides
- Nutrients
- Chemotherapeutic Agents
- Antibiotics
- Vaccines
- Microbial Products Market by Source
- Bacterial
- Viral
- Fungi
- Microbial Products Market by Application
- Microbial Products Market
- Diagnostic
- Biotechnology
- Microbial Products Market by End-Users
- Microbial Products Market Industries
- Biotechnological Industries
- Hospitals and Clinics
- Diagnostic Labs
- Research
- Academics
Europe Outlook (USD Billion, 2018-2032)
- Microbial Products Market by Type
- Enzymes
- Polysaccharides
- Nutrients
- Chemotherapeutic Agents
- Antibiotics
- Vaccines
- Microbial Products Market by Source
- Bacterial
- Viral
- Fungi
- Microbial Products Market by Application
- Microbial Products Market
- Diagnostic
- Biotechnology
- Microbial Products Market by End-Users
- Microbial Products Market Industries
- Biotechnological Industries
- Hospitals and Clinics
- Diagnostic Labs
- Research
- Academics
GermanyOutlook (USD Billion, 2018-2032)
- Microbial Products Market by Type
- Enzymes
- Polysaccharides
- Nutrients
- Chemotherapeutic Agents
- Antibiotics
- Vaccines
- Microbial Products Market by Source
- Bacterial
- Viral
- Fungi
- Germany Microbial Products Market by Application
- Microbial Products Market
- Diagnostic
- Biotechnology
- Germany Microbial Products Market by End-Users
- Microbial Products Market Industries
- Biotechnological Industries
- Hospitals and Clinics
- Diagnostic Labs
- Research
- Academics
France Outlook (USD Billion, 2018-2032)
- Microbial Products Market by Type
- Enzymes
- Polysaccharides
- Nutrients
- Chemotherapeutic Agents
- Antibiotics
- Vaccines
- Microbial Products Market by Source
- Bacterial
- Viral
- Fungi
- France Microbial Products Market by Application
- Microbial Products Market
- Diagnostic
- Biotechnology
- France Microbial Products Market by End-Users
- Microbial Products Market Industries
- Biotechnological Industries
- Hospitals and Clinics
- Diagnostic Labs
- Research
- Academics
UK Outlook (USD Billion, 2018-2032)
- Microbial Products Market by Type
- Enzymes
- Polysaccharides
- Nutrients
- Chemotherapeutic Agents
- Antibiotics
- Vaccines
- Microbial Products Market by Source
- Bacterial
- Viral
- Fungi
- UK Microbial Products Market by Application
- Microbial Products Market
- Diagnostic
- Biotechnology
- UK Microbial Products Market by End-Users
- Microbial Products Market Industries
- Biotechnological Industries
- Hospitals and Clinics
- Diagnostic Labs
- Research
- Academics
ITALY Outlook (USD Billion, 2018-2032)
- Microbial Products Market by Type
- Enzymes
- Polysaccharides
- Nutrients
- Chemotherapeutic Agents
- Antibiotics
- Vaccines
- Microbial Products Market by Source
- Bacterial
- Viral
- Fungi
- ITALY Microbial Products Market by Application
- Microbial Products Market
- Diagnostic
- Biotechnology
- ITALY Microbial Products Market by End-Users
- Microbial Products Market Industries
- Biotechnological Industries
- Hospitals and Clinics
- Diagnostic Labs
- Research
- Academics
SPAIN Outlook (USD Billion, 2018-2032)
- Microbial Products Market by Type
- Enzymes
- Polysaccharides
- Nutrients
- Chemotherapeutic Agents
- Antibiotics
- Vaccines
- Microbial Products Market by Source
- Bacterial
- Viral
- Fungi
- Spain Microbial Products Market by Application
- Microbial Products Market
- Diagnostic
- Biotechnology
- Spain Microbial Products Market by End-Users
- Microbial Products Market Industries
- Biotechnological Industries
- Hospitals and Clinics
- Diagnostic Labs
- Research
- Academics
Rest Of Europe Outlook (USD Billion, 2018-2032)
- Microbial Products Market by Type
- Enzymes
- Polysaccharides
- Nutrients
- Chemotherapeutic Agents
- Antibiotics
- Vaccines
- Microbial Products Market by Source
- Bacterial
- Viral
- Fungi
- REST OF EUROPE Microbial Products Market by Application
- Microbial Products Market
- Diagnostic
- Biotechnology
- REST OF EUROPE Microbial Products Market by End-Users
- Microbial Products Market Industries
- Biotechnological Industries
- Hospitals and Clinics
- Diagnostic Labs
- Research
- Academics
Asia-Pacific Outlook (USD Billion, 2018-2032)
- Microbial Products Market by Type
- Enzymes
- Polysaccharides
- Nutrients
- Chemotherapeutic Agents
- Antibiotics
- Vaccines
- Microbial Products Market by Source
- Bacterial
- Viral
- Fungi
- Asia-Pacific Microbial Products Market by Application
- Microbial Products Market by Type
- Microbial Products Market
- Diagnostic
- Biotechnology
- Asia-Pacific Microbial Products Market by End-Users
- Microbial Products Market Industries
- Biotechnological Industries
- Hospitals and Clinics
- Diagnostic Labs
- Research
- Academics
China Outlook (USD Billion, 2018-2032)
- Microbial Products Market by Type
- Enzymes
- Polysaccharides
- Nutrients
- Chemotherapeutic Agents
- Antibiotics
- Vaccines
- Microbial Products Market by Source
- Bacterial
- Viral
- Fungi
- China Microbial Products Market by Application
- Microbial Products Market
- Diagnostic
- Biotechnology
- Microbial Products Market by End-Users
- Microbial Products Market Industries
- Biotechnological Industries
- Hospitals and Clinics
- Diagnostic Labs
- Research
- Academics
Japan Outlook (USD Billion, 2018-2032)
- Microbial Products Market by Type
- Enzymes
- Polysaccharides
- Nutrients
- Chemotherapeutic Agents
- Antibiotics
- Vaccines
- Microbial Products Market by Source
- Bacterial
- Viral
- Fungi
- Japan Microbial Products Market by Application
- Microbial Products Market
- Diagnostic
- Biotechnology
- Japan Microbial Products Market by End-Users
- Microbial Products Market Industries
- Biotechnological Industries
- Hospitals and Clinics
- Diagnostic Labs
- Research
- Academics
India Outlook (USD Billion, 2018-2032)
- Microbial Products Market by Type
- Enzymes
- Polysaccharides
- Nutrients
- Chemotherapeutic Agents
- Antibiotics
- Vaccines
- Microbial Products Market by Source
- Bacterial
- Viral
- Fungi
- India Microbial Products Market by Application
- Microbial Products Market
- Diagnostic
- Biotechnology
- India Microbial Products Market by End-Users
- Microbial Products Market Industries
- Biotechnological Industries
- Hospitals and Clinics
- Diagnostic Labs
- Research
- Academics
Australia Outlook (USD Billion, 2018-2032)
- Microbial Products Market by Type
- Enzymes
- Polysaccharides
- Nutrients
- Chemotherapeutic Agents
- Antibiotics
- Vaccines
- Microbial Products Market by Source
- Bacterial
- Viral
- Fungi
- Australia Microbial Products Market by Application
- Microbial Products Market
- Diagnostic
- Biotechnology
- Australia Microbial Products Market by End-Users
- Microbial Products Market Industries
- Biotechnological Industries
- Hospitals and Clinics
- Diagnostic Labs
- Research
- Academics
Rest of Asia-Pacific Outlook (USD Billion, 2018-2032)
- Microbial Products Market by Type
- Enzymes
- Polysaccharides
- Nutrients
- Chemotherapeutic Agents
- Antibiotics
- Vaccines
- Microbial Products Market by Source
- Bacterial
- Viral
- Fungi
- Rest of Asia-Pacific Microbial Products Market by Application
- Microbial Products Market
- Diagnostic
- Biotechnology
- Rest of Asia-Pacific Microbial Products Market by End-Users
- Microbial Products Market Industries
- Biotechnological Industries
- Hospitals and Clinics
- Diagnostic Labs
- Research
- Academics
Rest of the World Outlook (USD Billion, 2018-2032)
- Microbial Products Market by Type
- Enzymes
- Polysaccharides
- Nutrients
- Chemotherapeutic Agents
- Antibiotics
- Vaccines
- Microbial Products Market by Source
- Bacterial
- Viral
- Fungi
- Rest of the World Microbial Products Market by Application
- Microbial Products Market by Type
- Microbial Products Market
- Diagnostic
- Biotechnology
- Rest of the World Microbial Products Market by End-Users
- Microbial Products Market Industries
- Biotechnological Industries
- Hospitals and Clinics
- Diagnostic Labs
- Research
- Academics
Middle East Outlook (USD Billion, 2018-2032)
- Microbial Products Market by Type
- Enzymes
- Polysaccharides
- Nutrients
- Chemotherapeutic Agents
- Antibiotics
- Vaccines
- Microbial Products Market by Source
- Bacterial
- Viral
- Fungi
- Microbial Products Market by Application
- Microbial Products Market
- Diagnostic
- Biotechnology
- Microbial Products Market by End-Users
- Microbial Products Market Industries
- Biotechnological Industries
- Hospitals and Clinics
- Diagnostic Labs
- Research
- Academics
Africa Outlook (USD Billion, 2018-2032)
- Microbial Products Market by Type
- Enzymes
- Polysaccharides
- Nutrients
- Chemotherapeutic Agents
- Antibiotics
- Vaccines
- Microbial Products Market by Source
- Bacterial
- Viral
- Fungi
- Microbial Products Market by Application
- Microbial Products Market
- Diagnostic
- Biotechnology
- Microbial Products Market by End-Users
- Microbial Products Market Industries
- Biotechnological Industries
- Hospitals and Clinics
- Diagnostic Labs
- Research
- Academics
Latin America Outlook (USD Billion, 2018-2032)
- Microbial Products Market by Type
- Enzymes
- Polysaccharides
- Nutrients
- Chemotherapeutic Agents
- Antibiotics
- Vaccines
- Microbial Products Market by Source
- Bacterial
- Viral
- Fungi
- Latin America Microbial Products Market by Application
- Microbial Products Market
- Diagnostic
- Biotechnology
- Latin America Microbial Products Market by End-Users
- Microbial Products Market Industries
- Biotechnological Industries
- Hospitals and Clinics
- Diagnostic Labs
- Research
- Academics