ID: MRFR/LS/4149-HCR | February 2021 | Region: Global | 90 pages
Market Scenario:
Metagenomics sequencing is also known as environmental or community genomics. It is termed as the genomic study wherein the DNA of the specified host microorganism is extracted and cloned directly from the microorganism. Genetic testing is an expensive affair. Moreover, the testing requires specific infrastructure and resources. Currently, the genetic testing market is majorly spread in North American and West European region. There are huge opportunities for the service providers and companies to make the tests affordable and enter the untapped regions of the world with a great scope of expanding. The reducing costs of the tests may also encourage people to undergo the genetic tests.
The rising awareness of genetic disorders drives the global metagenomic sequencing market among the population. The advanced technological platforms and improved genomic tools are the key factors driving the growth of the global metagenomic sequencing market during the forecast period.
Furthermore, the factors such as the use of advanced bioinformatics tools, recovery of novel drugs, high throughput screening (HTS) methods, and the development of cost-effective technologies such as next-generation sequencing (NGS) are driving the market growth. Moreover, rising R&D activities to identify new antibiotics and enzymes, and improved bioinformatics offers some attractive opportunities to the key market players. Growing concerns regarding the standardization and accuracy of diagnostic testing, lack of skilled professionals, and lack of knowledge is likely to restrain the market growth over the forecast period.
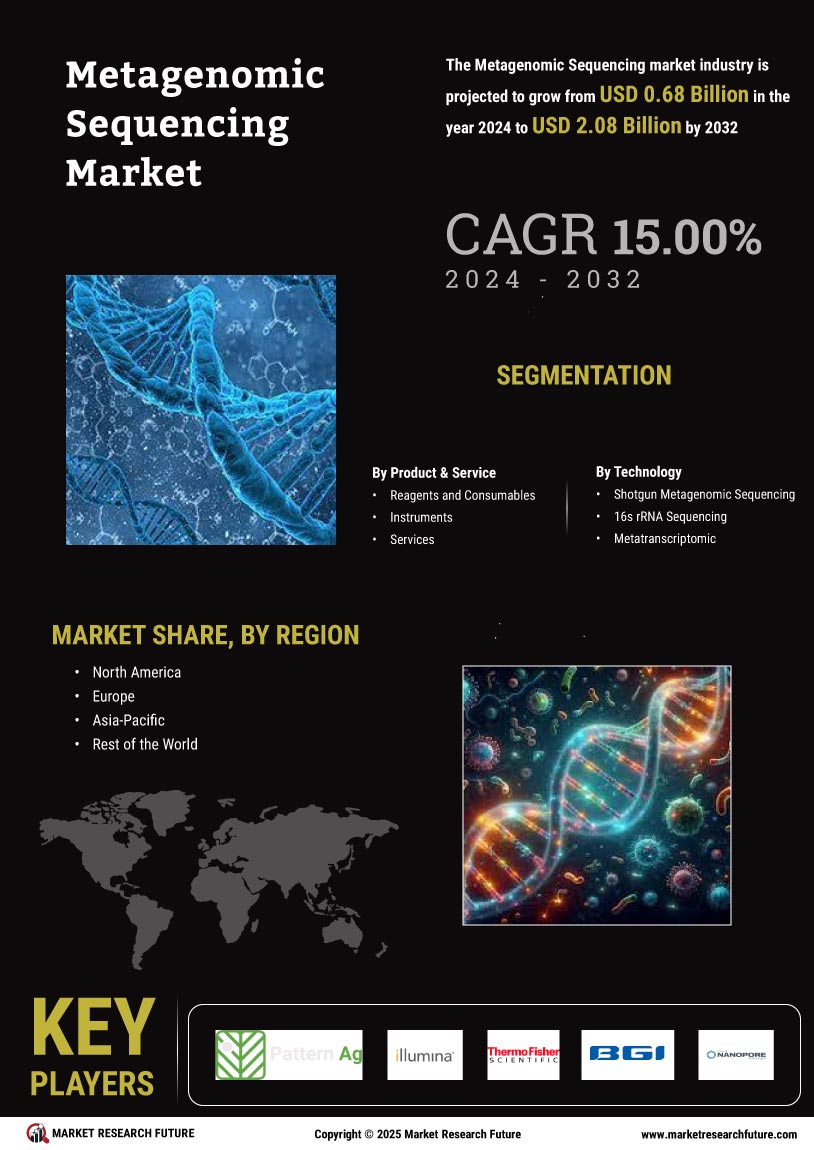
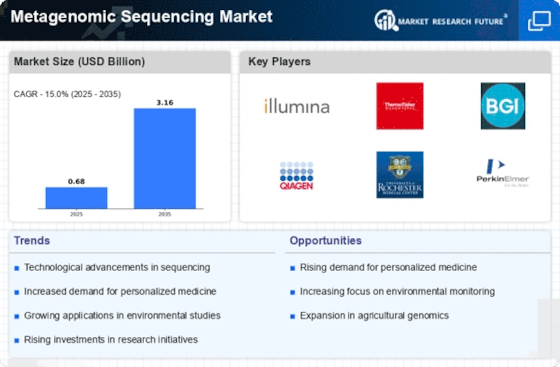
The global metagenomic sequencing market is expected to grow at a CAGR of approximately 6.5% during the forecast period 2017-2023.
Research Methodology
Sources: Annual reports, Press release, White paper, and Company presentation
Intended Audience
Segmentation
The global metagenomic sequencing market is segmented on the basis of technology, application, and end user.
On the basis of the technology, the global metagenomic sequencing market is segmented into sequencing, bioinformatics, and others
On the basis of the application, the global metagenomic sequencing market is segmented into infectious disease diagnosis, environmental remediation, gut microbe characterization, biotechnology, biofuel, ecology, agriculture, and others
On the basis of the end user, the global metagenomic sequencing market is segmented into hospitals, research institutes, specialized clinics, and others.
Regional Analysis
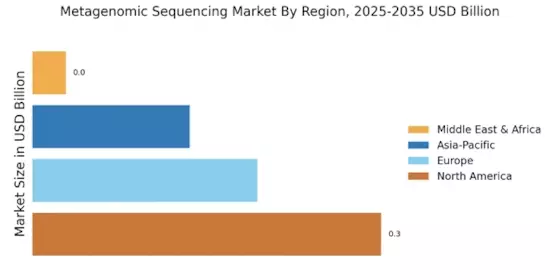
The global metagenomic sequencing market is segmented into the Americas, Europe, Asia Pacific, and the Middle East and Africa.
The Americas region dominates the global metagenomic sequencing market owing to the technological advancements in the next generation sequencing procedures along with its increasing applications. The companies are focused on introducing the procedures with innovative technology. The unique opportunity drives the metagenomic sequencing market, and the focused issues stress on the need for more research on metagenomic sequencing tests.
The European market holds the second largest share of the global metagenomic sequencing market owing to the increasing investment by the hospital facilities and government for better healthcare, growing collaborations and partnerships, the low cost of sequencing, and rising adoption of NGS procedure by research laboratories are driving the growth of this market.
The Asia Pacific market is expected to witness the fastest growth due to increasing prevalence of genetic disorders throughout the globe, which will boost the growth of the metagenomic sequencing market. Affordable healthcare and research are also major factor for the growth of the Asia Pacific metagenomic sequencing market. Major players are focusing on this region and investing money to expand their network that is helping them to capture major piece of the market. The Asia Pacific is anticipated to be the fastest growing region and is anticipated to compete with the European market over the forecasted period.
The Middle East and Africa are also expected to show a healthy growth in the coming five years. There are some factors affecting the growth of the Middle East metagenomic sequencing, such as lack of knowledge of genetic diseases and disorders, weak healthcare and research infrastructure, traditional healthcare practices, limited availability of products and services, and cost of the tests etc.
Key Players
Some of key the players in the global metagenomic sequencing market are GATC Biotech AG (Germany), Enterome Bioscience (France), Illumina Inc. (U.S.), Aperiomics, Inc. (U.S.), The Mitre Corporation (U.S.), F Hoffman-La Roche Ltd. (Switzerland), SciGenom Labs Pvt. Ltd. (India), Second Genome Therapeutics (U.S.), Quest Diagnostics Incorporated (U.S.), Freenome Inc. (U.S.), GenapSys, Inc. (U.S.), COSMOSID (U.S.), Pacific Biosciences (U.S.), Beijing Genomics Institute (China), Biomatters Ltd. (New Zealand), Thermo Fisher Scientific Inc. (U.S.), Oxford Nanopore Technologies Inc. (UK), CLC Bio (Qiagen) (Denmark), Agilent Technologies Inc. (U.S.), DNAStar Inc. (U.S.), Macrogen Inc. (South Korea), Helicos BioSciences (U.S.), Knome Inc. (U.S.), and others.
Frequently Asked Questions (FAQ) :
Metagenomics sequencing, also known as environmental or community genomics, is a genomic study wherein the DNA of the specified host microorganism is extracted and cloned directly from the microorganism.
The market is expected to exhibit a strong 6.5% CAGR over the forecast period from 2017 to 2023.
The increasing research into genetics is likely to be a major driver for the market.
The Americas region dominates the global metagenomics sequencing market
Leading players in the metagenomics sequencing market include GATC Biotech, Enterome Bioscience, and Aperiomics, among others.
TABLE OF CONTENT
Chapter 1. Report Prologue
Chapter 2. Market Introduction
2.1 Definition
2.2 Scope of the Study
2.2.1 Research Objective
2.2.2 Assumptions
2.2.3 Limitations
Chapter 3. Research Methodology
3.1 Introduction
3.2 Primary Research
3.3 Secondary research
3.4 Market Size Estimation
Chapter 4. Market Dynamics
4.1 Drivers
4.2 Restrains
4.3 Opportunities
4.4 Challenges
4.5 Macroeconomic Indicators
4.6 Technology Trends & Assessment
Chapter 5. Market Factor Analysis
5.1 Porter’s Five Forces Analysis
5.1.1 Bargaining Power of Suppliers
5.1.2 Bargaining Power of Buyers
5.1.3 Threat of New Entrants
5.1.4 Threat of Substitutes
5.1.5 Intensity of Rivalry
5.2 Value Chain Analysis
5.3 Investment Feasibility Analysis
5.4 Pricing Analysis
Chapter 6. Global Metagenomic sequencing Market, by Technology
6.1 Introduction
6.2 Sequencing
6.2.1 Market Estimates & Forecast, 2016 – 2023
6.3 Bioinformatics
6.3.1 Market Estimates & Forecast, 2016 – 2023
6.4 Others
Chapter 7. Global Metagenomic sequencing Market, by Application
7.1 Introduction
7.2 Infectious disease diagnosis
7.2.1 Market Estimates & Forecast, 2017 – 2023
7.3 Environmental remediation
7.3.1 Market Estimates & Forecast, 2017 – 2023
7.4 Gut microbe characterization
7.4.1 Market Estimates & Forecast, 2017 – 2023
7.5 Biotechnology
7.5.1 Market Estimates & Forecast, 2017 – 2023
7.6 Biofuel
7.6.1 Market Estimates & Forecast, 2017 – 2023
7.7 Ecology
7.7.1 Market Estimates & Forecast, 2017 – 2023
7.8 Agriculture
7.8.1 Market Estimates & Forecast, 2017 – 2023
7.9 Others
Chapter 8. Global Metagenomic sequencing Market, by End User
8.1 Introduction
8.2 Hospitals
8.2.1 Market Estimates & Forecast, 2017 – 2023
8.3 Ambulatory Surgical Centers
8.3.1 Market Estimates & Forecast, 2017 – 2023
8.4 Specialized Clinics
8.4.1 Market Estimates & Forecast, 2017 – 2023
8.5 Others
Chapter. 9 Global Metagenomic sequencing Market, by Region
9.1 Introduction
9.2 Americas
9.2.1 North America
9.2.1.1 U.S.
9.2.1.1 Canada
9.2.2 South America
9.3 Europe
9.3.1 Western Europe
9.3.1.1 Germany
9.3.1.2 France
9.3.1.3 Italy
9.3.1.4 Spain
9.3.1.5 U.K
9.3.1.6 Rest of Western Europe
9.3.2 Eastern Europe
9.4 Asia Pacific
9.4.1 Japan
9.4.2 China
9.4.3 India
9.4.4 Australia
9.4.5 Republic of Korea
9.4.6 Rest of Asia Pacific
9.5 The Middle East & Africa
9.5.1 United Arab Emirates
9.5.2 Saudi Arabia
9.5.3 Rest of the Middle East & Africa
Chapter 10 Company Landscape
10.1 Introduction
10.2 Market Share Analysis
10.3 Key Development & Strategies
10.3.1 Key Developments
Chapter 11 Company Profiles
11.1 GATC Biotech AG
11.1.1 Company Overview
11.1.2 Application Overview
11.1.3 Financials
11.1.4 SWOT Analysis
11.2 Enterome Bioscience
11.2.1 Company Overview
11.2.2 Application Overview
11.2.3 Financial Overview
11.2.4 Key Developments
11.2.5 SWOT Analysis
11.3 Illumina Inc.
11.3.1 Company Overview
11.3.2 Application Overview
11.3.3 Financial Overview
11.3.4 Key Development
11.3.5 SWOT Analysis
11.4 Quest Diagnostics
11.4.1 Company Overview
11.4.2 Applications/Business Segment Overview
11.4.3 Financial Overview
11.4.4 Key Development
11.4.5 SWOT Analysis
11.5 F Hoffman-La Roche Ltd.
11.5.1 Company Overview
11.5.2 Application Overview
11.5.3 Financial overview
11.5.4 Key Developments
11.6 Thermo Fisher Scientific Inc.
11.6.1 Company Overview
11.6.2 Application Overview
11.6.3 Financial Overview
11.6.4 Key Developments
11.7 CLC Bio
11.7.1 Overview
11.7.2 Application Overview
11.7.3 Financials
11.7.4 Key Developments
11.7.5 SWOT Analysis
11.8 Agilent Technologies Inc.
11.8.1 Company Overview
11.8.2 Applications/Business Segment Overview
11.8.3 Financial Overview
11.8.4 Key Development
11.8.5 SWOT Analysis
11.9 Macrogen Inc.
11.9.1 Company Overview
11.9.2 Application Overview
11.9.3 Financial overview
11.9.4 Key Developments
11.10 Helicos BioSciences
11.10.1 Company Overview
11.10.2 Application Overview
11.10.3 Financial overview
11.10.4 Key Developments
11.11 Others
Chapter 12 MRFR Conclusion
12.1 Key Findings
12.1.1 From CEO’s View Point
12.1.2 Unmet Needs of the Market
12.2 Key Companies to Watch
12.3 Prediction of Pharmaceutical industry
Chapter 13 Appendix
LIST OF TABLES
Table 1 Metagenomic sequencing Industry Synopsis, 2017 – 2023
Table 2 Metagenomic sequencing Market Estimates and Forecast, 2017 – 2023, (USD Million)
Table 3 Metagenomic sequencing Market by Region, 2017 – 2023, (USD Million)
Table 4 Metagenomic sequencing Market by Technology, 2017 – 2023, (USD Million)
Table 5 Metagenomic sequencing Market by Applications, 2017 – 2023, (USD Million)
Table 6 Metagenomic sequencing Market by End Users, 2017 – 2023, (USD Million)
Table 7 North America Metagenomic sequencing Market by Technology, 2017 – 2023, (USD Million)
Table 8 North America Metagenomic sequencing Market by Applications, 2017 – 2023, (USD Million)
Table 9 North America Metagenomic sequencing Market by End User, 2017 – 2023, (USD Million)
Table 10 US Metagenomic sequencing Market by Technology, 2017 – 2023, (USD Million)
Table 11 US Metagenomic sequencing Market by Applications, 2017 – 2023, (USD Million)
Table 12 US Metagenomic sequencing Market by End User, 2017 – 2023, (USD Million)
Table 13 Canada Metagenomic sequencing Market by Technology, 2017 – 2023, (USD Million)
Table 14 Canada Metagenomic sequencing Market by Applications, 2017 – 2023, (USD Million)
Table 15 Canada Metagenomic sequencing Market by End User, 2017 – 2023, (USD Million)
Table 16 South America Metagenomic sequencing Market by Technology, 2017 – 2023, (USD Million)
Table 17 South America Metagenomic sequencing Market by Applications, 2017 – 2023, (USD Million)
Table 18 South America Metagenomic sequencing Market by End User, 2017 – 2023, (USD Million)
Table 19 Europe Metagenomic sequencing Market by Technology, 2017 – 2023, (USD Million)
Table 20 Europe Metagenomic sequencing Market by Applications, 2017 – 2023, (USD Million)
Table 21 Europe Metagenomic sequencing Market by End User, 2017 – 2023, (USD Million)
Table 22 Western Europe Metagenomic sequencing Market by Technology, 2017 – 2023, (USD Million)
Table 23 Western Europe Metagenomic sequencing Market by Applications, 2017 – 2023, (USD Million)
Table 24 Western Europe Metagenomic sequencing Market by End User, 2017 – 2023, (USD Million)
Table 25 Eastern Europe Metagenomic sequencing Market by Technology, 2017 – 2023, (USD Million)
Table 26 Eastern Europe Metagenomic sequencing Market by Applications, 2017 – 2023, (USD Million)
Table 27 Eastern Europe Metagenomic sequencing Market by End User, 2017 – 2023, (USD Million)
Table 28 Asia Pacific Metagenomic sequencing Market by Technology, 2017 – 2023, (USD Million)
Table 29 Asia Pacific Metagenomic sequencing Market by Applications, 2017 – 2023, (USD Million)
Table 30 Asia Pacific Metagenomic sequencing Market by End User, 2017 – 2023, (USD Million)
Table 31 The Middle East & Africa Metagenomic sequencing Market by Technology, 2017 – 2023, (USD Million)
Table 32 The Middle East & Africa Metagenomic sequencing Market by Applications, 2017 – 2023, (USD Million)
Table 33 The Middle East & Africa Metagenomic sequencing Market by End User, 2017 – 2023, (USD Million)
LIST OF FIGURES
Figure 1 Research Process
Figure 2 Segmentation for Metagenomic sequencing Market
Figure 3 Segmentation Market Dynamics for Metagenomic sequencing Market
Figure 4 Global Metagenomic sequencing Market Share, by Technology 2016
Figure 5 Global Metagenomic sequencing Market Share, by Application2016
Figure 6 Global Metagenomic sequencing Market Share, by End Users, 2016
Figure 7 Global Metagenomic sequencing Market Share, by Region, 2016
Figure 8 North America Metagenomic sequencing Market Share, by Country, 2016
Figure 9 Europe Metagenomic sequencing Market Share, by Country, 2016
Figure 10 Asia Pacific Metagenomic sequencing Market Share, by Country, 2016
Figure 11 The Middle East & Africa Metagenomic sequencing Market Share, by Country, 2016
Figure 12 Global Metagenomic sequencing Market: Company Share Analysis, 2016 (%)
Figure 13 GATC Biotech AG: Key Financials
Figure 14 GATC Biotech AG: Segmental Revenue
Figure 15 GATC Biotech AG: Geographical Revenue
Figure 16 Enterome Bioscience: Key Financials
Figure 17 Enterome Bioscience: Segmental Revenue
Figure 18 Enterome Bioscience: Geographical Revenue
Figure 19 Illumina Inc.: Key Financials
Figure 20 Illumina Inc.: Segmental Revenue
Figure 22 Illumina Inc.: Geographical Revenue
Figure 23 Quest Diagnostics: Key Financials
Figure 24 Quest Diagnostics: Segmental Revenue
Figure 25 Quest Diagnostics: Geographical Revenue
Figure 27 F Hoffman-La Roche Ltd.: Key Financials
Figure 28 F Hoffman-La Roche Ltd.: Segmental Revenue
Figure 29 F Hoffman-La Roche Ltd.: Geographical Revenue
Figure 30 Thermo Fisher Scientific Inc.: Key Financials
Figure 32 Thermo Fisher Scientific Inc.: Segmental Revenue
Figure 33 Thermo Fisher Scientific Inc.: Geographical Revenue
Figure 33 Tornier N.V.: Key Financials
Figure 34 Tornier N.V.: Segmental Revenue
Figure 35 Tornier N.V.: Geographical Revenue
Figure 36 Össur: Key Financials
Figure 37 Össur: Segmental Revenue
Figure 38 Össur: Geographical Revenue
Figure 39 Acumed, LLC: Key Financials
Figure 40 Acumed, LLC: Segmental Revenue
Figure 41 Acumed, LLC: Geographical Revenue