ID: MRFR/HCIT/0268-HCR | February 2021 | Region: Global | 117 pages
Market Scenario
Recently, medically prescribed apps have become popular and patients are accepting this advanced technology to track the fitness and health of the body. These apps provide enormous information about prevention of diseases, the price of various surgeries, availability of physician nearby, medical data calculation, and others. The demands for the medication prescribed apps is high due to increased prevalence of different lifestyle diseases such as diabetes & obesity, which requires continuous monitoring. These apps are used to continuously monitor the health of a person and notify him of new and available treatment along with their cost. Furthermore, enhance the medical knowledge, determine critical health parameters, and to provide e-prescribing, which, in turn, drives the growth of this market.
Increasing patient population with chronic diseases such as cancer, diabetes, obesity are generating the demand for advanced technology, which helps them to track their health-related issues so that they react accordingly.
According to World Health Organization (WHO), in 2015, Around 17.7 million people died from cardiovascular diseases, which represent 31% of total global deaths. Around 7.4 million of them were due to coronary heart disease and 6.7 million were due to stroke.
A number of factors are triggering the growth of such incidences, for example, rising aging population, unhealthy diet and low physical activities. According to a research, smoking increases the possibility of diabetes; more than 60% of the global population smokes, this has increased the risk of diabetes and contributed to the growth in diabetic population. According to the International Diabetes Federation in 2016, it was estimated that 420 million adult population had diabetes, which is increasing at the rate of 8.4% and is expected to reach 625 million by 2040.
Moreover, advancing medical device technology and increasing government support in developing countries are adding fuel to the growth the market.
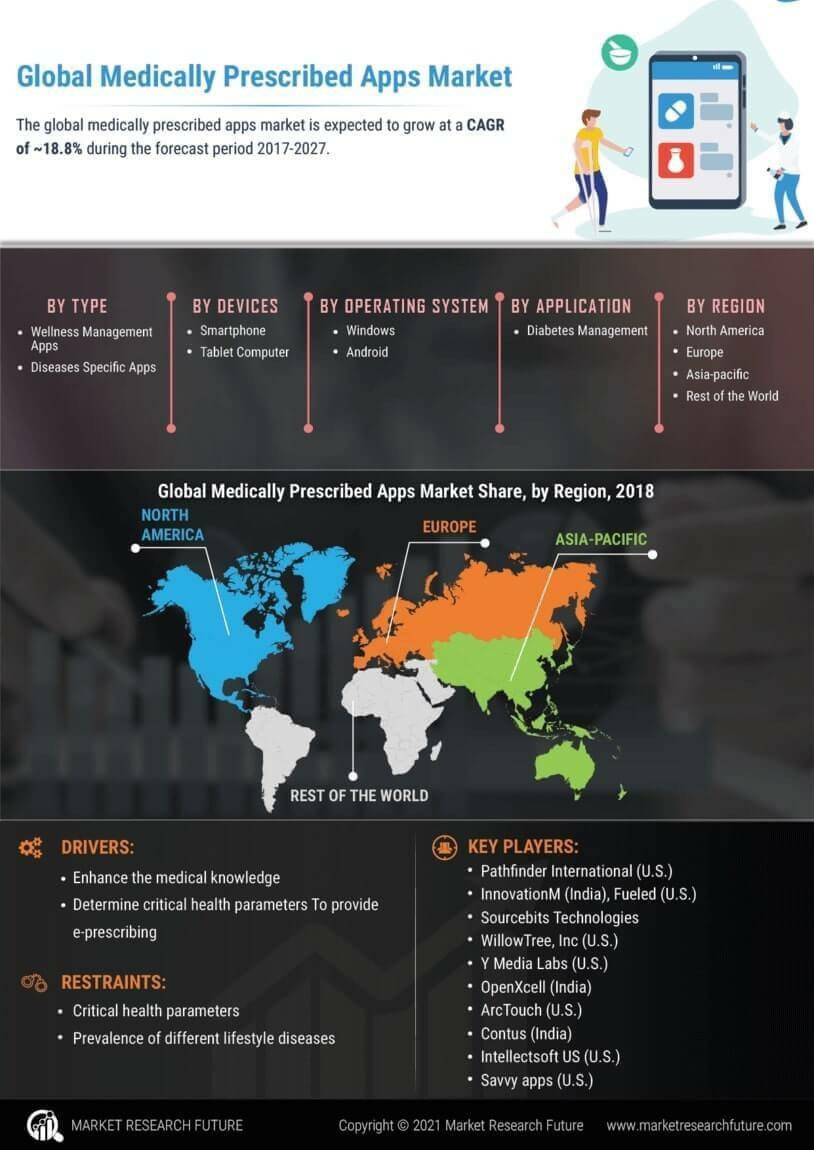
The global medically prescribed apps market is expected to grow at a CAGR of ~18.8% during the forecast period 2017-2027.
Intended Audience
Figure: Global Medically Prescribed Apps Market, by Region Market Share, 2016 (%)
Sources: Annual reports, Press release, White paper, Company presentation
Segmentations
The global medically prescribed apps market is segmented on the basis of types, devices, operating system, and application.
On the basis of the type, it is segmented into wellness management apps, diseases and treatment management apps, women’s health & pregnancy apps, diseases specific apps, and others.
On the basis of the devices, it is segmented into the personal digital assistant, smartphone, tablet computer, and others.
On the basis of the operating system, it is segmented into windows, android, iOS system, and others.
On the basis of the application, it is segmented into diabetes management, multi-parameter tracker, cardiac monitoring, and others.
Research Methodology
Sources: Annual reports, Press release, White paper, and Company presentation
Regional Analysis
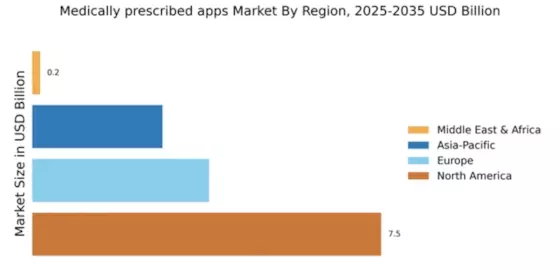
The Americas dominate the global medically prescribed apps market owing to the rising prevalence of chronic disease, unhealthy diets, high health care spending, and low physical exercise. Furthermore, increasing government support for research & development and the concentration of major companies have fuelled the growth of the market in this region.
Europe holds the second position in the global medically prescribed apps market owing to the government support for research & development and availability of funds for research. Although companies within this region also involved in export to the developing countries, which leads the market of Europe.
The Asia Pacific is the fastest growing medically prescribed apps market owing to the huge presence of patients with chronic disease. Additionally, rapidly developing healthcare technology is increasing demand for new technology in countries like India and China. Furthermore, increasing demand for quality devices in the healthcare provides the opportunity for the market players to fill the gap between demand and supply and maximize the profits.
On the other hand, in the Middle East and Africa holds the least share of the global market due to low research and development activities and poor healthcare infrastructure.
Key Players
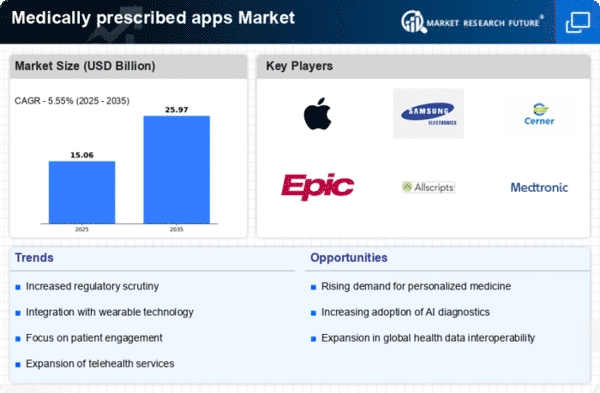
Some of key the players in the market are Pathfinder International (U.S.), InnovationM (India), Fueled (U.S.), Sourcebits Technologies, WillowTree, Inc (U.S.), Y Media Labs (U.S.), OpenXcell (India), ArcTouch (U.S.), Contus (India), Intellectsoft US (U.S.), Savvy apps (U.S.)
Report Attribute/Metric | Details |
---|---|
Market Size | 2027: Significant value |
CAGR | 18.8% (2017-2027) |
Base Year | 2019 |
Forecast Period | 2020-2027 |
Historical Data | 2018 |
Forecast Units | Value (USD Million) |
Report Coverage | Revenue Forecast, Competitive Landscape, Growth Factors, and Trends |
Segments Covered | By Type, Devices, Operating System, Application |
Geographies Covered | North America, Europe, Asia-Pacific, and Rest of the World (RoW) |
Key Vendors | Pathfinder International (U.S.), InnovationM (India), Fueled (U.S.), Sourcebits Technologies, WillowTree, Inc (U.S.), Y Media Labs (U.S.), OpenXcell (India), ArcTouch (U.S.), Contus (India), Intellectsoft US (U.S.), Savvy apps (U.S.) |
Key Market Opportunities |
|
Key Market Drivers |
|
Frequently Asked Questions (FAQ) :
Medically Prescribed Apps are apps that provide the patient with information on prevention of diseases, the price of various surgeries, availability of physicians nearby, medical data calculation, and others.
Medically Prescribed Apps Market is expected to exhibit a strong 18.8% CAGR over the forecast period from 2017 to 2027.
Growing usage of mobile phones by the patient population is the major driver for the Global Medically Prescribed Apps Market.
The Americas hold a dominant 47% share in the Global Medically Prescribed Apps Market.
Leading players in the Medically Prescribed Apps Market include Pathfinder, InnovationM, and Fueled, among others.
Table of Content
1. Report Prologue
2. Market Introduction
2.1 Definition
2.2 Scope of the Study
2.2.1 Research Objective
2.2.2 Assumptions
2.2.3 Limitations
3. Research Methodology
3.1 Introduction
3.2 Primary Research
3.3 Secondary research
3.4 Market Size Estimation
4. Market Dynamics
4.1 Drivers
4.2 Restrains
4.3 Opportunities
4.4 Challenges
4.5 Macroeconomic Indicators
4.6 Technology Trends & Assessment
5. Market Factor Analysis
5.1 Porters Five Forces Analysis
5.1.1 Bargaining Power of Suppliers
5.1.2 Bargaining Power of Buyers
5.1.3 Threat of New Entrants
5.1.4 Threat of Substitutes
5.1.5 Intensity of Rivalry
5.2 Value Chain Analysis
5.3 Investment Feasibility Analysis
5.4 Pricing Analysis
6. Global Medically Prescribed apps Market, by Type
6.1 Introduction
6.2 Wellness Management Apps
6.2.1 Market Estimates & Forecast, 2017-2027
6.3 Diseases and Treatment Management Apps
6.3.1 Market Estimates & Forecast, 2017-2027
6.4 Women’s Health & Pregnancy Apps
6.4.1 Market Estimates & Forecast, 2017-2027
6.5 Diseases Specific Apps
6.5.1 Market Estimates & Forecast, 2017-2027
6.6 Others
6.6.1 Market Estimates & Forecast, 2017-2027
7. Global Medically Prescribed apps Market, by Devices
7.1 Introduction
7.2 Personal Digital Assistant
7.2.1 Market Estimates & Forecast, 2017-2027
7.3 Smartphone
7.3.1 Market Estimates & Forecast, 2017-2027
7.4 Tablet Computer
7.4.1 Market Estimates & Forecast, 2017-2027
7.5 Others
7.5.1 Market Estimates & Forecast, 2017-2027
8. Global Medically Prescribed apps Market, by Operating System
8.1 Introduction
8.2 Windows
8.2.1 Market Estimates & Forecast, 2017-2027
8.3 Android
8.3.1 Market Estimates & Forecast, 2017-2027
8.4 iOS System
8.4.1 Market Estimates & Forecast, 2017-2027
8.5 Others
8.5.1 Market Estimates & Forecast, 2017-2027
9. Global Medically Prescribed apps Market, by Application
9.1 Introduction
9.2 Diabetes Management
9.2.1 Market Estimates & Forecast, 2017-2027
9.3 Multi-Parameter Tracker
9.3.1 Market Estimates & Forecast, 2017-2027
9.4 Cardiac Monitoring
9.4.1 Market Estimates & Forecast, 2017-2027
9.5 Others
9.5.1 Market Estimates & Forecast, 2017-2027
10. Global Medically Prescribed apps Market, by Region
10.1 Introduction
10.2 Americas
10.2.1 North America
10.2.1.1 U.S.
10.2.1.2 Canada
10.2.2 South America
10.3 Europe
10.3.1 Western Europe
10.3.1.1 Germany
10.3.1.2 France
10.3.1.3 U.K.
10.3.1.4 Italy
10.3.1.5 Spain
10.3.1.6 Rest of Western Europe
10.3.2 Eastern Europe
10.4 Asia Pacific
10.4.1 Japan
10.4.2 China
10.4.3 India
10.4.4 Australia
10.4.5 Republic of Korea
10.4.6 Rest of Asia Pacific
10.5 The Middle East & Africa
10.5.1 United Arab Emirates
10.5.2 Saudi Arabia
10.5.3 Oman
10.5.4 Kuwait
10.5.5 Qatar
10.5.6 Rest of the Middle East & Africa
11 Company Landscape
11.1 Introduction
11.2 Market Share Analysis
11.3 Key Development & Strategies
11.3.1 Key Developments
12 Company Profiles
12.1 Pathfinder International
12.1.1 Company Overview
12.1.2 Product Overview
12.1.3 Financials
12.1.4 SWOT Analysis
12.2 InnovationM
12.2.1 Company Overview
12.2.2 Product Overview
12.2.3 Financial Overview
12.2.4 Key Developments
12.2.5 SWOT Analysis
12.3 Fueled
12.3.1 Company Overview
12.3.2 Product Overview
12.3.3 Financial Overview
12.3.4 Key Development
12.3.5 SWOT Analysis
12.4 Sourcebits Technologies
12.4.1 Company Overview
12.4.2 Product/Business Segment Overview
12.4.3 Financial Overview
12.4.4 Key Development
12.4.5 SWOT Analysis
12.5 WillowTree, Inc
12.5.1 Company Overview
12.5.2 Product Overview
12.5.3 Financial overview
12.5.4 Key Developments
12.5.5 SWOT Analysis
12.6 Y Media Labs
12.6.1 Company Overview
12.6.2 Product Overview
12.6.3 Financial Overview
12.6.4 Key Developments
12.6.5 SWOT Analysis
12.7 OpenXcell
12.7.1 Overview
12.7.2 Product Overview
12.7.3 Financials
12.7.4 Key Developments
12.7.5 SWOT Analysis
12.8 ArcTouch
12.8.1 Overview
12.8.2 Product Overview
12.8.3 Financials
12.8.4 Key Developments
12.8.5 SWOT Analysis
12.9 Contus
12.9.1 Overview
12.9.2 Product Overview
12.9.3 Financials
12.9.4 Key Developments
12.9.5 SWOT Analysis
12.10 Intellectsoft US
12.10.1 Overview
12.10.2 Product Overview
12.10.3 Financials
12.10.4 Key Developments
12.10.5 SWOT Analysis
12.11 Savvy apps
12.11.1 Overview
12.11.2 Product Overview
12.11.3 Financials
12.11.4 Key Developments
12.11.5 SWOT Analysis
12.12 Others
13 MRFR Conclusion
13.1 Key Findings
13.1.1 From CEO’s View Point
13.1.2 Unmet Needs of the Market
13.2 Key Companies to Watch
13.3 Prediction of Pharmaceutical Industry
14 Appendix
LIST OF TABLES
Table 1 Medically Prescribed apps Industry Synopsis, 2017-2027
Table 2 Global Medically Prescribed apps Market Estimates and Forecast, 2017-2027, (USD Million)
Table 3 Global Medically Prescribed apps Market by Region, 2017-2027, (USD Million)
Table 4 Global Medically Prescribed apps Market by Types, 2017-2027, (USD Million)
Table 5 Global Medically Prescribed apps Market by Devices, 2017-2027, (USD Million)
Table 6 Global Medically Prescribed apps Market by Operating System, 2017-2027, (USD Million)
Table 7 Global Medically Prescribed apps Market by Applications, 2017-2027, (USD Million)
Table 8 North America Medically Prescribed apps Market by Types, 2017-2027, (USD Million)
Table 9 North America Medically Prescribed apps Market by Devices, 2017-2027, (USD Million)
Table 10 North America Medically Prescribed apps Market by Operating System, 2017-2027, (USD Million)
Table 11 North America Medically Prescribed apps Market by Applications, 2017-2027, (USD Million)
Table 12 US Medically Prescribed apps Market by Types, 2017-2027, (USD Million)
Table 13 US Medically Prescribed apps Market by Devices, 2017-2027, (USD Million)
Table 14 US Medically Prescribed apps Market by Operating System, 2017-2027, (USD Million)
Table 15 US Medically Prescribed apps Market by Applications, 2017-2027, (USD Million)
Table 16 Canada Medically Prescribed apps Market by Types, 2017-2027, (USD Million)
Table 17 Canada Medically Prescribed apps Market by Devices, 2017-2027, (USD Million)
Table 18 Canada Medically Prescribed apps Market by Operating System, 2017-2027, (USD Million)
Table 19 Canada Medically Prescribed apps Market by Applications, 2017-2027, (USD Million)
Table 20 South America Medically Prescribed apps Market by Types, 2017-2027, (USD Million)
Table 21 South America Medically Prescribed apps Market by Devices, 2017-2027, (USD Million)
Table 22 South America Medically Prescribed apps Market by Operating System, 2017-2027, (USD Million)
Table 23 South America Medically Prescribed apps Market by Applications, 2017-2027, (USD Million)
Table 24 Europe Medically Prescribed apps Market by Types, 2017-2027, (USD Million)
Table 25 Europe Medically Prescribed apps Market by Devices, 2017-2027, (USD Million)
Table 26 Europe Medically Prescribed apps Market by Operating System, 2017-2027, (USD Million)
Table 27 Europe Medically Prescribed apps Market by Applications, 2017-2027, (USD Million)
Table 28 Western Europe Medically Prescribed apps Market by Types, 2017-2027, (USD Million)
Table 29 Western Europe Medically Prescribed apps Market by Devices, 2017-2027, (USD Million)
Table 30 Western Europe Medically Prescribed apps Market by Operating System, 2017-2027, (USD Million)
Table 31 Western Europe Medically Prescribed apps Market by Applications, 2017-2027, (USD Million)
Table 32 Eastern Europe Medically Prescribed apps Market by Types, 2017-2027, (USD Million)
Table 33 Eastern Europe Medically Prescribed apps Market by Devices, 2017-2027, (USD Million)
Table 34 Eastern Europe Medically Prescribed apps Market by Operating System, 2017-2027, (USD Million)
Table 35 Eastern Europe Medically Prescribed apps Market by Applications, 2017-2027, (USD Million)
Table 36 Asia Pacific Medically Prescribed apps Market by Types, 2017-2027, (USD Million)
Table 37 Asia Pacific Medically Prescribed apps Market by Devices, 2017-2027, (USD Million)
Table 38 Asia Pacific Medically Prescribed apps Market by Operating System, 2017-2027, (USD Million)
Table 39 Asia Pacific Medically Prescribed apps Market by Applications, 2017-2027, (USD Million)
Table 40 Middle East & Africa Medically Prescribed apps Market by Types, 2017-2027, (USD Million)
Table 41 Middle East & Africa Medically Prescribed apps Market by Devices, 2017-2027, (USD Million)
Table 42 Middle East & Africa Medically Prescribed apps Market by Operating System, 2017-2027, (USD Million)
Table 43 Middle East & Africa Medically Prescribed apps Market by Applications, 2017-2027, (USD Million)
LIST OF FIGURES
Figure 1 Research Process
Figure 2 Segmentation for Global Medically Prescribed apps Market
Figure 3 Segmentation Market Dynamics for Medically Prescribed apps Market
Figure 4 Global Medically Prescribed apps Market Share, by Type 2016
Figure 5 Global Medically Prescribed apps Market Share, by Devices 2016
Figure 6 Global Medically Prescribed apps Market Share, by Operating System 2016
Figure 7 Global Medically Prescribed apps Market Share, by Applications, 2016
Figure 8 Global Medically Prescribed apps Market Share, by Region, 2016
Figure 9 America Medically Prescribed apps Market Share, by Country, 2016
Figure 10 Europe Medically Prescribed apps Market Share, by Country, 2016
Figure 11 Asia Pacific Medically Prescribed apps Market Share, by Country, 2016
Figure 12 Middle East & Africa Medically Prescribed apps Market Share, by Country, 2016
Figure 13 Global Medically Prescribed apps Market: Company Share Analysis, 2016 (%)
Figure 14 Pathfinder International: Key Financials
Figure 15 Pathfinder International: Segmental Revenue
Figure 16 Pathfinder International: Geographical Revenue
Figure 17 InnovationM: Key Financials
Figure 18 InnovationM: Segmental Revenue
Figure 19 InnovationM: Geographical Revenue
Figure 20 Fueled: Key Financials
Figure 21 Fueled: Segmental Revenue
Figure 22 Fueled: Geographical Revenue
Figure 23 Sourcebits Technologies: Key Financials
Figure 24 Sourcebits Technologies: Segmental Revenue
Figure 25 Sourcebits Technologies: Geographical Revenue
Figure 26 WillowTree, Inc: Key Financials
Figure 27 WillowTree, Inc: Segmental Revenue
Figure 28 WillowTree, Inc: Geographical Revenue
Figure 29 Y Media Labs: Key Financials
Figure 30 Y Media Labs: Segmental Revenue
Figure 31 Y Media Labs: Geographical Revenue
Figure 32 OpenXcell: Key Financials
Figure 33 OpenXcell: Segmental Revenue
Figure 34 OpenXcell: Geographical Revenue
Figure 35 ArcTouch: Key Financials
Figure 36 ArcTouch: Segmental Revenue
Figure 37 ArcTouch: Geographical Revenue
Figure 38 Contus: Key Financials
Figure 39 Contus: Segmental Revenue
Figure 40 Contus: Geographical Revenue
Figure 41 Intellectsoft US: Key Financials
Figure 42 Intellectsoft US: Segmental Revenue
Figure 43 Intellectsoft US: Geographical Revenue
Figure 44 Savvy apps: Key Financials
Figure 45 Savvy apps: Segmental Revenue
Figure 46 Savvy apps: Geographical Revenue