Segmentation Quick Reference
| Dimension | Sub-Segments | Dominant Segment | Fastest Growing Segment |
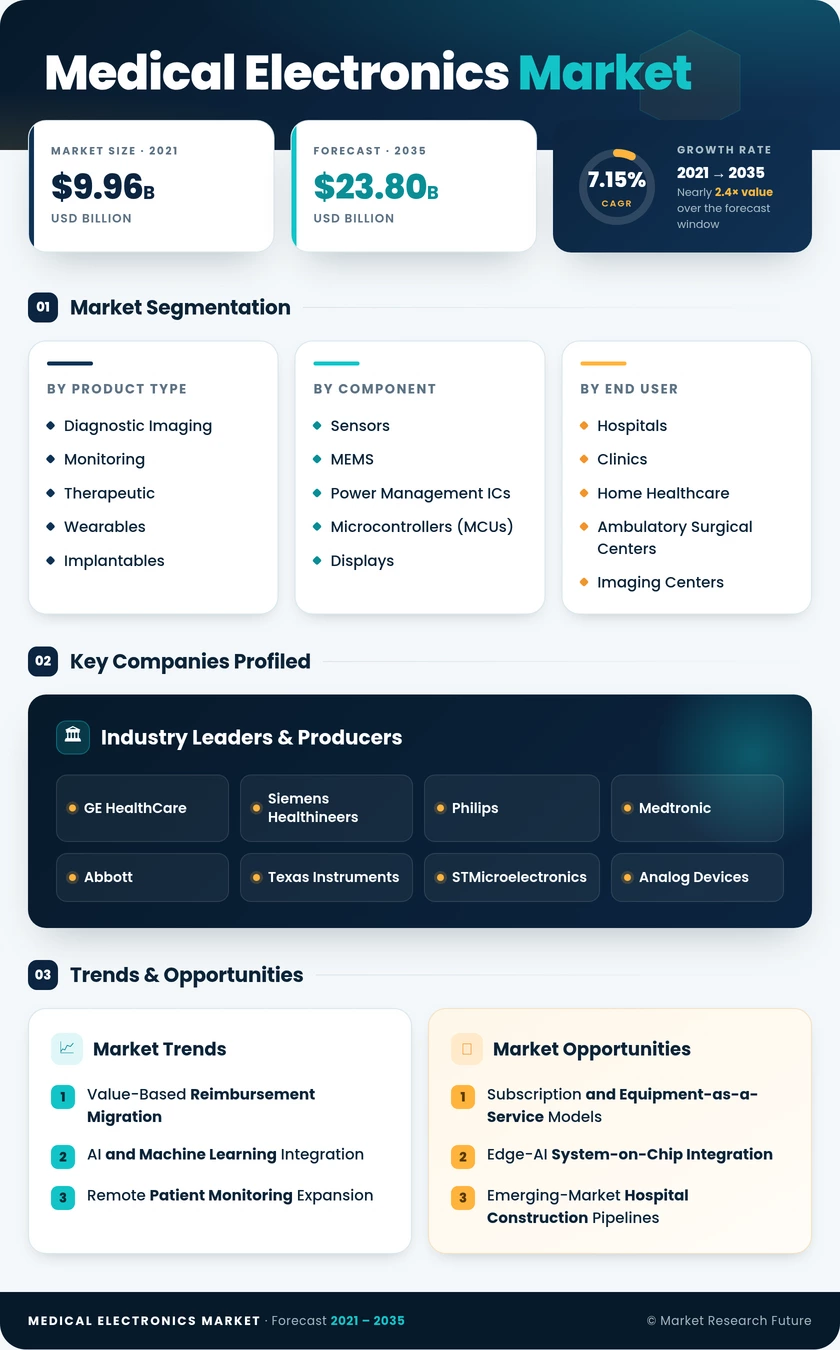
| Product Type | Diagnostic Imaging, Monitoring, Therapeutic, Wearables and Implantables | Diagnostic Imaging | Wearables and Implantables |
| Component | Sensors and MEMS, Power Management ICs, Microcontrollers (MCUs), Displays | Sensors and MEMS | Power Management ICs |
| End User | Hospitals and Clinics, Home Medical Electronics Market, Ambulatory Surgical Centers, Imaging Centers | Hospitals and Clinics | Home Medical Electronics Market |
| Clinical Application | Cardiology, Neurology, Oncology, Orthopedics | Cardiology | Oncology |
| Connectivity | Wired (LAN / Field-Bus), Bluetooth Low Energy, Wi-Fi, Hybrid (Multi-Protocol) | Wired (LAN / Field-Bus) | Bluetooth Low Energy |
| Geography | North America, Europe, Asia-Pacific, South America, Middle East & Africa | North America | Asia-Pacific |
Market Segmentation Overview
By Product Type
| Sub-Segment | Key Trend |
| Diagnostic Imaging | Low-cryogen MRI and photon-counting CT replacing legacy helium-cooled and conventional detector platforms |
| Monitoring | RPM reimbursement expansion driving ward-to-home migration of connected vital-signs monitors |
| Therapeutic | Robotic-assisted surgery and closed-loop neuromodulation are raising the electronics content per procedure. |
| Wearables and Implantables | AI-enabled biosensors enabling multi-analyte continuous measurement on single disposable patches |
Diagnostic imaging remains the revenue anchor for this dimension. However, growth is shifting decisively toward wearables and implantables as reimbursement codes and consumer health awareness expand the addressable population far beyond acute-care settings.
By Component
| Sub-Segment | Key Trend |
| Sensors and MEMS | Multi-modal sensor fusion combining optical, electrochemical, and inertial measurements on a single die |
| Power Management ICs | Ultra-low quiescent-current architectures extending wearable battery life beyond 14-day wear cycles |
| Microcontrollers (MCUs) | RTOS-certified MCUs with integrated hardware security modules meeting FDA cybersecurity requirements |
| Displays | High-brightness surgical displays and micro-LED panels for portable ultrasound handsets |
Sensors and MEMS command the largest component share, reflecting their universal applicability across every product type from imaging detectors to wearable patches.
By End User
| Sub-Segment | Key Trend |
| Hospitals and Clinics | Enterprise-wide networked monitoring and AI-assisted diagnostic workflows |
| Home Medical Electronics Market | CMS and NHS RPM code expansion creating annuity revenue models for device manufacturers |
| Ambulatory Surgical Centers | Outpatient-shift trend in orthopedics, ophthalmology, and GI is driving compact device demand. |
| Imaging Centers | Community Diagnostic Center programs in the UK and Germany are expanding decentralized imaging access. |
Hospitals and clinics dominate spending, but home healthcare is narrowing the gap at the fastest end-user CAGR as payers incentivize post-discharge remote monitoring.
By Clinical Application
| Sub-Segment | Key Trend |
| Cardiology | Insertable cardiac monitors and AF screening programs are broadening device-eligible populations. |
| Neurology | Miniaturized EEG headsets and closed-loop deep-brain stimulators are expanding ambulatory diagnostics. |
| Oncology | Liquid-biopsy hardware and AI-guided radiotherapy planning are driving the convergence of imaging and therapy. |
| Orthopedics | Smart implant sensors transmitting post-surgical healing data for outcome-linked reimbursement |
Cardiology holds the largest application share, while oncology is growing fastest as precision-medicine protocols require tighter integration between diagnostic imaging and therapeutic delivery electronics.
By Connectivity
| Sub-Segment | Key Trend |
| Wired (LAN / Field-Bus) | Deterministic latency requirements in ICUs and operating theaters sustaining installed-base inertia |
| Bluetooth Low Energy | BLE 5.4 channel-sounding enabling room-level patient localization alongside physiological data transfer |
| Wi-Fi | Wi-Fi 6E provides dedicated UNII-5 spectrum for high-throughput medical-image transfer. |
| Hybrid (Multi-Protocol) | Multi-radio SoCs supporting simultaneous BLE, Wi-Fi, and Thread for cross-department interoperability. |
Wired links retain majority share in acute-care settings, but wireless protocols — particularly Bluetooth Low Energy — are capturing incremental growth in ambulatory, home, and wearable device categories.