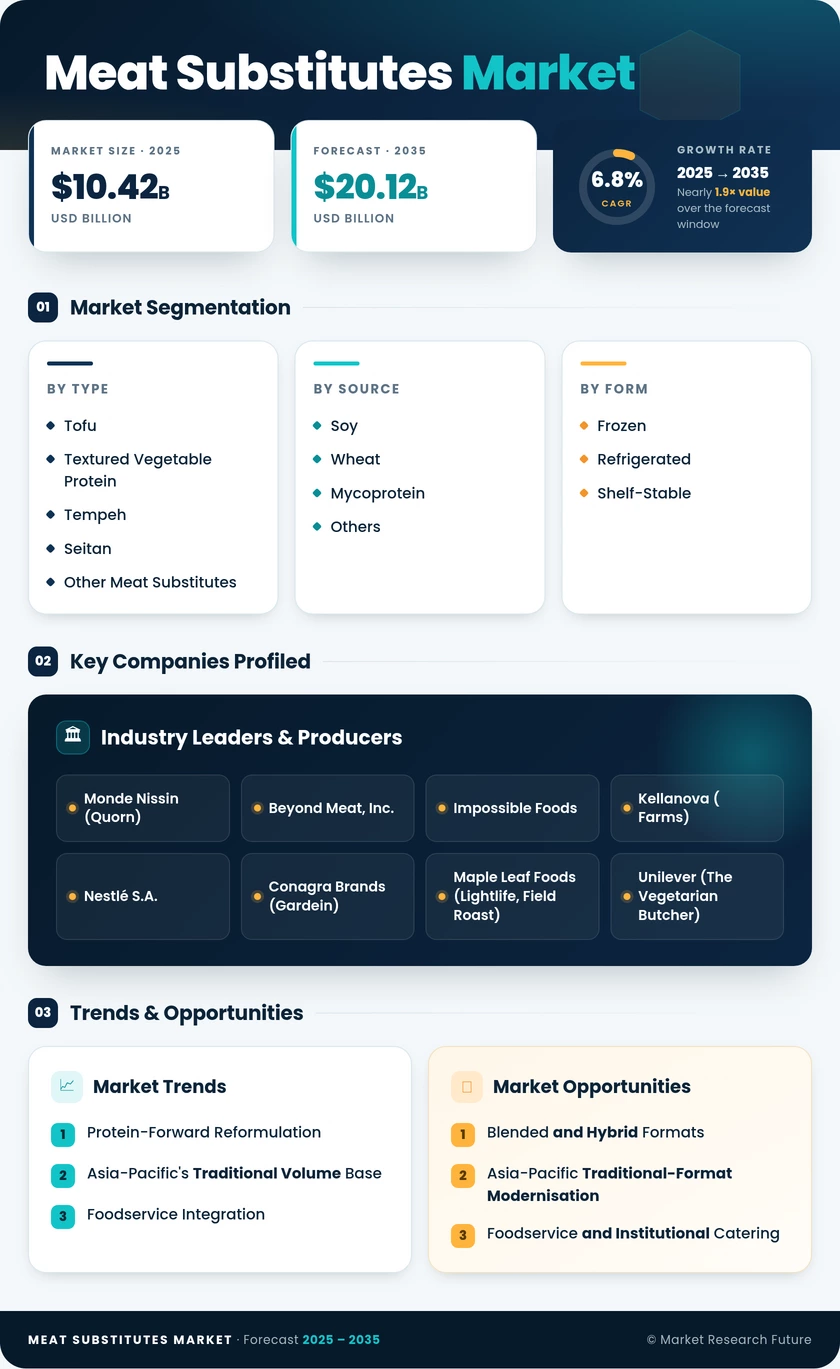
Meat Substitutes Market (2026 - 2035)

ID: MRFR/FnB/1437-CR 126 Pages Sakshi Gupta Last Updated: September 15, 2026
Meat Substitutes Market Size, Share, Industry Trend & Analysis Research Report Information By Type (Tofu, Tempeh, Textured Vegetable Protein, Seitan, Other Meat Substitutes), By Source (Soy, Wheat, Mycoprotein, Others), By Form (Frozen, Refrigerated, Shelf-Stable), By Distribution Channel (On-Trade, Off-Trade), By Geography (North America, Europe, Asia-Pacific, South America, Middle East & Africa) - Forecast Till 2035
Meat Substitutes Market
Market Size
Forecast Period2026-2035
CAGR (2026-2035)6.8%
2025 Market SizeUSD 10.42 Billion
2035 Market SizeUSD 20.12 Billion
Key Players
Monde Nissin
Beyond Meat, Inc.
Impossible Foods
Kellanova
Nestlé S.A.
Conagra Brands
Opportunities
  • Blended and Hybrid Formats
  • Asia-Pacific Traditional-Format Modernisation
  • Foodservice and Institutional Catering
  1. 1 Market Overview |
    1. 1.1 Study Assumptions & Market Definition |
    2. 1.2 Scope of the Study |
    3. 1.3 Research Methodology
  2. 2 Market Summary & Key Takeaways
  3. 3 Market Dynamics |
    1. 3.1 Market Drivers Analysis | |
      1. 3.1.1 Protein-Forward Reformulation & Clean-Label Pivot | |
      2. 3.1.2 Traditional Substitute Demand Base in Asia-Pacific | |
      3. 3.1.3 Foodservice Menu Integration & Blended Formats | |
      4. 3.1.4 Private Label Entry & Price Convergence | |
      5. 3.1.5 Corporate Scope 3 Emissions Commitments | |
      6. 3.1.6 Mycoprotein & Fermentation Capacity Expansion |
    2. 3.2 Market Restraints Analysis | |
      1. 3.2.1 Ultra-Processed Food Perception Backlash | |
      2. 3.2.2 United States Retail Category Contraction | |
      3. 3.2.3 Price Premium Versus Conventional Meat | |
      4. 3.2.4 EU Labelling Restrictions & Repackaging Cost | |
      5. 3.2.5 Venture Funding Contraction & Consolidation |
    3. 3.3 Market Opportunity Analysis | |
      1. 3.3.1 Blended & Hybrid Formats | |
      2. 3.3.2 Asia-Pacific Traditional-Format Modernisation | |
      3. 3.3.3 Foodservice & Institutional Catering | |
      4. 3.3.4 Adjacent Protein Categories & Direct-to-Consumer Models | |
      5. 3.3.5 Mycoprotein & Fermentation Supply |
    4. 3.4 Industry Value Chain Analysis |
    5. 3.5 Porter's Five Forces Analysis
  4. 4 Global Meat Substitutes Market Size & Forecast (2021–2035) |
    1. 4.1 Historical Market Size (2021–2025) |
    2. 4.2 Current & Forecast Market Size (2026–2035) |
    3. 4.3 Market Size by Revenue (USD Billion) |
    4. 4.4 Year-over-Year Growth Analysis
  5. 5 Segmentation Analysis |
    1. 5.1 By Type | |
      1. 5.1.1 Tofu | |
      2. 5.1.2 Tempeh | |
      3. 5.1.3 Textured Vegetable Protein | |
      4. 5.1.4 Seitan | |
      5. 5.1.5 Other Meat Substitutes |
    2. 5.2 By Source | |
      1. 5.2.1 Soy | |
      2. 5.2.2 Wheat | |
      3. 5.2.3 Mycoprotein | |
      4. 5.2.4 Others |
    3. 5.3 By Form | |
      1. 5.3.1 Frozen | |
      2. 5.3.2 Refrigerated | |
      3. 5.3.3 Shelf-Stable |
    4. 5.4 By Distribution Channel | |
      1. 5.4.1 On-Trade | |
      2. 5.4.2 Off-Trade
  6. 6 Regional Analysis |
    1. 6.1 North America | |
      1. 6.1.1 US | |
      2. 6.1.2 Canada | |
      3. 6.1.3 Mexico |
    2. 6.2 Europe | |
      1. 6.2.1 Germany | |
      2. 6.2.2 UK | |
      3. 6.2.3 France | |
      4. 6.2.4 Italy | |
      5. 6.2.5 Spain | |
      6. 6.2.6 Nordic Countries | |
      7. 6.2.7 Russia | |
      8. 6.2.8 Rest of Europe |
    3. 6.3 Asia-Pacific | |
      1. 6.3.1 China | |
      2. 6.3.2 India | |
      3. 6.3.3 Japan | |
      4. 6.3.4 South Korea | |
      5. 6.3.5 ASEAN | |
      6. 6.3.6 Rest of Asia-Pacific |
    4. 6.4 South America | |
      1. 6.4.1 Brazil | |
      2. 6.4.2 Argentina | |
      3. 6.4.3 Rest of South America |
    5. 6.5 Middle East & Africa | |
      1. 6.5.1 Saudi Arabia | |
      2. 6.5.2 UAE | |
      3. 6.5.3 South Africa | |
      4. 6.5.4 Egypt | |
      5. 6.5.5 Rest of Middle East & Africa
  7. 7 Competitive Landscape |
    1. 7.1 Market Share Analysis (2026) |
    2. 7.2 Competitive Benchmarking Matrix |
    3. 7.3 Company Profiles | |
      1. 7.3.1 Monde Nissin (Quorn) | |
      2. 7.3.2 Beyond Meat, Inc. | |
      3. 7.3.3 Impossible Foods | |
      4. 7.3.4 Kellanova ( Farms) | |
      5. 7.3.5 Nestlé S.A. | |
      6. 7.3.6 Conagra Brands (Gardein) | |
      7. 7.3.7 Maple Leaf Foods (Lightlife, Field Roast) | |
      8. 7.3.8 Unilever (The Vegetarian Butcher) | |
      9. 7.3.9 Vitasoy International | |
      10. 7.3.10 House Foods Group | |
      11. 7.3.11 Pulmuone Co., Ltd. | |
      12. 7.3.12 Hain Celestial (Linda McCartney)
  8. 8 Future Outlook & Strategic Recommendations (2026–2035) |
    1. 8.1 Near-Term Outlook (2026–2028) |
    2. 8.2 Medium-Term Outlook (2029–2031) |
    3. 8.3 Long-Term Outlook (2032–2035)
  9. 9 Recent Developments & News
  10. 10 Frequently Asked Questions (FAQs)
  11. 11 Report Scope & Methodology |
    1. 11.1 Study Period & Base Year |
    2. 11.2 Data Sources & Citations |
    3. 11.3 Abbreviations
  12. 12 LIST OF TABLES |
  13. TABLE 1 Global Meat Substitutes Market Size & Forecast, by Revenue (USD Billion), 2021–2035 |
  14. TABLE 2 Global Meat Substitutes Market – Year-over-Year Growth Analysis, 2021–2035 |
  15. TABLE 3 Driver Impact Analysis – Global Meat Substitutes Market |
  16. TABLE 4 Restraint Impact Analysis – Global Meat Substitutes Market |
  17. TABLE 5 Global Meat Substitutes Market Size, by Type, 2021–2035 (USD Billion) |
  18. TABLE 6 Global Meat Substitutes Market Size, by Source, 2021–2035 (USD Billion) |
  19. TABLE 7 Global Meat Substitutes Market Size, by Form, 2021–2035 (USD Billion) |
  20. TABLE 8 Global Meat Substitutes Market Size, by Distribution Channel, 2021–2035 (USD Billion) |
  21. TABLE 9 Global Meat Substitutes Market Size, by Region, 2021–2035 (USD Billion) |
  22. TABLE 10 North America Meat Substitutes Market Size, by Country, 2021–2035 (USD Billion) |
  23. TABLE 11 Europe Meat Substitutes Market Size, by Country, 2021–2035 (USD Billion) |
  24. TABLE 12 Asia-Pacific Meat Substitutes Market Size, by Country, 2021–2035 (USD Billion) |
  25. TABLE 13 South America Meat Substitutes Market Size, by Country, 2021–2035 (USD Billion) |
  26. TABLE 14 Middle East & Africa Meat Substitutes Market Size, by Country, 2021–2035 (USD Billion) |
  27. TABLE 15 North America Meat Substitutes Market Size, by Type, 2021–2035 (USD Billion) |
  28. TABLE 16 North America Meat Substitutes Market Size, by Source, 2021–2035 (USD Billion) |
  29. TABLE 17 North America Meat Substitutes Market Size, by Form, 2021–2035 (USD Billion) |
  30. TABLE 18 North America Meat Substitutes Market Size, by Distribution Channel, 2021–2035 (USD Billion) |
  31. TABLE 19 Europe Meat Substitutes Market Size, by Type, 2021–2035 (USD Billion) |
  32. TABLE 20 Europe Meat Substitutes Market Size, by Source, 2021–2035 (USD Billion) |
  33. TABLE 21 Europe Meat Substitutes Market Size, by Form, 2021–2035 (USD Billion) |
  34. TABLE 22 Europe Meat Substitutes Market Size, by Distribution Channel, 2021–2035 (USD Billion) |
  35. TABLE 23 Asia-Pacific Meat Substitutes Market Size, by Type, 2021–2035 (USD Billion) |
  36. TABLE 24 Asia-Pacific Meat Substitutes Market Size, by Source, 2021–2035 (USD Billion) |
  37. TABLE 25 Asia-Pacific Meat Substitutes Market Size, by Form, 2021–2035 (USD Billion) |
  38. TABLE 26 Asia-Pacific Meat Substitutes Market Size, by Distribution Channel, 2021–2035 (USD Billion) |
  39. TABLE 27 South America Meat Substitutes Market Size, by Type, 2021–2035 (USD Billion) |
  40. TABLE 28 South America Meat Substitutes Market Size, by Source, 2021–2035 (USD Billion) |
  41. TABLE 29 South America Meat Substitutes Market Size, by Form, 2021–2035 (USD Billion) |
  42. TABLE 30 South America Meat Substitutes Market Size, by Distribution Channel, 2021–2035 (USD Billion) |
  43. TABLE 31 Middle East & Africa Meat Substitutes Market Size, by Type, 2021–2035 (USD Billion) |
  44. TABLE 32 Middle East & Africa Meat Substitutes Market Size, by Source, 2021–2035 (USD Billion) |
  45. TABLE 33 Middle East & Africa Meat Substitutes Market Size, by Form, 2021–2035 (USD Billion) |
  46. TABLE 34 Middle East & Africa Meat Substitutes Market Size, by Distribution Channel, 2021–2035 (USD Billion) |
  47. TABLE 35 US Meat Substitutes Market Size, by Type & Source, 2021–2035 (USD Billion) |
  48. TABLE 36 China Meat Substitutes Market Size, by Type & Source, 2021–2035 (USD Billion) |
  49. TABLE 37 Germany Meat Substitutes Market Size, by Type & Source, 2021–2035 (USD Billion) |
  50. TABLE 38 UK Meat Substitutes Market Size, by Type & Source, 2021–2035 (USD Billion) |
  51. TABLE 39 India Meat Substitutes Market Size, by Type & Source, 2021–2035 (USD Billion) |
  52. TABLE 40 Brazil Meat Substitutes Market Size, by Type & Source, 2021–2035 (USD Billion) |
  53. TABLE 41 Competitive Benchmarking Matrix – Global Meat Substitutes Market, 2026 |
  54. TABLE 42 Company Profiles – Key Players, Global Meat Substitutes Market |
  55. TABLE 43 Recent Developments & Strategic Announcements, 2024–2026 |
  56. TABLE 44 Report Scope & Methodology Summary |
  57. TABLE 45 Detailed Sources & Citation Register
  58. 13 LIST OF FIGURES |
  59. FIGURE 1 Global Meat Substitutes Market – Market Dynamics Overview |
  60. FIGURE 2 Global Meat Substitutes Market – Industry Value Chain Analysis |
  61. FIGURE 3 Global Meat Substitutes Market – Porter's Five Forces Analysis |
  62. FIGURE 4 Global Meat Substitutes Market Size Trend, 2021–2035 (USD Billion) |
  63. FIGURE 5 Global Meat Substitutes Market – Year-over-Year Growth Curve, 2021–2035 |
  64. FIGURE 6 Market Share by Type, 2025 vs 2035 (%) |
  65. FIGURE 7 Market Share by Source, 2025 vs 2035 (%) |
  66. FIGURE 8 Market Share by Form, 2025 vs 2035 (%) |
  67. FIGURE 9 Market Share by Distribution Channel, 2025 vs 2035 (%) |
  68. FIGURE 10 Regional Market Share, 2025 (%) |
  69. FIGURE 11 Regional Market Share, 2035 (%) |
  70. FIGURE 12 Regional CAGR Comparison, 2026–2035 (%) |
  71. FIGURE 13 North America Country-Level Share, 2025 (%) |
  72. FIGURE 14 Europe Country-Level Share, 2025 (%) |
  73. FIGURE 15 Asia-Pacific Country-Level Share, 2025 (%) |
  74. FIGURE 16 Competitive Landscape – Estimated Revenue Share Bands, 2026 |
  75. FIGURE 17 Competitive Positioning Matrix – Scale vs Clean-Label Orientation |
  76. FIGURE 18 Driver & Restraint Impact Waterfall, 2026–2035

Segmentation Quick Reference

DimensionSub-SegmentsDominant SegmentFastest Growing Segment
By TypeTofu; Tempeh; Textured Vegetable Protein; Seitan; Other Meat SubstitutesTofuSeitan
By SourceSoy; Wheat; Mycoprotein; OthersSoyMycoprotein
By FormFrozen; Refrigerated; Shelf-StableFrozenShelf-Stable
By Distribution ChannelOn-Trade; Off-TradeOff-TradeOn-Trade
By GeographyNorth America; Europe; Asia-Pacific; South America; Middle East & AfricaAsia-PacificMiddle East & Africa


Market Segmentation Overview

By Type

Sub-SegmentKey Trend
TofuStaple consumption in East Asia insulates volume from analog sentiment cycles.
TempehIndonesian production industrialising; export listings expanding in Europe
Textured Vegetable ProteinDemand tracks downstream analog and blended manufacturing volumes.
SeitanBenefits from clean-label positioning as wheat gluten reads as a simple ingredient.
Other Meat SubstitutesMycoprotein and pulse-based entrants gaining shelf at analog expense


Type composition explains most of the divergence between regional performance in the Meat Substitutes Market. Traditional formats held value through the 2023–2025 contraction while branded analogs absorbed the decline, and that pattern is expected to persist until reformulated analog products complete their retail transition.

By Source

Sub-SegmentKey Trend
SoyProcessing infrastructure maturity sustains cost leadership across all formats.
WheatGluten-based inputs favoured where allergen profiles permit and clean-label matters.
MycoproteinWhole-biomass structure answers ultra-processed food objections directly.
OthersPea and pulse isolates positioned for allergen-restricted formulations.


Source selection has become a reformulation decision rather than a cost decision. Producers moving toward shorter ingredient decks are choosing substrates that require fewer downstream additives, which shifts value toward mycoprotein and away from multi-isolate blends.

By Form

Sub-SegmentKey Trend
FrozenRetains foodservice preference on shelf life and portion control
RefrigeratedFresh-aisle positioning supports premium pricing but raises waste exposure.
Shelf-StableUnlocks distribution in markets without reliable cold chain


Format strategy increasingly determines geographic reach. Shelf-stable products carry the growth burden across the Middle East & Africa and parts of South Asia, where refrigerated distribution economics do not yet support fresh-format entry.

By Distribution Channel

Sub-SegmentKey Trend
Off-TradeSupermarket and hypermarket concentration creates delisting exposure.
On-TradeMenu re-entry through add-on and blended positioning rebuilds consumer trial.


Channel balance is the leading indicator worth watching in the Meat Substitutes Market. On-trade recovery generates trial that retail cannot, and brands rebuilding foodservice placement typically see off-trade velocity follow within two to three quarters.




Download PDF ×

We do not share your information with anyone. However, we may send you emails based on your report interest from time to time. You may contact us at any time to opt-out.