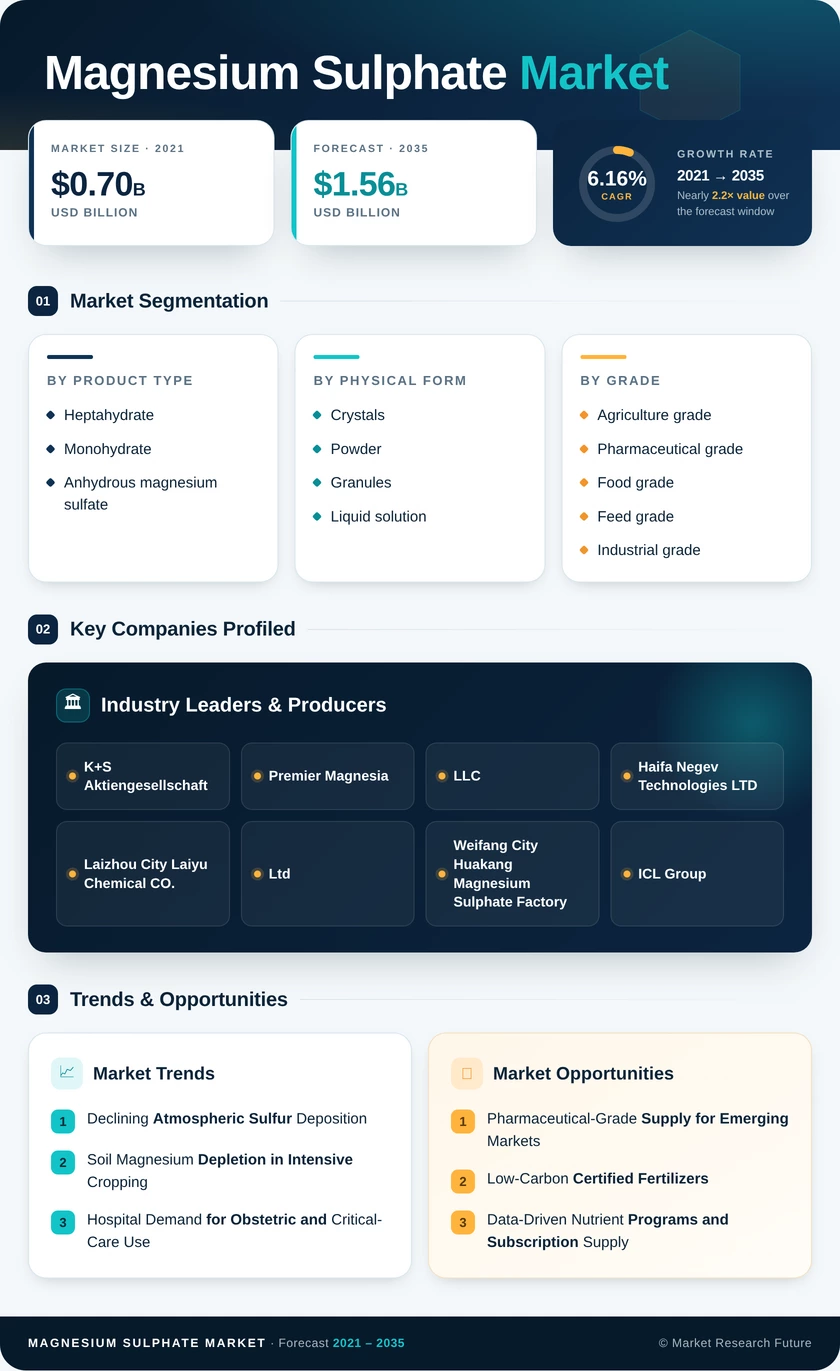
Magnesium Sulphate Market (2026 - 2035)

ID: MRFR/CnM/1675-CR 122 Pages Chitranshi Jaiswal Last Updated: November 18, 2026
Magnesium Sulfate Market Research Report Information By Product Type (Heptahydrate, Monohydrate, and Anhydrous Magnesium Sulfate), By Physical Form (Crystals, Powder, Granules, and Liquid Solution), By Grade (Agriculture Grade, Pharmaceutical Grade, Food Grade, Feed Grade, Industrial Grade, and Consumer Grade), By End-User Industry (Agriculture, Pharmaceutical and Healthcare, Food and Beverage, Personal Care and Cosmetics, Animal Feed, Pulp and Paper, Textile and Leather, Water Treatment, Chemical, and Other End-User Industries), And By Region (North America, Europe, Asia-Pacific, and Rest of the World) – Market Forecast Till 2035.
Magnesium Sulphate Market
Market Size
Forecast Period2026-2035
CAGR (2026-2035)6.16%
2025 Market SizeUSD 0.87 billion
2035 Market SizeUSD 1.56 billion
Key Players
K+S Aktiengesellschaft
Premier Magnesia, LLC
Haifa Negev Technologies LTD
Laizhou City Laiyu Chemical CO., Ltd
Weifang City Huakang Magnesium Sulphate Factory
ICL Group
Opportunities
  • Pharmaceutical-Grade Supply for Emerging Markets
  • Low-Carbon Certified Fertilizers
  • Data-Driven Nutrient Programs and Subscription Supply
  1. 1 Market Summary | |
  2. 2 Key Report Takeaways | |
    1. 2.1 By Product Type | |
    2. 2.2 By Physical Form | |
    3. 2.3 By Grade | |
    4. 2.4 By End-user Industry | |
    5. 2.5 By Region | |
  3. 3 Market Size and Forecast (2021–2035) | |
    1. 3.1 Historical Market Size (2021–2025) | |
    2. 3.2 Forecast Market Size (2026–2035) | |
    3. 3.3 Year-over-Year Growth Analysis | |
  4. 4 Driver Impact Analysis | |
    1. 4.1 Declining Atmospheric Sulfur Deposition | |
    2. 4.2 Soil Magnesium Depletion in Intensive Cropping | |
    3. 4.3 Hospital Demand for Obstetric and Critical-Care Use | |
    4. 4.4 Controlled-Environment Agriculture and Fertigation | |
    5. 4.5 Food Fortification and Consumer Wellness | |
    6. 4.6 EU Fertilising Product Harmonization | |
  5. 5 Restraints Impact Analysis | |
    1. 5.1 Commodity Overcapacity and Price Competition | |
    2. 5.2 Energy and Sulfuric Acid Cost Volatility | |
    3. 5.3 Pharmacopoeial Compliance Costs | |
    4. 5.4 Policy Caps on Chemical Fertilizer Use | |
    5. 5.5 Substitution by Alternative Magnesium Sources | |
  6. 6 Opportunities | |
    1. 6.1 Pharmaceutical-Grade Supply for Emerging Markets | |
    2. 6.2 Low-Carbon Certified Fertilizers | |
    3. 6.3 Data-Driven Nutrient Programs and Subscription Supply | |
    4. 6.4 Liquid Solutions for Vertical Farms and Greenhouses | |
    5. 6.5 Soil-Correction Programs in Sub-Saharan Africa and South Asia | |
  7. 7 Regional Market Share and Country-Level Analysis | |
    1. 7.1 North America | | |
      1. 7.1.1 US | | |
      2. 7.1.2 Canada | | |
      3. 7.1.3 Mexico | |
    2. 7.2 Europe | | |
      1. 7.2.1 Germany | | |
      2. 7.2.2 UK | | |
      3. 7.2.3 France | | |
      4. 7.2.4 Italy | | |
      5. 7.2.5 Spain | | |
      6. 7.2.6 Nordic Countries | | |
      7. 7.2.7 Russia | | |
      8. 7.2.8 Rest of Europe | |
    3. 7.3 Asia-Pacific | | |
      1. 7.3.1 China | | |
      2. 7.3.2 India | | |
      3. 7.3.3 Japan | | |
      4. 7.3.4 South Korea | | |
      5. 7.3.5 ASEAN | | |
      6. 7.3.6 Rest of Asia-Pacific | |
    4. 7.4 South America | | |
      1. 7.4.1 Brazil | | |
      2. 7.4.2 Argentina | | |
      3. 7.4.3 Rest of South America | |
    5. 7.5 Middle East & Africa | | |
      1. 7.5.1 Saudi Arabia | | |
      2. 7.5.2 UAE | | |
      3. 7.5.3 South Africa | | |
      4. 7.5.4 Egypt | | |
      5. 7.5.5 Rest of MEA | |
  8. 8 Future Outlook (2026–2035) | |
    1. 8.1 Precision Nutrient Management and Digital Agronomy | |
    2. 8.2 Resilient Regulated Healthcare Supply Chains | |
    3. 8.3 Decarbonization and ESG Reporting | |
    4. 8.4 Water Efficiency and Controlled-Environment Agriculture | |
  9. 9 Segmentation Analysis | |
    1. 9.1 By Product Type | | |
      1. 9.1.1 Heptahydrate | | |
      2. 9.1.2 Monohydrate | | |
      3. 9.1.3 Anhydrous magnesium sulfate | |
    2. 9.2 By Physical Form | | |
      1. 9.2.1 Crystals | | |
      2. 9.2.2 Powder | | |
      3. 9.2.3 Granules | | |
      4. 9.2.4 Liquid solution | |
    3. 9.3 By Grade | | |
      1. 9.3.1 Agricultural grade | | |
      2. 9.3.2 Pharmaceutical grade | | |
      3. 9.3.3 Food grade | | |
      4. 9.3.4 Feed grade | | |
      5. 9.3.5 Industrial grade | | |
      6. 9.3.6 Consumer grade | |
    4. 9.4 By End-user Industry | | |
      1. 9.4.1 Agriculture | | |
      2. 9.4.2 Pharmaceutical and healthcare | | |
      3. 9.4.3 Food and beverage | | |
      4. 9.4.4 Personal care and cosmetics | | |
      5. 9.4.5 Animal feed | | |
      6. 9.4.6 Pulp and paper | | |
      7. 9.4.7 Textile and leather | | |
      8. 9.4.8 Water treatment | | |
      9. 9.4.9 Chemical | | |
      10. 9.4.10 Other end-user industries | |
  10. 10 Competitive Landscape | |
    1. 10.1 Market Concentration Analysis | |
    2. 10.2 Competitive Benchmarking Matrix | |
    3. 10.3 Company Profiles | | |
      1. 10.3.1 K+S Aktiengesellschaft | | |
      2. 10.3.2 Premier Magnesia, LLC | | |
      3. 10.3.3 Haifa Negev Technologies LTD | | |
      4. 10.3.4 Laizhou City Laiyu Chemical CO., Ltd | | |
      5. 10.3.5 Weifang City Huakang Magnesium Sulphate Factory | | |
      6. 10.3.6 ICL Group | | |
      7. 10.3.7 Merck KGaA | | |
      8. 10.3.8 Jost Chemical Co. | | |
      9. 10.3.9 ACURO ORGANICS LIMITED | | |
      10. 10.3.10 Tomita Pharmaceutical Co., Ltd. | |
  11. 11 Recent News & Developments | |
  12. 12 Report Scope and Methodology | |
  13. 13 Detailed Sources and Citations | |
  14. 14 Frequently Asked Questions (FAQs) | | LIST OF TABLES | |
  15. TABLE 1 Global Market Snapshot, 2025 and 2035 (USD billion) | |
  16. TABLE 2 Global Market Size & Forecast, by Revenue, 2021–2035 (USD billion) | |
  17. TABLE 3 Driver Impact Analysis, 2026–2035 | |
  18. TABLE 4 Restraints Impact Analysis, 2026–2035 | |
  19. TABLE 5 Regional Summary, 2025 | |
  20. TABLE 6 North America, by Country, 2025 | |
  21. TABLE 7 Europe, by Country, 2025 | |
  22. TABLE 8 Asia-Pacific, by Country, 2025 | |
  23. TABLE 9 South America, by Country, 2025 | |
  24. TABLE 10 Middle East & Africa, by Country, 2025 | |
  25. TABLE 11 Global Market, by Product Type, 2025 | |
  26. TABLE 12 Global Market, by Physical Form, 2025 | |
  27. TABLE 13 Global Market, by Grade, 2025 | |
  28. TABLE 14 Global Market, by End-user Industry, 2025 | |
  29. TABLE 15 Competitive Benchmarking Matrix, 2025 | |
  30. TABLE 16 Report Scope and Methodology | |
  31. TABLE 17 Detailed Sources and Citations | |
  32. TABLE 18 Segmentation Quick Reference | |
  33. TABLE 19 Product Type Sub-Segment Trends | |
  34. TABLE 20 Physical Form Sub-Segment Trends | |
  35. TABLE 21 Grade Sub-Segment Trends | |
  36. TABLE 22 End-user Industry Sub-Segment Trends | | LIST OF FIGURES | |
  37. FIGURE 1 Market Dynamics Overview — Drivers, Restraints and Opportunities | |
  38. FIGURE 2 Industry Value Chain Analysis | |
  39. FIGURE 3 Porter's Five Forces Analysis | |
  40. FIGURE 4 Global Market Size Trend, 2021–2035 (USD billion) | |
  41. FIGURE 5 Year-over-Year Growth, 2021–2035 (%) | |
  42. FIGURE 6 Market Share by Product Type, 2025 (%) | |
  43. FIGURE 7 Market Share by Physical Form, 2025 (%) | |
  44. FIGURE 8 Market Share by Grade, 2025 (%) | |
  45. FIGURE 9 Market Share by End-user Industry, 2025 (%) | |
  46. FIGURE 10 Regional Market Share, 2025 (%) | |
  47. FIGURE 11 Country-Level Opportunity Map, 2026–2035 | |
  48. FIGURE 12 Competitive Landscape — Revenue Share Ranges, 2025

Segmentation Quick Reference

DimensionSub-SegmentsDominant SegmentFastest Growing Segment
By Product TypeHeptahydrate; Monohydrate; Anhydrous magnesium sulfateHeptahydrate (53.2% share)Anhydrous magnesium sulfate (6.8% CAGR)
By Physical FormCrystals; Powder; Granules; Liquid solutionPowder (41.0% share)Liquid solution (7.1% CAGR)
By GradeAgriculture grade; Pharmaceutical grade; Food grade; Feed grade; Industrial grade; Consumer gradeAgriculture grade (44.6% share)Pharmaceutical grade (7.5% CAGR)
By End-user IndustryAgriculture; Pharmaceutical and healthcare; Food and beverage; Personal care and cosmetics; Animal feed; Pulp and paper; Textile and leather; Water treatment; Chemical; Other end-user industriesAgriculture (46.6% share)Pharmaceutical and healthcare (7.7% CAGR)
By RegionNorth America; Europe; Asia-Pacific; South America; Middle East & AfricaAsia-Pacific (47.5% share)Asia-Pacific (47.5% share)

Market Segmentation Overview

The trends below summarize each segmentation dimension, consistent with Section 9.

By Product Type

Sub-SegmentKey Trend
HeptahydrateReference Epsom salt form for specifications and multi-industry supply
MonohydrateKieserite with higher nutrient density for soil-applied programs
Anhydrous magnesium sulfateRising use as desiccant and solid-dose excipient

Heptahydrate leads with a 53.2% share because one stable, fully soluble crystal serves fertilizer, pharmaceutical and bath-product buyers alike. Monohydrate holds its position through German kieserite resources and better freight economics per unit of nutrient. Anhydrous magnesium sulfate grows fastest at a 6.8% CAGR, as tablet makers and desiccant users pay for tight moisture and heavy-metal specifications.

By Physical Form

Sub-SegmentKey Trend
CrystalsRetail bath, personal care and food-grade packaging
PowderDefault form for stock-tank fertigation and compounding
GranulesMechanized spreading and compound-fertilizer blending.
Liquid solutionReady-to-dose concentrates for recirculating greenhouses

Powder leads with a 41.0% share because growers and compounders dissolve it quickly into stock solutions with no special equipment. Granules remain essential for field spreaders that need uniform particle size. Liquid solution grows fastest at a 7.1% CAGR, since closed-loop greenhouse operators prefer injector-ready concentrates that avoid precipitation and labor in stock preparation.

By Grade

Sub-SegmentKey Trend
Agriculture gradeCommodity volume with thin margins and Chinese overcapacity
Pharmaceutical gradePharmacopoeia-restricted supply with premium pricing
Food gradeGRAS and INS 518 approvals supporting fortification
Feed gradeMineral premix demand in livestock and aquaculture
Industrial gradeTextile, pulp and water treatment baseload
Consumer gradeBath salts and wellness retail growth

Agriculture grade leads with a 44.6% share of fertilizer volume, but its loose specifications expose producers to price competition. Pharmaceutical grade grows fastest at a 7.5% CAGR because USP, BP and Ph. Eur. compliance limits the number of qualified suppliers. Food grade and consumer grade sit between the two, earning modest premiums for documented purity.

By End-user Industry

Sub-SegmentKey Trend
AgricultureMagnesium and sulfur correction on depleted soils
Pharmaceutical and healthcareObstetric, cardiac and electrolyte therapy demand
Food and beverageTofu coagulation, brewing and fortified drinks
Personal care and cosmeticsBath salts and skincare formulations
Animal feedRuminant and aquaculture mineral supplementation
Pulp and paperBleaching-stage stabilization
Textile and leatherDyeing and tanning auxiliaries
Water treatmentIndustrial water conditioning
ChemicalFeedstock for other magnesium compounds
Other end-user industriesConstruction and specialty niches

Agriculture leads with a 46.6% share, driven by chlorophyll and protein needs on soils that receive less atmospheric sulfur than before. Pharmaceutical and healthcare grows fastest at a 7.7% CAGR as essential-medicine procurement and pre-eclampsia protocols expand hospital use. Food and beverage and personal care and cosmetics provide steadier, premium-priced demand that cushions agricultural seasonality.


Download PDF ×

We do not share your information with anyone. However, we may send you emails based on your report interest from time to time. You may contact us at any time to opt-out.