Magnesium Metal Market (2026 - 2035)

ID: MRFR/CnM/1445-HCR 111 Pages Chitranshi Jaiswal Last Updated: October 12, 2026
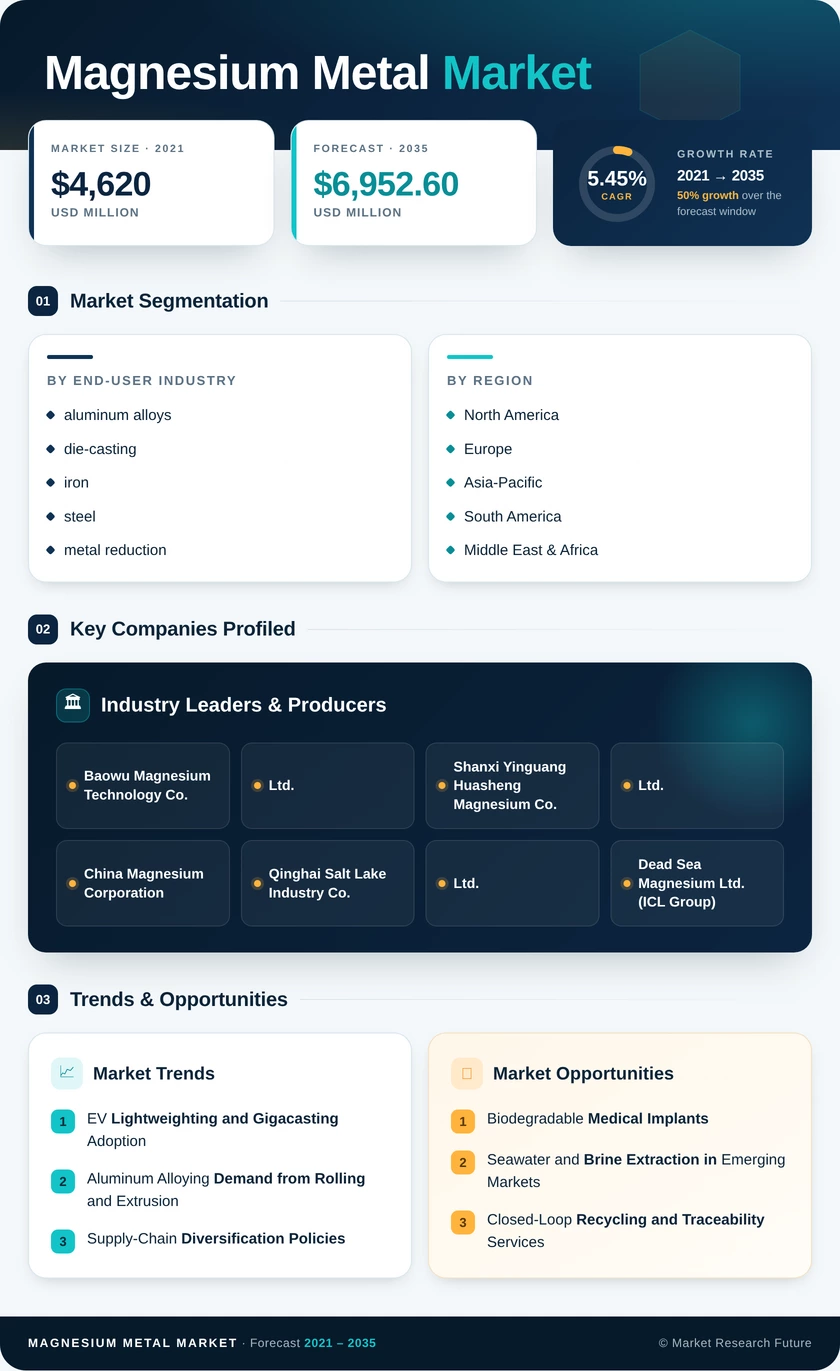
Magnesium Metal Market Research Report Information By End-user Industry (aluminum alloys, die-casting, iron and steel, metal reduction, and Other end-user industries) – Forecast Till 2035.
Magnesium Metal Market
Market Size
Forecast Period2026-2035
CAGR (2026-2035)5.45%
2025 Market SizeUSD 4,085.0 Million
2035 Market SizeUSD 6,952.6 Million
Key Players
Baowu Magnesium Technology Co., Ltd.
Shanxi Yinguang Huasheng Magnesium Co., Ltd.
China Magnesium Corporation
Qinghai Salt Lake Industry Co., Ltd.
Dead Sea Magnesium Ltd.
RIMA Industrial S.A.
Opportunities
  • Biodegradable Medical Implants
  • Seawater and Brine Extraction in Emerging Markets
  • Closed-Loop Recycling and Traceability Services
  1. 1 Market Summary | |
    1. 1.1 Market Definition & Study Assumptions | |
    2. 1.2 Technology Transformation Overview | |
    3. 1.3 Regional Hierarchy Overview | |
  2. 2 Key Report Takeaways | |
    1. 2.1 By End-user Industry | |
    2. 2.2 By Region | |
  3. 3 Market Size and Forecast (2021–2035) | |
    1. 3.1 Historical Market Size (2021–2025) | |
    2. 3.2 Forecast Market Size (2026–2035) | |
    3. 3.3 Year-over-Year Growth Analysis | |
  4. 4 Driver Impact Analysis | |
    1. 4.1 EV Lightweighting and Gigacasting Adoption | |
    2. 4.2 Aluminum Alloying Demand from Rolling and Extrusion | |
    3. 4.3 Supply-Chain Diversification Policies | |
    4. 4.4 Titanium Sponge Reduction for Aircraft and Defense | |
    5. 4.5 Low-Carbon Extraction Technology Scale-Up | |
    6. 4.6 Steel Desulfurization Tied to India's Capacity Build-Out | |
  5. 5 Restraints Impact Analysis | |
    1. 5.1 Supply Concentration and Price Volatility | |
    2. 5.2 Carbon Intensity of the Pidgeon Route | |
    3. 5.3 Corrosion and Substitution Pressure | |
    4. 5.4 Trade Duties on Chinese Ingot | |
    5. 5.5 Energy and Ferrosilicon Input Volatility | |
  6. 6 Opportunities | |
    1. 6.1 Biodegradable Medical Implants | |
    2. 6.2 Seawater and Brine Extraction in Emerging Markets | |
    3. 6.3 Closed-Loop Recycling and Traceability Services | |
    4. 6.4 Solid-State Hydrogen Storage | |
    5. 6.5 India's Domestic Supply Gap | |
  7. 7 Regional Market Share and Country-Level Analysis | |
    1. 7.1 North America | | |
      1. 7.1.1 US | | |
      2. 7.1.2 Canada | | |
      3. 7.1.3 Mexico | |
    2. 7.2 Europe | | |
      1. 7.2.1 Germany | | |
      2. 7.2.2 UK | | |
      3. 7.2.3 France | | |
      4. 7.2.4 Italy | | |
      5. 7.2.5 Spain | | |
      6. 7.2.6 Nordic Countries | | |
      7. 7.2.7 Russia | | |
      8. 7.2.8 Rest of Europe | |
    3. 7.3 Asia-Pacific | | |
      1. 7.3.1 China | | |
      2. 7.3.2 India | | |
      3. 7.3.3 Japan | | |
      4. 7.3.4 South Korea | | |
      5. 7.3.5 ASEAN | | |
      6. 7.3.6 Rest of Asia-Pacific | |
    4. 7.4 South America | | |
      1. 7.4.1 Brazil | | |
      2. 7.4.2 Argentina | | |
      3. 7.4.3 Rest of South America | |
    5. 7.5 Middle East & Africa | | |
      1. 7.5.1 Saudi Arabia | | |
      2. 7.5.2 UAE | | |
      3. 7.5.3 South Africa | | |
      4. 7.5.4 Egypt | | |
      5. 7.5.5 Rest of MEA | |
  8. 8 Future Outlook (2026–2035) | |
    1. 8.1 Gigacasting and EV Platform Consolidation | |
    2. 8.2 Decarbonized Smelting and Scope 3 Disclosure | |
    3. 8.3 Geographic Rebalancing of Supply | |
    4. 8.4 Automation and Digital Traceability | |
  9. 9 Segmentation Analysis | |
    1. 9.1 By End-user Industry | | |
      1. 9.1.1 aluminum alloys | | |
      2. 9.1.2 die-casting | | |
      3. 9.1.3 iron and steel | | |
      4. 9.1.4 metal reduction | | |
      5. 9.1.5 other end-user industries | |
    2. 9.2 By Production Process | | |
      1. 9.2.1 Thermal Pidgeon | | |
      2. 9.2.2 Electrolytic | | |
      3. 9.2.3 Secondary/Recycled | | |
      4. 9.2.4 Seawater Electro-extraction | |
  10. 10 Competitive Landscape | |
    1. 10.1 Market Concentration Analysis | |
    2. 10.2 Competitive Benchmarking Matrix | |
    3. 10.3 Company Profiles | | |
      1. 10.3.1 Baowu Magnesium Technology Co., Ltd. | | |
      2. 10.3.2 Shanxi Yinguang Huasheng Magnesium Co., Ltd. | | |
      3. 10.3.3 China Magnesium Corporation | | |
      4. 10.3.4 Qinghai Salt Lake Industry Co., Ltd. | | |
      5. 10.3.5 Dead Sea Magnesium Ltd. (ICL Group) | | |
      6. 10.3.6 RIMA Industrial S.A. | | |
      7. 10.3.7 Solikamsk Magnesium Works | | |
      8. 10.3.8 US Magnesium LLC | | |
      9. 10.3.9 Latrobe Magnesium Ltd. | | |
      10. 10.3.10 Magrathea Metals Inc. | |
  11. 11 Recent News & Developments | |
  12. 12 Report Scope and Methodology | |
  13. 13 Detailed Sources and Citations | |
  14. 14 Frequently Asked Questions (FAQs) | | LIST OF TABLES | |
  15. TABLE 1 Global Market Snapshot — Key Metrics, 2025–2035 | |
  16. TABLE 2 Global Market Size & Forecast, by Value (USD Million), 2021–2035 | |
  17. TABLE 3 Driver Impact Analysis, 2026–2035 | |
  18. TABLE 4 Restraints Impact Analysis, 2026–2035 | |
  19. TABLE 5 Regional Summary, by Region, 2025 | |
  20. TABLE 6 North America Market, by Country, 2025–2035 | |
  21. TABLE 7 Europe Market, by Country, 2025–2035 | |
  22. TABLE 8 Asia-Pacific Market, by Country, 2025–2035 | |
  23. TABLE 9 South America Market, by Country, 2025–2035 | |
  24. TABLE 10 Middle East & Africa Market, by Country, 2025–2035 | |
  25. TABLE 11 Global Market, by End-user Industry, 2025–2035 (USD Million) | |
  26. TABLE 12 Competitive Benchmarking Matrix, 2025 | |
  27. TABLE 13 Report Scope and Methodology | |
  28. TABLE 14 Detailed Sources and Citations | | LIST OF FIGURES | |
  29. FIGURE 1 Market Dynamics Overview — Drivers, Restraints, Opportunities | |
  30. FIGURE 2 Industry Value Chain — Dolomite and Brine to End-Use | |
  31. FIGURE 3 Porter's Five Forces Analysis | |
  32. FIGURE 4 Global Market Size Trend, 2021–2035 (USD Million) | |
  33. FIGURE 5 Year-over-Year Growth Rate, 2022–2035 | |
  34. FIGURE 6 Market Share, by End-user Industry, 2025 | |
  35. FIGURE 7 Market Share, by Region, 2025 | |
  36. FIGURE 8 Regional CAGR Comparison, 2026–2035 | |
  37. FIGURE 9 Country-Level Share within Asia-Pacific, 2025 | |
  38. FIGURE 10 Competitive Landscape — Estimated Revenue Share Ranges, 2025

Segmentation Quick Reference

DimensionSub-SegmentsDominant SegmentFastest Growing Segment
By End-user Industryaluminum alloys, die-casting, iron and steel, metal reduction, other end-user industriesaluminum alloys (48.5% share)die-casting (6.71% CAGR)
By RegionNorth America, Europe, Asia-Pacific, South America, Middle East & AfricaAsia-Pacific (51.2% share)Asia-Pacific (6.38% CAGR)


Market Segmentation Overview

By End-user Industry

Sub-SegmentKey Trend
aluminum alloysRising magnesium content in 6xxx EV extrusions and 5xxx can sheet
die-castingStructural EV castings and thin-wall electronics housings
iron and steelDesulfurization demand tied to India's blast-furnace build-out
metal reductionKroll titanium sponge expansion for aircraft and defense programs
other end-user industriesBiodegradable implants, pharmaceuticals, and hydrogen storage pilots


Aluminum alloys lead this dimension because rolling mills cannot make can-lid or structural sheet without magnesium, which keeps their consumption steady regardless of price. Die-casting grows fastest as automakers shift to large single-piece castings and lightweight interior beams, demand that iron and steel desulfurization cannot match. For the Magnesium Metal Market, die-casting will therefore drive incremental tonnage, while metal reduction and other end-user industries contribute higher value per ton.


Download PDF ×

We do not share your information with anyone. However, we may send you emails based on your report interest from time to time. You may contact us at any time to opt-out.