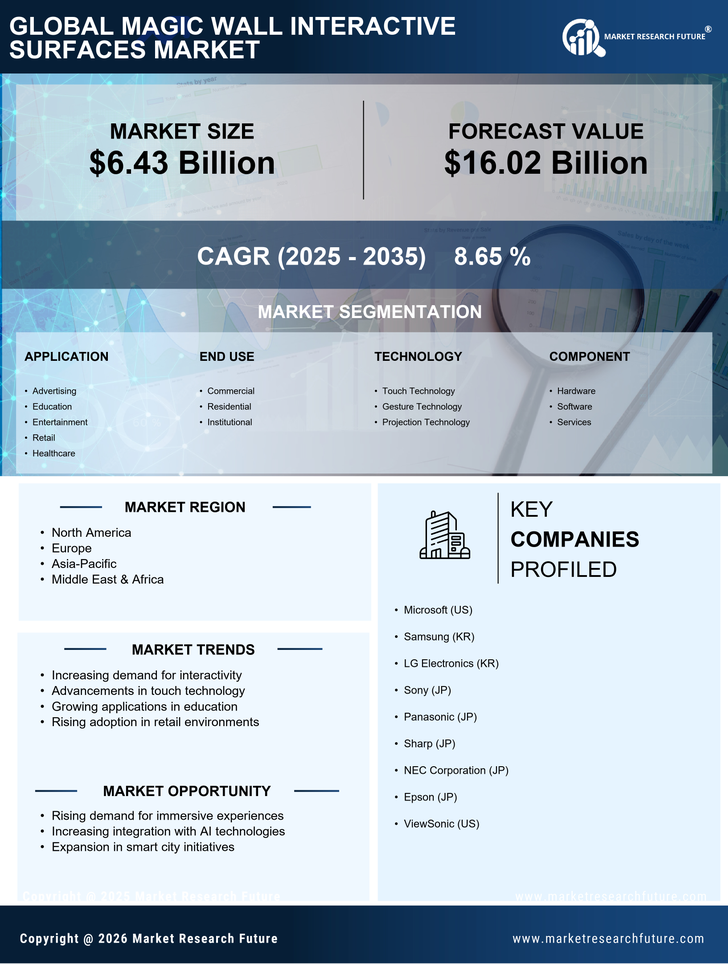
Certified Global Research Member
Isomar fd.webp Wcrc 57.webp
Key Questions Answered
  • Global Market Outlook
  • In-depth analysis of global and regional trends
  • Analyze and identify the major players in the market, their market share, key developments, etc.
  • To understand the capability of the major players based on products offered, financials, and strategies.
  • Identify disrupting products, companies, and trends.
  • To identify opportunities in the market.
  • Analyze the key challenges in the market.
  • Analyze the regional penetration of players, products, and services in the market.
  • Comparison of major playersโ€™ financial performance.
  • Evaluate strategies adopted by major players.
  • Recommendations
Why Choose Market Research Future?
  • Vigorous research methodologies for specific market.
  • Knowledge partners across the globe
  • Large network of partner consultants.
  • Ever-increasing/ Escalating data base with quarterly monitoring of various markets
  • Trusted by fortune 500 companies/startups/ universities/organizations
  • Large database of 5000+ markets reports.
  • Effective and prompt pre- and post-sales support.

Magic Wall Interactive Surfaces Market Research Report, by Components (Cameras, Emitting Devices, Displays), by Application (Architecture, Home Entertainment, Digital Signage, Healthcare), End-User (Entertainment, Analytics) - Global Forecast till 2032


ID: MRFR/ICT/0606-HCR | 110 Pages | Author: Aarti Dhapte| April 2024
Leading companies partner with us for data-driven Insights
client_1 client_2 client_3 client_4 client_5 client_6 client_7 client_8 client_9 client_10
Please fill in Business Email for Quick Response

TABLE OF CONTENTS

1 Executive Summary

2 Scope of the Report

2.1 Market Definition

2.2 Scope of the Study

2.2.1 Research Objectives

2.2.2 Assumptions & Limitations

2.3 Markets Structure

3 Market Research Methodology

3.1 Research Process

3.2 Secondary Research

3.3 Primary Research

3.4 Forecast Model

4 Market Landscape

4.1 Porterโ€™s Five Forces Analysis

4.1.1 Threat of New Entrants

4.1.2 Bargaining power of buyers

4.1.3 Threat of substitutes

4.1.4 Segment Rivalry

4.1.5 Bargaining Power of Suppliers

4.2 Value Chain/Supply Chain of Magic Wall Interactive Surfaces

5 Market Landscape

5.1 Introduction

5.2 Growth Drivers

5.3 Impact Analysis

5.4 Market Challenges

6 Market Trends

6.1 Introduction

6.2 Growth Trends

6.3 Impact Analysis

7 Magic Wall Interactive Surfaces Market by Components

7.1 Introduction

7.2 Hardware

7.2.1 Camera

7.2.1.1 Market Estimates & Forecast, 2020โ€“2027

7.2.1.2 Market Estimates & Forecast by Region, 2020โ€“2027

7.2.2 Emitting devices

7.2.2.1 Market Estimates & Forecast, 2020โ€“2027

7.2.2.2 Market Estimates & Forecast by Region, 2020โ€“2027

7.2.3 Display

7.2.3.1 Market Estimates & Forecast, 2020โ€“2027

7.2.3.2 Market Estimates & Forecast by Region, 2020โ€“2027

7.2.4 Processing unit

7.2.4.1 Market Estimates & Forecast, 2020โ€“2027

7.2.4.2 Market Estimates & Forecast by Region, 2020โ€“2027

7.2.5 Others

7.2.5.1 Market Estimates & Forecast, 2020โ€“2027

7.2.5.2 Market Estimates & Forecast by Region, 2020โ€“2027

7.3 Software

7.3.1 Market Estimates & Forecast, 2020โ€“2027

7.3.2 Market Estimates & Forecast by Region, 2020โ€“2027

8 Magic Wall Interactive Surfaces Market by Application

8.1 Introduction

8.2 Architecture

8.2.1 Event Design

8.2.1.1 Market Estimates & Forecast, 2020โ€“2027

8.2.1.2 Market Estimates & Forecast by Region, 2020โ€“2027

8.2.2 Interior Design

8.2.2.1 Market Estimates & Forecast, 2020โ€“2027

8.2.2.2 Market Estimates & Forecast by Region, 2020โ€“2027

8.3 Home Entertainment

8.3.1 Market Estimates & Forecast, 2020โ€“2027

8.3.2 Market Estimates & Forecast by Region, 2020โ€“2027

8.4 Advertising

8.4.1 Market Estimates & Forecast, 2020โ€“2027

8.4.2 Market Estimates & Forecast by Region, 2020โ€“2027

8.5 Digital Signage

8.5.1 Market Estimates & Forecast, 2020โ€“2027

8.5.2 Market Estimates & Forecast by Region, 2020โ€“2027

8.6 Healthcare

8.6.1 Market Estimates & Forecast, 2020โ€“2027

8.6.2 Market Estimates & Forecast by Region, 2020โ€“2027

8.7 Education

8.7.1 Market Estimates & Forecast, 2020โ€“2027

8.7.2 Market Estimates & Forecast by Region, 2020โ€“2027

8.8 Corporate

8.8.1 Market Estimates & Forecast, 2020โ€“2027

8.8.2 Market Estimates & Forecast by Region, 2020โ€“2027

8.9 Others

8.9.1 Market Estimates & Forecast, 2020โ€“2027

8.9.2 Market Estimates & Forecast by Region, 2020โ€“2027

9 Magic Wall Interactive Surfaces Market by End Users

9.1 Introduction

9.2 Entertainment

9.2.1 Market Estimates & Forecast, 2020โ€“2027

9.2.2 Market Estimates & Forecast by Region, 2020โ€“2027

9.3 Healthcare

9.3.1 Market Estimates & Forecast, 2020โ€“2027

9.3.2 Market Estimates & Forecast by Region, 2020โ€“2027

9.4 Analytics

9.4.1 Market Estimates & Forecast, 2020โ€“2027

9.4.2 Market Estimates & Forecast by Region, 2020โ€“2027

9.5 Others

9.5.1 Market Estimates & Forecast, 2020โ€“2027

9.5.2 Market Estimates & Forecast by Region, 2020โ€“2027

10 Magic Wall Interactive Surfaces Market by Region

10.1 Introduction

10.2 North America

10.2.1 Market Estimates & Forecast by Country, 2020โ€“2027

10.2.2 Market Estimates & Forecast by Component, 2020โ€“2027

10.2.3 Market Estimates & Forecast by Application, 2020โ€“2027

10.2.4 Market Estimates & Forecast by End User, 2020โ€“2027

10.2.5 US

10.2.5.1 Market Estimates & Forecast by Component, 2020โ€“2027

10.2.5.2 Market Estimates & Forecast by Application, 2020โ€“2027

10.2.5.3 Market Estimates & Forecast by End User, 2020โ€“2027

10.2.6 Mexico

10.2.6.1 Market Estimates & Forecast by Component, 2020โ€“2027

10.2.6.2 Market Estimates & Forecast by Application, 2020โ€“2027

10.2.6.3 Market Estimates & Forecast by End User, 2020โ€“2027

10.2.7 Canada

10.2.7.1 Market Estimates & Forecast by Component, 2020โ€“2027

10.2.7.2 Market Estimates & Forecast by Application, 2020โ€“2027

10.2.7.3 Market Estimates & Forecast by End User, 2020โ€“2027

10.3 Europe

10.3.1 Market Estimates & Forecast by Country, 2020โ€“2027

10.3.2 Market Estimates & Forecast by Component, 2020โ€“2027

10.3.3 Market Estimates & Forecast by Application, 2020โ€“2027

10.3.4 Market Estimates & Forecast by End User, 2020โ€“2027

10.3.5 Germany

10.3.5.1 Market Estimates & Forecast by Component, 2020โ€“2027

10.3.5.2 Market Estimates & Forecast by Application, 2020โ€“2027

10.3.5.3 Market Estimates & Forecast by End User, 2020โ€“2027

10.3.6 France

10.3.6.1 Market Estimates & Forecast by Component, 2020โ€“2027

10.3.6.2 Market Estimates & Forecast by Application, 2020โ€“2027

10.3.6.3 Market Estimates & Forecast by End User, 2020โ€“2027

10.3.7 Italy

10.3.7.1 Market Estimates & Forecast by Component, 2020โ€“2027

10.3.7.2 Market Estimates & Forecast by Application, 2020โ€“2027

10.3.7.3 Market Estimates & Forecast by End User, 2020โ€“2027

10.3.8 Spain

10.3.8.1 Market Estimates & Forecast by Component, 2020โ€“2027

10.3.8.2 Market Estimates & Forecast by Application, 2020โ€“2027

10.3.8.3 Market Estimates & Forecast by End User, 2020โ€“2027

10.3.9 UK

10.3.9.1 Market Estimates & Forecast by Component, 2020โ€“2027

10.3.9.2 Market Estimates & Forecast by Application, 2020โ€“2027

10.3.9.3 Market Estimates & Forecast by End User, 2020โ€“2027

10.4 Asia-Pacific

10.4.1 Market Estimates & Forecast by Country, 2020โ€“2027

10.4.2 Market Estimates & Forecast by Component, 2020โ€“2027

10.4.3 Market Estimates & Forecast by Application, 2020โ€“2027

10.4.4 Market Estimates & Forecast by End User, 2020โ€“2027

10.4.5 China

10.4.5.1 Market Estimates & Forecast by Component, 2020โ€“2027

10.4.5.2 Market Estimates & Forecast by Application, 2020โ€“2027

10.4.5.3 Market Estimates & Forecast by End User, 2020โ€“2027

10.4.6 India

10.4.6.1 Market Estimates & Forecast by Component, 2020โ€“2027

10.4.6.2 Market Estimates & Forecast by Application, 2020โ€“2027

10.4.6.3 Market Estimates & Forecast by End User, 2020โ€“2027

10.4.7 Japan

10.4.7.1 Market Estimates & Forecast by Component, 2020โ€“2027

10.4.7.2 Market Estimates & Forecast by Application, 2020โ€“2027

10.4.7.3 Market Estimates & Forecast by End User, 2020โ€“2027

10.4.8 Rest of Asia-Pacific

10.4.8.1 Market Estimates & Forecast by Component, 2020โ€“2027

10.4.8.2 Market Estimates & Forecast by Application, 2020โ€“2027

10.4.8.3 Market Estimates & Forecast by End User, 2020โ€“2027

10.5 Rest of the World

10.5.1 Market Estimates & Forecast by Country, 2020โ€“2027

10.5.2 Market Estimates & Forecast by Component, 2020โ€“2027

10.5.3 Market Estimates & Forecast by Application, 2020โ€“2027

10.5.4 Market Estimates & Forecast by End User, 2020โ€“2027

10.5.5 Middle East & Africa

10.5.5.1 Market Estimates & Forecast by Component, 2020โ€“2027

10.5.5.2 Market Estimates & Forecast by Application, 2020โ€“2027

10.5.5.3 Market Estimates & Forecast by End User, 2020โ€“2027

10.5.6 Latin America

10.5.6.1 Market Estimates & Forecast by Component, 2020โ€“2027

10.5.6.2 Market Estimates & Forecast by Application, 2020โ€“2027

10.5.6.3 Market Estimates & Forecast by End User, 2020โ€“2027

11 Competitive Landscape

12 Company Profiles

12.1 Ubi Interactive

12.1.1 Company Overview

12.1.2 Product/Business Segment Overview

12.1.3 Financial Updates

12.1.4 Key Developments

12.2 Touch Magix

12.2.1 Company Overview

12.2.2 Product/Business Segment Overview

12.2.3 Financial Updates

12.2.4 Key Developments

12.3 Vertigo

12.3.1 Company Overview

12.3.2 Product/Business Segment Overview

12.3.3 Financial Updates

12.3.4 Key Developments

12.4 Reactrix Inc.

12.4.1 Company Overview

12.4.2 Product/Business Segment Overview

12.4.3 Financial Updates

12.4.4 Key Developments

12.5 Sony Corporation

12.5.1 Company Overview

12.5.2 Product/Business Segment Overview

12.5.3 Financial Updates

12.5.4 Key Developments

12.6 WSI

12.6.1 Company Overview

12.6.2 Product/Business Segment Overview

12.6.3 Financial Updates

12.6.4 Key Developments

12.7 Microsoft Corporation

12.7.1 Company Overview

12.7.2 Product/Business Segment Overview

12.7.3 Financial Updates

12.7.4 Key Developments

12.8 Planar systems

12.8.1 Company Overview

12.8.2 Product/Business Segment Overview

12.8.3 Financial Updates

12.8.4 Key Developments

12.9 GestureTek

12.9.1 Company Overview

12.9.2 Product/Business Segment Overview

12.9.3 Financial Updates

12.9.4 Key Developments

12.10 Envision Group

12.10.1 Company Overview

12.10.2 Product/Business Segment Overview

12.10.3 Financial Updates

12.10.4 Key Developments

13 Conclusion

LIST OF TABLES

Table 1 Magic Wall Interactive Surfaces Market: By Region, 2020โ€“2027

Table 2 North America Magic Wall Interactive Surfaces Market: By Country, 2020โ€“2027

Table 3 Europe Magic Wall Interactive Surfaces Market: By Country, 2020โ€“2027

Table 4 Asia Pacific Magic Wall Interactive Surfaces Market: By Country, 2020โ€“2027

Table 5 The Middle East & Africa Magic Wall Interactive Surfaces Market: By Country, 2020โ€“2027

Table 6 Latin America Magic Wall Interactive Surfaces Market: By Country, 2020โ€“2027

Table 7 Global Magic Wall Interactive Surfaces by Component Market: By Regions, 2020โ€“2027

Table 8 North America Magic Wall Interactive Surfaces by Component Market: By Country, 2020โ€“2027

Table 9 Europe Magic Wall Interactive Surfaces by Component Market: By Country, 2020โ€“2027

Table10 Asia Pacific Magic Wall Interactive Surfaces by Component Market: By Country, 2020โ€“2027

Table11 The Middle East & Africa Magic Wall Interactive Surfaces by Component Market: By Country, 2020โ€“2027

Table12 Latin America Magic Wall Interactive Surfaces by Component Market: By Country, 2020โ€“2027

Table13 Global Magic Wall Interactive Surfaces by Application Market: By Regions, 2020โ€“2027

Table14 North America Magic Wall Interactive Surfaces by Application Market: By Country, 2020โ€“2027

Table15 Europe Magic Wall Interactive Surfaces by Application Market: By Country, 2020โ€“2027

Table16 Asia Pacific: Magic Wall Interactive Surfaces by Application Market: By Country, 2020โ€“2027

Table17 The Middle East & Africa Magic Wall Interactive Surfaces by Application Market: By Country, 2020โ€“2027

Table18 Latin America Magic Wall Interactive Surfaces by Application Market: By Country, 2020โ€“2027

Table20 Global Services Market: By Region, 2020โ€“2027

Table21 North America: Magic Wall Interactive Surfaces Market, By Country

Table22 North America: Magic Wall Interactive Surfaces Market, By Component

Table23 North America: Magic Wall Interactive Surfaces Market, By Application

Table24 Europe: Magic Wall Interactive Surfaces Market, By Country

Table25 Europe: Magic Wall Interactive Surfaces Market, By Component

Table26 Europe: Magic Wall Interactive Surfaces Market, By Application

LIST OF FIGURES

FIGURE 1 Global Magic Wall Interactive Surfaces Market Segmentation

FIGURE 2 Forecast Methodology

FIGURE 3 Porterโ€™s Five Forces Analysis of Global Magic Wall Interactive Surfaces Market

FIGURE 4 Value Chain of Global Magic Wall Interactive Surfaces Market

FIGURE 5 Share of Magic Wall Interactive Surfaces Market in 2020, by country (in %)

FIGURE 6 Global Magic Wall Interactive Surfaces Market size by Component, 2020

FIGURE 7 Share of Global Magic Wall Interactive Surfaces Market by Component, 2020 TO 2027

FIGURE 8 Global Magic Wall Interactive Surfaces Market size by Application, 2020

FIGURE 9 Share of Global Magic Wall Interactive Surfaces Market by Application, 2020 TO 2027

FIGURE 10 Global Magic Wall Interactive Surfaces Market size by End User, 2020

FIGURE 11 Share of Global Magic Wall Interactive Surfaces Market by End User, 2020 TO 2027

Purchase Option
Single User $ 4,950
Multiuser License $ 5,950
Enterprise User $ 7,250
Compare Licenses
Tailored for You
  • Dedicated Research on any specifics segment or region.
  • Focused Research on specific players in the market.
  • Custom Report based only on your requirements.
  • Flexibility to add or subtract any chapter in the study.
  • Historic data from 2014 and forecasts outlook till 2040.
  • Flexibility of providing data/insights in formats (PDF, PPT, Excel).
  • Provide cross segmentation in applicable scenario/markets.