Machine Safety Market (2025 - 2035)

ID: MRFR/SEM/4775-CR
128 Pages
Ankit Gupta
Last Updated: July 13, 2026
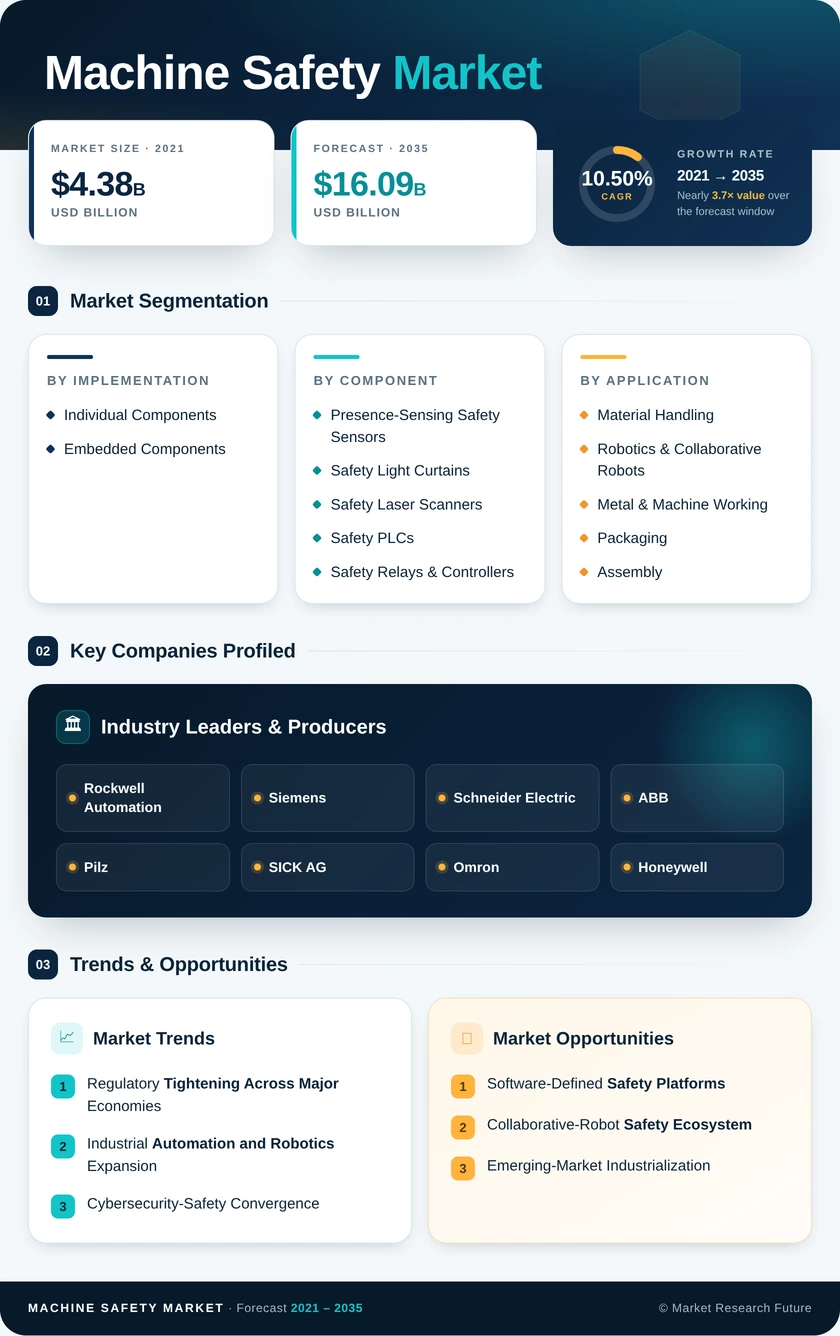
Machine Safety Market Size, Share and Research Report By Implementation (Individual Components, Embedded Components), By Component (Presence-Sensing Safety Sensors, Safety Light Curtains, Safety Laser Scanners, Safety PLCs, Safety Relays & Controllers, Safety Interlock Switches), By Application (Material Handling, Robotics & Collaborative Robots, Metal & Machine Working, Packaging, Assembly), By End-Use Industry (Automotive, Food & Beverage, Pharmaceuticals & Healthcare, Electronics & Semiconductor, Oil & Gas) and By Regional (North America, Europe, South America, Asia Pacific, Middle East and Africa) - Industry Forecast to 2035.
Machine Safety Market
Market Size
Forecast Period2025-2035
CAGR (2025-2035)10.50%
2025 Market SizeUSD 5.97 Billion
2035 Market SizeUSD 16.09 Billion
Key Players
Rockwell Automation
Siemens
Schneider Electric
ABB
Pilz
SICK AG
Opportunities
  • Software-Defined Safety Platforms
  • Collaborative-Robot Safety Ecosystem
  • Emerging-Market Industrialization
  1. 1 Market Overview |
    1. 1.1 Study Assumptions & Market Definition |
    2. 1.2 Scope of the Study |
    3. 1.3 Research Methodology
  2. 2 Market Summary & Key Takeaways
  3. 3 Market Dynamics |
    1. 3.1 Market Drivers Analysis | |
      1. 3.1.1 Regulatory Tightening Across Major Economies | |
      2. 3.1.2 Industrial Automation and Robotics Expansion | |
      3. 3.1.3 Cybersecurity-Safety Convergence | |
      4. 3.1.4 Industry
    2. 4.0 Digital Retrofit Programs | |
      1. 3.1.5 Collaborative-Robot Safety Requirements | |
      2. 3.1.6 Predictive-Maintenance Integration | |
      3. 3.1.7 Insurance and Liability Incentive Structures |
    3. 3.2 Market Restraints Analysis | |
      1. 3.2.1 High Upfront Cost of Certified Safety Components | |
      2. 3.2.2 Fragmented Global Standards Landscape | |
      3. 3.2.3 Functional-Safety Talent Shortage | |
      4. 3.2.4 Legacy System Integration Complexity | |
      5. 3.2.5 SME Resistance to Compliance Investment |
    4. 3.3 Market Opportunity Analysis | |
      1. 3.3.1 Software-Defined Safety Platforms | |
      2. 3.3.2 Collaborative-Robot Safety Ecosystem | |
      3. 3.3.3 Emerging-Market Industrialization | |
      4. 3.3.4 Safety Data Monetization and Analytics | |
      5. 3.3.5 Convergence with ESG and Sustainability Reporting |
    5. 3.4 Industry Value Chain Analysis |
    6. 3.5 Porter's Five Forces Analysis
  4. 4 Global Machine Safety Market Size & Forecast (2021–2035) |
    1. 4.1 Historical Market Size (2021–2025) |
    2. 4.2 Current & Forecast Market Size (2026–2035) |
    3. 4.3 Market Size by Revenue (USD Billion) |
    4. 4.4 Year-over-Year Growth Analysis
  5. 5 Segmentation Analysis |
    1. 5.1 By Implementation | |
      1. 5.1.1 Individual Components | |
      2. 5.1.2 Embedded Components |
    2. 5.2 By Component | |
      1. 5.2.1 Presence-Sensing Safety Sensors | |
      2. 5.2.2 Safety Light Curtains | |
      3. 5.2.3 Safety Laser Scanners | |
      4. 5.2.4 Safety PLCs | |
      5. 5.2.5 Safety Relays & Controllers | |
      6. 5.2.6 Safety Interlock Switches |
    3. 5.3 By Application | |
      1. 5.3.1 Material Handling | |
      2. 5.3.2 Robotics & Collaborative Robots | |
      3. 5.3.3 Metal & Machine Working | |
      4. 5.3.4 Packaging | |
      5. 5.3.5 Assembly |
    4. 5.4 By End-Use Industry | |
      1. 5.4.1 Automotive | |
      2. 5.4.2 Food & Beverage | |
      3. 5.4.3 Pharmaceuticals & Healthcare | |
      4. 5.4.4 Electronics & Semiconductor | |
      5. 5.4.5 Oil & Gas
  6. 6 Regional Analysis |
    1. 6.1 North America | |
      1. 6.1.1 United States | |
      2. 6.1.2 Canada | |
      3. 6.1.3 Mexico |
    2. 6.2 Europe | |
      1. 6.2.1 Germany | |
      2. 6.2.2 United Kingdom | |
      3. 6.2.3 France | |
      4. 6.2.4 Italy | |
      5. 6.2.5 Spain | |
      6. 6.2.6 Nordic Countries | |
      7. 6.2.7 Russia | |
      8. 6.2.8 Rest of Europe |
    3. 6.3 Asia-Pacific | |
      1. 6.3.1 China | |
      2. 6.3.2 India | |
      3. 6.3.3 Japan | |
      4. 6.3.4 South Korea | |
      5. 6.3.5 ASEAN | |
      6. 6.3.6 Rest of Asia-Pacific |
    4. 6.4 South America | |
      1. 6.4.1 Brazil | |
      2. 6.4.2 Argentina | |
      3. 6.4.3 Rest of South America |
    5. 6.5 Middle East & Africa | |
      1. 6.5.1 Saudi Arabia | |
      2. 6.5.2 UAE | |
      3. 6.5.3 South Africa | |
      4. 6.5.4 Egypt | |
      5. 6.5.5 Rest of MEA
  7. 7 Competitive Landscape |
    1. 7.1 Market Share Analysis (2025) |
    2. 7.2 Competitive Benchmarking Matrix |
    3. 7.3 Company Profiles | |
      1. 7.3.1 Rockwell Automation | |
      2. 7.3.2 Siemens | |
      3. 7.3.3 Schneider Electric | |
      4. 7.3.4 ABB | |
      5. 7.3.5 Pilz | |
      6. 7.3.6 SICK AG | |
      7. 7.3.7 Omron | |
      8. 7.3.8 Honeywell | |
      9. 7.3.9 Keyence | |
      10. 7.3.10 Banner Engineering
  8. 8 Future Outlook & Strategic Recommendations (2026–2035) |
    1. 8.1 AI-Driven Predictive Safety |
    2. 8.2 Autonomous Mobile Robot Safeguarding |
    3. 8.3 Digital Twin Safety Validation |
    4. 8.4 Sustainability-Linked Safety Investment
  9. 9 Recent Developments & News
  10. 10 Frequently Asked Questions (FAQs)
  11. 11 Report Scope & Methodology |
    1. 11.1 Study Period & Base Year |
    2. 11.2 Data Sources & Citations |
    3. 11.3 Abbreviations
  12. 12 LIST OF TABLES |
  13. TABLE 1 Global Machine Safety Market Size & Forecast, by Revenue (USD Billion), 2021–2035 |
  14. TABLE 2 Global Machine Safety Market — Year-over-Year Growth Analysis, 2021–2035 |
  15. TABLE 3 Global Machine Safety Market — Driver Impact Analysis, 2026–2035 |
  16. TABLE 4 Global Machine Safety Market — Restraint Impact Analysis, 2026–2035 |
  17. TABLE 5 Global Machine Safety Market Size, by Implementation, 2021–2035 (USD Billion) |
  18. TABLE 6 Global Machine Safety Market Size, by Component, 2021–2035 (USD Billion) |
  19. TABLE 7 Global Machine Safety Market Size, by Application, 2021–2035 (USD Billion) |
  20. TABLE 8 Global Machine Safety Market Size, by End-Use Industry, 2021–2035 (USD Billion) |
  21. TABLE 9 Global Machine Safety Market Size, by Region, 2021–2035 (USD Billion) |
  22. TABLE 10 North America Machine Safety Market Size, by Country, 2021–2035 (USD Billion) |
  23. TABLE 11 Europe Machine Safety Market Size, by Country, 2021–2035 (USD Billion) |
  24. TABLE 12 Asia-Pacific Machine Safety Market Size, by Country, 2021–2035 (USD Billion) |
  25. TABLE 13 South America Machine Safety Market Size, by Country, 2021–2035 (USD Billion) |
  26. TABLE 14 Middle East & Africa Machine Safety Market Size, by Country, 2021–2035 (USD Billion) |
  27. TABLE 15 Competitive Benchmarking Matrix — Global Machine Safety Market, 2025 |
  28. TABLE 16 Company Profiles — Key Players, Global Machine Safety Market |
  29. TABLE 17 Recent Developments & Strategic Announcements, 2023–2025 |
  30. TABLE 18 North America Machine Safety Market Size, by Implementation, 2021–2035 (USD Billion) |
  31. TABLE 19 North America Machine Safety Market Size, by Component, 2021–2035 (USD Billion) |
  32. TABLE 20 North America Machine Safety Market Size, by Application, 2021–2035 (USD Billion) |
  33. TABLE 21 North America Machine Safety Market Size, by End-Use Industry, 2021–2035 (USD Billion) |
  34. TABLE 22 Europe Machine Safety Market Size, by Implementation, 2021–2035 (USD Billion) |
  35. TABLE 23 Europe Machine Safety Market Size, by Component, 2021–2035 (USD Billion) |
  36. TABLE 24 Europe Machine Safety Market Size, by Application, 2021–2035 (USD Billion) |
  37. TABLE 25 Europe Machine Safety Market Size, by End-Use Industry, 2021–2035 (USD Billion) |
  38. TABLE 26 Asia-Pacific Machine Safety Market Size, by Implementation, 2021–2035 (USD Billion) |
  39. TABLE 27 Asia-Pacific Machine Safety Market Size, by Component, 2021–2035 (USD Billion) |
  40. TABLE 28 Asia-Pacific Machine Safety Market Size, by Application, 2021–2035 (USD Billion) |
  41. TABLE 29 Asia-Pacific Machine Safety Market Size, by End-Use Industry, 2021–2035 (USD Billion) |
  42. TABLE 30 South America Machine Safety Market Size, by Implementation, 2021–2035 (USD Billion) |
  43. TABLE 31 South America Machine Safety Market Size, by Component, 2021–2035 (USD Billion) |
  44. TABLE 32 South America Machine Safety Market Size, by Application, 2021–2035 (USD Billion) |
  45. TABLE 33 South America Machine Safety Market Size, by End-Use Industry, 2021–2035 (USD Billion) |
  46. TABLE 34 Middle East & Africa Machine Safety Market Size, by Implementation, 2021–2035 (USD Billion) |
  47. TABLE 35 Middle East & Africa Machine Safety Market Size, by Component, 2021–2035 (USD Billion) |
  48. TABLE 36 Middle East & Africa Machine Safety Market Size, by Application, 2021–2035 (USD Billion) |
  49. TABLE 37 Middle East & Africa Machine Safety Market Size, by End-Use Industry, 2021–2035 (USD Billion) |
  50. TABLE 38 United States Machine Safety Market Size, by Component, 2021–2035 (USD Billion) |
  51. TABLE 39 United States Machine Safety Market Size, by Application, 2021–2035 (USD Billion) |
  52. TABLE 40 United States Machine Safety Market Size, by End-Use Industry, 2021–2035 (USD Billion) |
  53. TABLE 41 Germany Machine Safety Market Size, by Component, 2021–2035 (USD Billion) |
  54. TABLE 42 Germany Machine Safety Market Size, by Application, 2021–2035 (USD Billion) |
  55. TABLE 43 Germany Machine Safety Market Size, by End-Use Industry, 2021–2035 (USD Billion) |
  56. TABLE 44 China Machine Safety Market Size, by Component, 2021–2035 (USD Billion) |
  57. TABLE 45 China Machine Safety Market Size, by Application, 2021–2035 (USD Billion) |
  58. TABLE 46 China Machine Safety Market Size, by End-Use Industry, 2021–2035 (USD Billion) |
  59. TABLE 47 Japan Machine Safety Market Size, by Component, 2021–2035 (USD Billion) |
  60. TABLE 48 Japan Machine Safety Market Size, by Application, 2021–2035 (USD Billion) |
  61. TABLE 49 Japan Machine Safety Market Size, by End-Use Industry, 2021–2035 (USD Billion) |
  62. TABLE 50 India Machine Safety Market Size, by Component, 2021–2035 (USD Billion) |
  63. TABLE 51 India Machine Safety Market Size, by Application, 2021–2035 (USD Billion) |
  64. TABLE 52 India Machine Safety Market Size, by End-Use Industry, 2021–2035 (USD Billion) |
  65. TABLE 53 South Korea Machine Safety Market Size, by Component, 2021–2035 (USD Billion) |
  66. TABLE 54 South Korea Machine Safety Market Size, by Application, 2021–2035 (USD Billion) |
  67. TABLE 55 South Korea Machine Safety Market Size, by End-Use Industry, 2021–2035 (USD Billion) |
  68. TABLE 56 Brazil Machine Safety Market Size, by Component, 2021–2035 (USD Billion) |
  69. TABLE 57 Brazil Machine Safety Market Size, by Application, 2021–2035 (USD Billion) |
  70. TABLE 58 Brazil Machine Safety Market Size, by End-Use Industry, 2021–2035 (USD Billion) |
  71. TABLE 59 Report Scope & Methodology Summary |
  72. TABLE 60 Detailed Sources and Citations
  73. 13 LIST OF FIGURES |
  74. FIGURE 1 Global Machine Safety Market Dynamics — Drivers, Restraints, and Opportunities |
  75. FIGURE 2 Machine Safety Market — Industry Value Chain Analysis |
  76. FIGURE 3 Machine Safety Market — Porter's Five Forces Analysis |
  77. FIGURE 4 Global Machine Safety Market Size Trend & Forecast (USD Billion), 2021–2035 |
  78. FIGURE 5 Machine Safety Market Share, by Implementation (%), 2025 |
  79. FIGURE 6 Machine Safety Market Share, by Component (%), 2025 |
  80. FIGURE 7 Machine Safety Market Share, by Application (%), 2025 |
  81. FIGURE 8 Machine Safety Market Share, by End-Use Industry (%), 2025 |
  82. FIGURE 9 Machine Safety Market Share, by Region (%), 2025 |
  83. FIGURE 10 North America Machine Safety Market Size (USD Billion), 2021–2035 |
  84. FIGURE 11 Europe Machine Safety Market Size (USD Billion), 2021–2035 |
  85. FIGURE 12 Asia-Pacific Machine Safety Market Size (USD Billion), 2021–2035 |
  86. FIGURE 13 South America Machine Safety Market Size (USD Billion), 2021–2035 |
  87. FIGURE 14 Middle East & Africa Machine Safety Market Size (USD Billion), 2021–2035 |
  88. FIGURE 15 Machine Safety Market — Competitive Landscape Heat Map, 2025

Segmentation Quick Reference

DimensionSub-SegmentsDominant SegmentFastest Growing Segment
By ImplementationIndividual Components, Embedded ComponentsIndividual ComponentsEmbedded Components
By ComponentPresence-Sensing Safety Sensors, Safety Light Curtains, Safety Laser Scanners, Safety PLCs, Safety Relays & Controllers, Safety Interlock SwitchesPresence-Sensing Safety SensorsSafety PLCs
By ApplicationMaterial Handling, Robotics & Collaborative Robots, Metal & Machine Working, Packaging, AssemblyMaterial HandlingRobotics & Collaborative Robots
By End-Use IndustryAutomotive, Food & Beverage, Pharmaceuticals & Healthcare, Electronics & Semiconductor, Oil & GasAutomotivePharmaceuticals & Healthcare
By RegionNorth America, Europe, Asia-Pacific, South America, Middle East & AfricaEuropeAsia-Pacific


Market Segmentation Overview

By Implementation

Sub-SegmentKey Trend
Individual ComponentsSustained retrofit demand across aging installed bases in North America and Europe
Embedded ComponentsOEM pre-integration of safety functions into machine-control architectures


Individual components remain the revenue backbone, driven by the ongoing need to replace and upgrade safety devices on legacy machinery. Embedded components are accelerating as machine builders pursue tighter control-safety integration to reduce total installed cost and improve diagnostic coverage.

By Component

Sub-SegmentKey Trend
Presence-Sensing Safety SensorsExpansion into collaborative and mobile-robot zones
Safety Light CurtainsMiniaturization and higher resolution for compact workstations
Safety Laser ScannersAdoption in outdoor and mobile-equipment applications
Safety PLCsConvergence of standard and safety logic on single platforms
Safety Relays & ControllersGradual replacement by configurable electronic relays
Safety Interlock SwitchesRFID-coded interlocks replacing traditional tongue-type designs


Safety PLCs are at the center of the platform-migration trend, consolidating what previously required multiple relay modules into a single programmable device. Presence-sensing sensors continue to hold the largest share thanks to their versatility across virtually every manufacturing application.

By Application

Sub-SegmentKey Trend
Material HandlingAutomated storage and retrieval safety integration
Robotics & Collaborative RobotsISO/TS 15066 compliance driving adaptive safeguarding
Metal & Machine WorkingRetrofitting legacy presses with modern guarding
PackagingHigh-speed line demands for zero-downtime safety switching
AssemblyErgonomic workstation designs incorporating light-curtain access control


Material handling benefits from the warehousing automation boom, while robotics and collaborative robots represent the fastest-growing application as cobot deployments multiply across SMEs and large enterprises alike.

By End-Use Industry

Sub-SegmentKey Trend
AutomotiveEV production-line conversions requiring full safety redesigns
Food & BeverageHygienic-rated safety devices for washdown environments
Pharmaceuticals & HealthcareCleanroom-grade automation expansion
Electronics & SemiconductorHigh-precision fab-environment safeguarding
Oil & GasHazardous-area certification and explosion-proof safety devices


Automotive holds the largest end-use share, underpinned by massive capital expenditures on electric-vehicle assembly lines. Pharmaceuticals and healthcare is emerging as the highest-growth vertical as biologic and cell-therapy manufacturing scales globally.


 

Download PDF ×

We do not share your information with anyone. However, we may send you emails based on your report interest from time to time. You may contact us at any time to opt-out.