Luxury Shuttle Bus Market (2026 - 2035)

ID: MRFR/AT/8965-HCR 132 Pages Triveni Bhoyar Last Updated: October 12, 2026
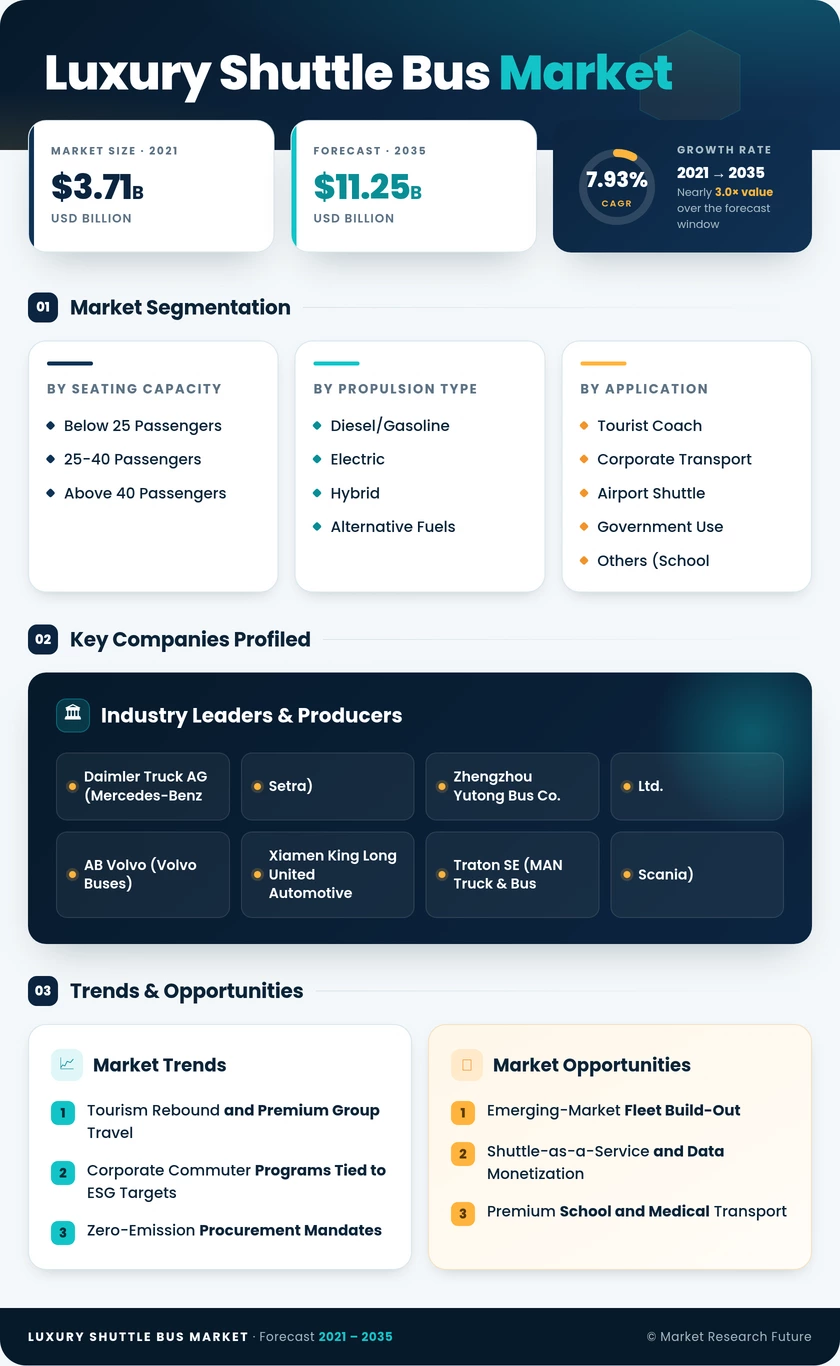
Luxury Shuttle Bus Market Research Report By Seating Capacity (Below 25 Passengers, 25-40 Passengers, Above 40 Passengers), By Propulsion Type (Diesel/Gasoline, Electric, Hybrid, Alternate Fuels), By Application (Tourist Coach, Corporate Transport, Airport Shuttle, Government Use, Others (School and Medical)), By End User (Private Operators, Hospitality and Tourism Providers, Government and Public Sector) - Forecast to 2035
Luxury Shuttle Bus Market
Market Size
Forecast Period2026-2035
CAGR (2026-2035)7.93%
2025 Market SizeUSD 5.24 Billion
Key Players
Daimler Truck AG (Mercedes-Benz
Setra)
Zhengzhou Yutong Bus Co., Ltd.
AB Volvo
Xiamen King Long United Automotive
Traton SE (MAN Truck & Bus
Opportunities
  • Emerging-Market Fleet Build-Out
  • Shuttle-as-a-Service and Data Monetization
  • Premium School and Medical Transport
  1. 1 Market Summary | |
  2. 2 Key Report Takeaways | |
    1. 2.1 By Seating Capacity | |
    2. 2.2 By Propulsion Type | |
    3. 2.3 By Application | |
    4. 2.4 By End User | |
    5. 2.5 By Region | |
  3. 3 Market Size and Forecast (2021–2035) | |
    1. 3.1 Historical Market Size (2021–2024) | |
    2. 3.2 Base Year Market Size (2025) | |
    3. 3.3 Forecast Market Size (2026–2035) | |
    4. 3.4 Year-over-Year Growth Analysis | |
  4. 4 Driver Impact Analysis | |
    1. 4.1 Tourism Rebound and Premium Group Travel | |
    2. 4.2 Corporate Commuter Programs Tied to ESG Targets | |
    3. 4.3 Zero-Emission Procurement Mandates | |
    4. 4.4 Government E-Bus Incentives in Asia-Pacific | |
    5. 4.5 Airport Passenger Growth and Terminal Expansion | |
    6. 4.6 Falling Battery Pack Costs | |
  5. 5 Restraints Impact Analysis | |
    1. 5.1 High Upfront Acquisition Cost | |
    2. 5.2 Charging Infrastructure Gaps on Intercity Corridors | |
    3. 5.3 Professional Driver Shortages | |
    4. 5.4 Competition from Premium Vans and App-Based Transport | |
    5. 5.5 Fragmented Safety and Homologation Standards | |
  6. 6 Opportunities | |
    1. 6.1 Emerging-Market Fleet Build-Out | |
    2. 6.2 Shuttle-as-a-Service and Data Monetization | |
    3. 6.3 Premium School and Medical Transport | |
    4. 6.4 Hospitality-Integrated Shuttle Networks | |
    5. 6.5 Battery-Electric Repowering of Existing Coaches | |
  7. 7 Regional Market Share and Country-Level Analysis | |
    1. 7.1 North America | | |
      1. 7.1.1 US | | |
      2. 7.1.2 Canada | | |
      3. 7.1.3 Mexico | |
    2. 7.2 Europe | | |
      1. 7.2.1 Germany | | |
      2. 7.2.2 UK | | |
      3. 7.2.3 France | | |
      4. 7.2.4 Italy | | |
      5. 7.2.5 Spain | | |
      6. 7.2.6 Nordic Countries | | |
      7. 7.2.7 Russia | | |
      8. 7.2.8 Rest of Europe | |
    3. 7.3 Asia-Pacific | | |
      1. 7.3.1 China | | |
      2. 7.3.2 India | | |
      3. 7.3.3 Japan | | |
      4. 7.3.4 South Korea | | |
      5. 7.3.5 ASEAN | | |
      6. 7.3.6 Rest of Asia-Pacific | |
    4. 7.4 South America | | |
      1. 7.4.1 Brazil | | |
      2. 7.4.2 Argentina | | |
      3. 7.4.3 Rest of South America | |
    5. 7.5 Middle East & Africa | | |
      1. 7.5.1 Saudi Arabia | | |
      2. 7.5.2 UAE | | |
      3. 7.5.3 South Africa | | |
      4. 7.5.4 Egypt | | |
      5. 7.5.5 Rest of MEA | |
  8. 8 Future Outlook (2026–2035) | |
    1. 8.1 Autonomous and Driver-Assist Operations | |
    2. 8.2 Platform Economics and Integrated Booking | |
    3. 8.3 Electrification Supercycle | |
    4. 8.4 ESG Reporting and Scope 3 Commuting | |
  9. 9 Segmentation Analysis | |
    1. 9.1 By Seating Capacity | | |
      1. 9.1.1 Below 25 Passengers | | |
      2. 9.1.2 25-40 Passengers | | |
      3. 9.1.2 Above 40 Passengers | |
    2. 9.2 By Propulsion Type | | |
      1. 9.2.1 Diesel/Gasoline | | |
      2. 9.2.2 Electric | | |
      3. 9.2.3 Hybrid | | |
      4. 9.2.4 Alternate Fuels | |
    3. 9.3 By Application | | |
      1. 9.3.1 Tourist Coach | | |
      2. 9.3.2 Corporate Transport | | |
      3. 9.3.3 Airport Shuttle | | |
      4. 9.3.4 Government Use | | |
      5. 9.3.5 Others (School and Medical) | |
    4. 9.4 By End User | | |
      1. 9.4.1 Private Operators | | |
      2. 9.4.2 Hospitality and Tourism Providers | | |
      3. 9.4.3 Government and Public Sector | |
  10. 10 Competitive Landscape | |
    1. 10.1 Market Concentration Analysis | |
    2. 10.2 Competitive Benchmarking Table | |
    3. 10.3 Company Profiles | | |
      1. 10.3.1 Daimler Truck AG (Mercedes-Benz, Setra) | | |
      2. 10.3.2 Zhengzhou Yutong Bus Co., Ltd. | | |
      3. 10.3.3 AB Volvo (Volvo Buses) | | |
      4. 10.3.4 BYD Company Ltd. | | |
      5. 10.3.5 Xiamen King Long United Automotive | | |
      6. 10.3.6 Traton SE (MAN Truck & Bus, Scania) | | |
      7. 10.3.7 Iveco Group (Iveco Bus) | | |
      8. 10.3.8 Tata Motors Ltd. | | |
      9. 10.3.9 Ashok Leyland Ltd. | | |
      10. 10.3.10 Ford Motor Company | | |
      11. 10.3.11 REV Group, Inc. | | |
      12. 10.3.12 Grech Motors | |
  11. 11 Recent News & Developments | |
  12. 12 Report Scope and Methodology | |
  13. 13 Detailed Sources and Citations | |
  14. 14 Frequently Asked Questions (FAQs) | | LIST OF TABLES | |
  15. TABLE 1 Report Summary Snapshot, 2025–2035 | |
  16. TABLE 2 Global Market Size & Forecast, by Revenue (USD Billion), 2021–2035 | |
  17. TABLE 3 Driver Impact Analysis on CAGR, 2026–2035 | |
  18. TABLE 4 Restraints Impact Analysis on CAGR, 2026–2035 | |
  19. TABLE 5 Regional Summary, by Region, 2025–2035 | |
  20. TABLE 6 North America Market, by Country, 2025–2035 | |
  21. TABLE 7 Europe Market, by Country, 2025–2035 | |
  22. TABLE 8 Asia-Pacific Market, by Country, 2025–2035 | |
  23. TABLE 9 South America Market, by Country, 2025–2035 | |
  24. TABLE 10 Middle East & Africa Market, by Country, 2025–2035 | |
  25. TABLE 11 Global Market, by Seating Capacity, 2025–2035 | |
  26. TABLE 12 Global Market, by Propulsion Type, 2025–2035 | |
  27. TABLE 13 Global Market, by Application, 2025–2035 | |
  28. TABLE 14 Global Market, by End User, 2025–2035 | |
  29. TABLE 15 Competitive Benchmarking Table, 2025 | |
  30. TABLE 16 Report Scope and Methodology | |
  31. TABLE 17 Detailed Sources and Citations | |
  32. TABLE 18 Segmentation Quick Reference | |
  33. TABLE 19 Seating Capacity Sub-Segment Trends | |
  34. TABLE 20 Propulsion Type Sub-Segment Trends | |
  35. TABLE 21 Application Sub-Segment Trends | |
  36. TABLE 22 End User Sub-Segment Trends | | LIST OF FIGURES | |
  37. FIGURE 1 Market Dynamics Overview (Drivers, Restraints, Opportunities) | |
  38. FIGURE 2 Industry Value Chain Analysis | |
  39. FIGURE 3 Porter's Five Forces Analysis | |
  40. FIGURE 4 Global Market Size Trend, 2021–2035 (USD Billion) | |
  41. FIGURE 5 Market Share, by Seating Capacity, 2025 | |
  42. FIGURE 6 Market Share, by Propulsion Type, 2025 | |
  43. FIGURE 7 Market Share, by Application, 2025 | |
  44. FIGURE 8 Market Share, by End User, 2025 | |
  45. FIGURE 9 Regional Market Share, 2025 | |
  46. FIGURE 10 Country-Level Share Comparison, 2025 | |
  47. FIGURE 11 Competitive Landscape Share Estimates, 2025 | |
  48. FIGURE 12 Competitive Positioning Matrix

Segmentation Quick Reference

DimensionSub-SegmentsDominant SegmentFastest Growing Segment
By Seating CapacityBelow 25 Passengers, 25-40 Passengers, Above 40 PassengersAbove 40 Passengers (41.5% share)Below 25 Passengers (8.65% CAGR)
By Propulsion TypeDiesel/Gasoline, Electric, Hybrid, Alternative FuelsDiesel/Gasoline (36.6% share)Electric (11.6% CAGR)
By ApplicationTourist Coach, Corporate Transport, Airport Shuttle, Government Use, Others (School and Medical)Tourist Coach (32.4% share)Corporate Transport (9.22% CAGR)
By End UserPrivate Operators, Hospitality and Tourism Providers, Government and Public SectorPrivate Operators (41.3% share)Hospitality and Tourism Providers (8.52% CAGR)
By RegionNorth America, Europe, Asia-Pacific, South America, Middle East & AfricaAsia-Pacific (38.5% share)Asia-Pacific (38.5% share; fastest regional growth)


Market Segmentation Overview

By Seating Capacity

Sub-SegmentKey Trend
Below 25 PassengersPurpose-built electric micro-coaches with low-floor access
25-40 PassengersLightweight composite bodies for corporate campus routes
Above 40 PassengersHigh-capacity airport and tour coaches with large luggage bays


Above 40 Passengers vehicles lead because airport transfers and tour circuits move large groups on each trip. Below 25 Passengers units grow fastest as hotels and employers favor several departures per hour, and smaller footprints cut depot space and charging time. The 25-40 Passengers class remains the steady middle ground for campus shuttles.

By Propulsion Type

Sub-SegmentKey Trend
Diesel/GasolineLong asset lives sustain installed base
ElectricDepot-charged coaches favored in zero-emission tenders
HybridBridge technology on mixed urban-intercity routes
Alternate FuelsCNG, LNG, and biofuel blends on long corridors


Diesel/Gasoline coaches dominate today because premium vehicles stay in service for more than a decade. Electric models grow fastest as EU CO2 rules and falling pack prices improve the business case for back-to-base routes. Hybrid and Alternate Fuels options persist where intercity charging remains scarce.

By Application

Sub-SegmentKey Trend
Tourist CoachPremium interiors for curated group itineraries
Corporate TransportESG-linked commuter networks with Wi-Fi cabins
Airport ShuttleConcession contracts tied to terminal expansion
Government UseOfficial delegation and outsourced public routes
Others (School and Medical)Accessibility and hygiene upgrades


Tourist Coach services lead on the strength of recovered international arrivals and higher per-trip spending. Corporate Transport grows fastest because employers must now report commuting emissions and use predictable shuttles to retain staff. Airport Shuttle demand stays resilient through long-term concessions.

By End User

Sub-SegmentKey Trend
Private OperatorsDynamic timetables and premium onboard services
Hospitality and Tourism ProvidersShuttle passes bundled into loyalty tiers
Government and Public SectorOutsourcing of variable-demand routes


Private Operators hold the largest share because flexible scheduling and add-ons such as concierge baggage handling justify premium fares. Hospitality and Tourism Providers grow fastest as hotel chains bundle transfers into loyalty programs to lift shoulder-season occupancy. Government and Public Sector buyers increasingly contract private specialists rather than owning fleets.


 

Download PDF ×

We do not share your information with anyone. However, we may send you emails based on your report interest from time to time. You may contact us at any time to opt-out.