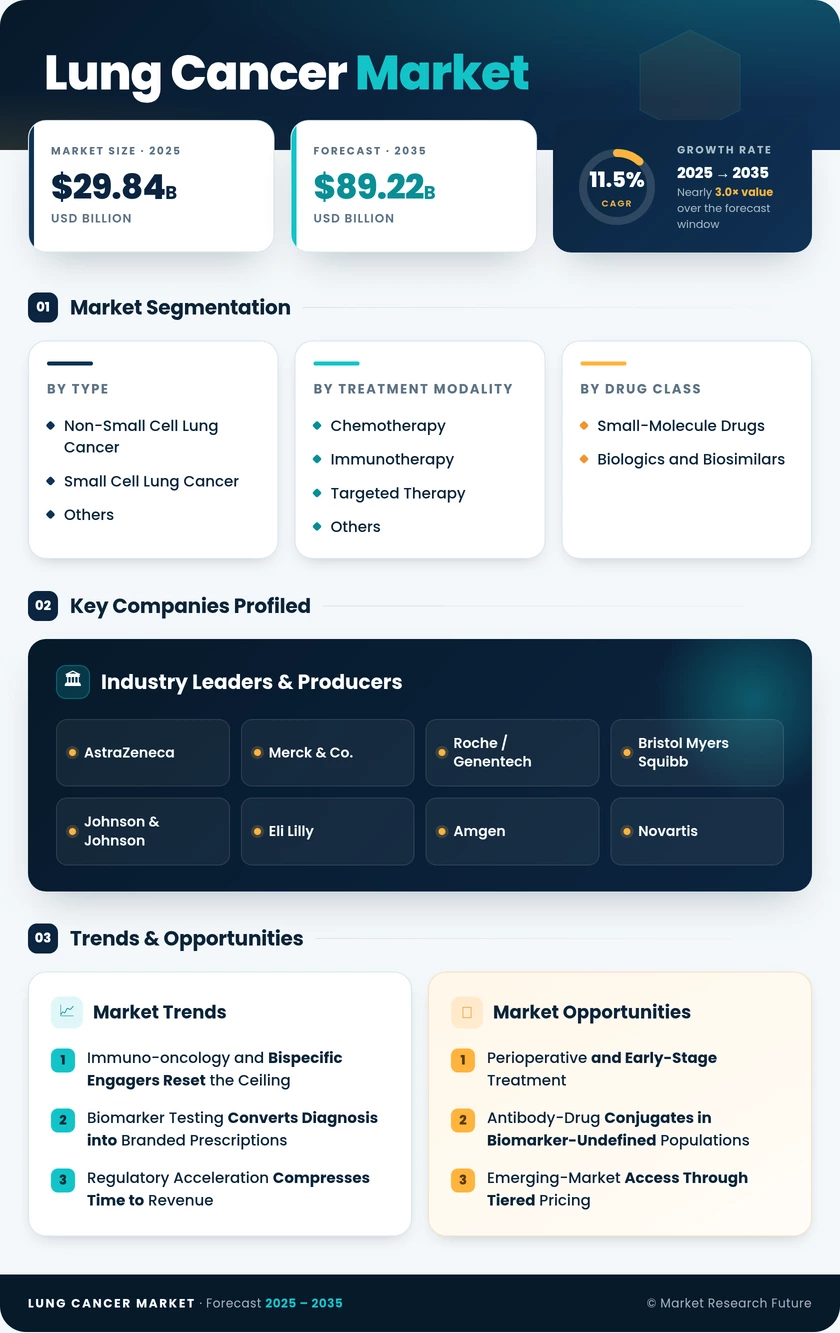
Lung Cancer Market (2026 - 2035)

Lung Cancer Market Research Report: Size, Share, Trend Analysis By Treatment Type (Chemotherapy, Radiation Therapy, Targeted Therapy, Immunotherapy), By Diagnosis Type (Imaging Tests, Biopsy, Sputum Cytology, Blood Tests), By Patient Demographics (Age, Gender, Smoking History, Geographic Location), By Stage of Cancer (Early Stage, Locally Advanced Stage, Metastatic Stage) and By Regional (North America, Europe, South America, Asia Pacific, Middle East and Africa) - Growth Outlook & Industry Forecast 2025 To 2035

Forecast Period
2026-2035
CAGR
11.5%
2025 Market Size
USD 29.84 Billion
2035 Market Size
USD 89.22 Billion
Healthcare ● Updated August 2026 Report ID: MRFR/HC/0679-CR | Pages: 200 | Author: Nidhi Mandole, Rahul Gotadki
  1. 1 Market Summary |
    1. 1.1 Study Assumptions & Market Definition |
    2. 1.2 Scope of the Study |
    3. 1.3 Research Methodology
  2. 2 Key Report Takeaways |
    1. 2.1 By Disease Type & Treatment Modality |
    2. 2.2 By Drug Class & Distribution Channel |
    3. 2.3 By Geography
  3. 3 Market Size & Forecast (2021–2035) |
    1. 3.1 Historical Market Size (2021–2025) |
    2. 3.2 Current & Forecast Market Size (2026–2035) |
    3. 3.3 Market Size by Revenue (USD Billion) |
    4. 3.4 Year-over-Year Growth Analysis
  4. 4 Driver Impact Analysis |
    1. 4.1 Immuno-Oncology and Bispecific Engagers |
    2. 4.2 Biomarker Testing Penetration |
    3. 4.3 Regulatory Acceleration and Project Orbis |
    4. 4.4 Lung Screening Programme Expansion
  5. 5 Restraints Impact Analysis |
    1. 5.1 Payer Price Pressure and Value-Based Contracting |
    2. 5.2 Patent Expiry and Biosimilar Erosion |
    3. 5.3 Acquired Resistance and Treatment Duration Limits
  6. 6 Opportunity Analysis |
    1. 6.1 Perioperative and Early-Stage Treatment |
    2. 6.2 Antibody-Drug Conjugates in Biomarker-Undefined Populations |
    3. 6.3 Emerging-Market Access and Tiered Pricing |
    4. 6.4 Diagnostics-Linked Business Models |
    5. 6.5 Resistance-Directed Sequencing Portfolios
  7. 7 Regional Market Share & Country-Level Analysis |
    1. 7.1 North America | |
      1. 7.1.1 US | |
      2. 7.1.2 Canada | |
      3. 7.1.3 Mexico |
    2. 7.2 Europe | |
      1. 7.2.1 Germany | |
      2. 7.2.2 UK | |
      3. 7.2.3 France | |
      4. 7.2.4 Italy | |
      5. 7.2.5 Spain | |
      6. 7.2.6 Nordic Countries | |
      7. 7.2.7 Russia | |
      8. 7.2.8 Rest of Europe |
    3. 7.3 Asia-Pacific | |
      1. 7.3.1 China | |
      2. 7.3.2 India | |
      3. 7.3.3 Japan | |
      4. 7.3.4 South Korea | |
      5. 7.3.5 ASEAN | |
      6. 7.3.6 Rest of Asia-Pacific |
    4. 7.4 South America | |
      1. 7.4.1 Brazil | |
      2. 7.4.2 Argentina | |
      3. 7.4.3 Rest of South America |
    5. 7.5 Middle East & Africa | |
      1. 7.5.1 Saudi Arabia | |
      2. 7.5.2 UAE | |
      3. 7.5.3 South Africa | |
      4. 7.5.4 Egypt | |
      5. 7.5.5 Rest of Middle East & Africa
  8. 8 Future Outlook (2026–2035) |
    1. 8.1 Machine Learning in Patient Selection |
    2. 8.2 Combination Platforms as the Competitive Unit |
    3. 8.3 Biosimilar Transition in Checkpoint Inhibition |
    4. 8.4 Prevention Economics and Tobacco Policy
  9. 9 Market Segmentation Analysis |
    1. 9.1 By Disease Type | |
      1. 9.1.1 Non-Small Cell Lung Cancer | |
      2. 9.1.2 Small Cell Lung Cancer | |
      3. 9.1.3 Others |
    2. 9.2 By Treatment Modality | |
      1. 9.2.1 Chemotherapy | |
      2. 9.2.2 Immunotherapy | |
      3. 9.2.3 Targeted Therapy | |
      4. 9.2.4 Others |
    3. 9.3 By Drug Class | |
      1. 9.3.1 Small-Molecule Drugs | |
      2. 9.3.2 Biologics and Biosimilars |
    4. 9.4 By Distribution Channel | |
      1. 9.4.1 Hospital Pharmacies | |
      2. 9.4.2 Retail Pharmacies | |
      3. 9.4.3 Online / Specialty Pharmacies |
    5. 9.5 By Line of Therapy | |
      1. 9.5.1 First-Line | |
      2. 9.5.2 Second-Line | |
      3. 9.5.3 Third-Line and Later
  10. 10 Competitive Landscape |
    1. 10.1 Market Concentration Analysis (2026) |
    2. 10.2 Competitive Benchmarking Matrix |
    3. 10.3 Company Profiles | |
      1. 10.3.1 AstraZeneca | |
      2. 10.3.2 Merck & Co. | |
      3. 10.3.3 Roche / Genentech | |
      4. 10.3.4 Bristol Myers Squibb | |
      5. 10.3.5 Johnson & Johnson | |
      6. 10.3.6 Eli Lilly | |
      7. 10.3.7 Amgen | |
      8. 10.3.8 Novartis | |
      9. 10.3.9 Pfizer | |
      10. 10.3.10 Takeda | |
      11. 10.3.11 Daiichi Sankyo | |
      12. 10.3.12 Boehringer Ingelheim
  11. 11 Recent News & Developments
  12. 12 Report Scope & Methodology
  13. 13 Detailed Sources & Citations
  14. 14 Frequently Asked Questions
  15. 15 LIST OF TABLES |
  16. TABLE 1 Global Lung Cancer Therapeutics Market Size & Forecast, by Revenue (USD Billion), 2021–2035 |
  17. TABLE 2 Global Lung Cancer Therapeutics Market – Year-over-Year Growth Analysis, 2021–2035 |
  18. TABLE 3 Driver Impact Analysis – Estimated Contribution to CAGR, 2026–2035 |
  19. TABLE 4 Restraint Impact Analysis – Estimated Drag on CAGR, 2026–2035 |
  20. TABLE 5 Global Market Size, by Region, 2021–2035 (USD Billion) |
  21. TABLE 6 North America Market Size, by Country, 2021–2035 (USD Billion) |
  22. TABLE 7 Europe Market Size, by Country, 2021–2035 (USD Billion) |
  23. TABLE 8 Asia-Pacific Market Size, by Country, 2021–2035 (USD Billion) |
  24. TABLE 9 South America Market Size, by Country, 2021–2035 (USD Billion) |
  25. TABLE 10 Middle East & Africa Market Size, by Country, 2021–2035 (USD Billion) |
  26. TABLE 11 Global Market Size, by Disease Type, 2021–2035 (USD Billion) |
  27. TABLE 12 Global Market Size, by Treatment Modality, 2021–2035 (USD Billion) |
  28. TABLE 13 Global Market Size, by Drug Class, 2021–2035 (USD Billion) |
  29. TABLE 14 Global Market Size, by Distribution Channel, 2021–2035 (USD Billion) |
  30. TABLE 15 Global Market Size, by Line of Therapy, 2021–2035 (USD Billion) |
  31. TABLE 16 North America Market Size, by Disease Type and Treatment Modality, 2021–2035 (USD Billion) |
  32. TABLE 17 Europe Market Size, by Disease Type and Treatment Modality, 2021–2035 (USD Billion) |
  33. TABLE 18 Asia-Pacific Market Size, by Disease Type and Treatment Modality, 2021–2035 (USD Billion) |
  34. TABLE 19 South America Market Size, by Disease Type and Treatment Modality, 2021–2035 (USD Billion) |
  35. TABLE 20 Middle East & Africa Market Size, by Disease Type and Treatment Modality, 2021–2035 (USD Billion) |
  36. TABLE 21 Competitive Benchmarking Matrix – Global Lung Cancer Therapeutics Market, 2026 |
  37. TABLE 22 Company Profiles – Key Players, Global Lung Cancer Therapeutics Market |
  38. TABLE 23 Recent Developments & Regulatory Milestones, 2023–2025 |
  39. TABLE 24 Report Scope & Methodology Summary |
  40. TABLE 25 Detailed Sources & Citations Index
  41. 16 LIST OF FIGURES |
  42. FIGURE 1 Market Dynamics – Drivers, Restraints and Opportunities Snapshot |
  43. FIGURE 2 Industry Value Chain Analysis – Discovery to Dispensing |
  44. FIGURE 3 Porter's Five Forces Analysis |
  45. FIGURE 4 Global Market Size Trend and Forecast, 2021–2035 (USD Billion) |
  46. FIGURE 5 Year-over-Year Growth Trajectory, 2022–2035 (%) |
  47. FIGURE 6 Market Share by Disease Type, 2025 vs 2035 (%) |
  48. FIGURE 7 Market Share by Treatment Modality, 2025 vs 2035 (%) |
  49. FIGURE 8 Market Share by Drug Class, 2025 vs 2035 (%) |
  50. FIGURE 9 Market Share by Distribution Channel, 2025 (%) |
  51. FIGURE 10 Market Share by Line of Therapy, 2025 (%) |
  52. FIGURE 11 Regional Revenue Share Distribution, 2025 (%) |
  53. FIGURE 12 Regional CAGR Comparison, 2026–2035 (%) |
  54. FIGURE 13 North America Country-Level Share Breakdown, 2025 (%) |
  55. FIGURE 14 Asia-Pacific Country-Level Growth Comparison, 2026–2035 (%) |
  56. FIGURE 15 Competitive Landscape – Estimated Revenue Share Positioning, 2026 |
  57. FIGURE 16 Regulatory Approval Timeline, 2023–2025
Share::
Request Free Sample

Segmentation Quick Reference

DimensionSub-SegmentsDominant SegmentFastest Growing Segment
By Disease TypeNon-Small Cell Lung Cancer, Small Cell Lung Cancer, OthersNon-Small Cell Lung CancerSmall Cell Lung Cancer
By Treatment ModalityChemotherapy, Immunotherapy, Targeted Therapy, OthersChemotherapyImmunotherapy
By Drug ClassSmall-Molecule Drugs, Biologics and BiosimilarsSmall-Molecule DrugsBiologics and Biosimilars
By Distribution ChannelHospital Pharmacies, Retail Pharmacies, Online / Specialty PharmaciesHospital PharmaciesRetail Pharmacies
By Line of TherapyFirst-Line, Second-Line, Third-Line and LaterFirst-LineThird-Line and Later
By GeographyNorth America, Europe, Asia-Pacific, South America, Middle East & AfricaNorth AmericaAsia-Pacific


Market Segmentation Overview

By Disease Type

Sub-SegmentKey Trend
Non-Small Cell Lung CancerPerioperative and stage III label expansion pulling revenue into earlier disease.
Small Cell Lung CancerDLL3-directed bispecific approval ending a two-decade innovation gap
OthersMesothelioma and rare thoracic tumours gaining dedicated trial attention


Disease type remains the primary axis of commercial differentiation because approved mechanisms map almost entirely onto histology. Non-small cell disease carries the volume and the biomarker diversity; small cell disease carries the growth rate.

By Treatment Modality

Sub-SegmentKey Trend
ChemotherapyRepositioning as a combination backbone rather than a standalone regimen
ImmunotherapyMoving backward into neoadjuvant and adjuvant settings
Targeted TherapyExpanding with each new actionable alteration and resistance-directed follow-on
OthersRadiopharmaceutical and supportive care agents entering thoracic protocols


Modality mix is shifting faster than headline shares suggest, because chemotherapy volume increasingly appears inside branded combination protocols rather than as generic monotherapy.

By Drug Class

Sub-SegmentKey Trend
Small-Molecule DrugsSuccessive inhibitor generations sustaining oral franchise value
Biologics and BiosimilarsAntibody-drug conjugates and bispecifics driving above-market growth.


Class competition is converging: several developers now run parallel small-molecule and biologic programmes against the same target, hedging against both resistance and biosimilar entry.

By Distribution Channel

Sub-SegmentKey Trend
Hospital PharmaciesRetaining infusion and monitoring-intensive agents
Retail PharmaciesCapturing oral targeted therapy volume as prescriptions shift outward
Online / Specialty PharmaciesBuilding adherence and home-delivery services around chronic oral dosing


Channel economics follow dosing format. Every oral approval moves a slice of revenue away from hospital dispensing toward specialty and retail networks.

By Line of Therapy

Sub-SegmentKey Trend
First-LineIntensifying through chemotherapy-free and combination regimens
Second-LineDriven by predictable resistance emergence on targeted agents
Third-Line and LaterExpanding as survival gains keep more patients eligible for further treatment


Line-of-therapy distribution is a direct readout of survival improvement. Longer survival deepens the funnel, and later-line growth will outpace first-line growth throughout the forecast period.

By Geography

Sub-SegmentKey Trend
North AmericaPrice negotiation offsetting early-access revenue advantage
EuropeJoint clinical assessment standardising evidence review across member states
Asia-PacificNational reimbursement listings converting high incidence into paid volume
South AmericaTender-based public procurement alongside premium private segment
Middle East & AfricaGulf oncology infrastructure investment outpacing regional averages.


Regional divergence now stems more from payer architecture than from clinical practice, which has largely converged around the same international guidelines.




Share::
Request Free Sample
Download PDF ×

We do not share your information with anyone. However, we may send you emails based on your report interest from time to time. You may contact us at any time to opt-out.