Segmentation Quick Reference
| Dimension | Sub-Segments | Dominant Segment | Fastest Growing Segment |
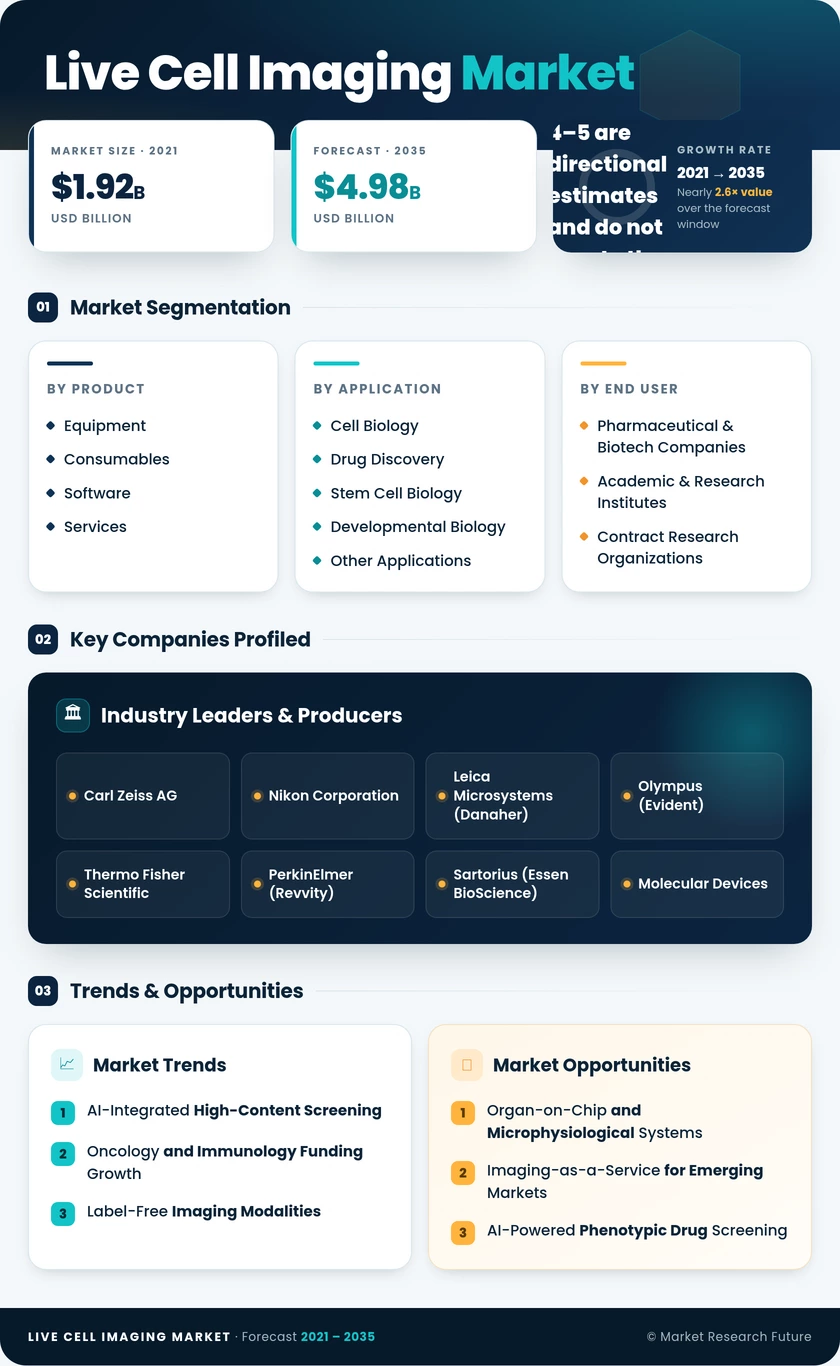
| By Product | Equipment; Consumables; Software and Services | Equipment (46.40% share, 2025) | Consumables (8.15% CAGR) |
| By Application | Cell Biology; Drug Discovery; Stem Cell Biology; Developmental Biology; Other Applications | Cell Biology (29.85% share, 2025) | Drug Discovery (8.78% CAGR) |
| By End User | Pharmaceutical & Biotech Companies; Academic & Research Institutes; Contract Research Organizations | Pharma & Biotech (56.80% share, 2025) | Academic & Research Institutes (9.10% CAGR) |
Market Segmentation Overview
By Product
| Sub-Segment | Key Trend |
| Equipment | Shift toward AI-embedded confocal and light-sheet platforms with environmental control |
| Consumables | Rising demand for microfluidic chips and specialty culture media for 3D assay workflows |
| Software and Services | Transition from perpetual licenses to SaaS cloud analytics models |
Equipment spending is driven by the ongoing refresh cycle as labs retire legacy widefield systems in favor of spinning-disk confocal and light-sheet platforms with integrated AI modules. Consumables growth tracks the expansion of high-throughput screening campaigns that consume reagents, coverslips, and microfluidic substrates at accelerating rates. Software and services are evolving fastest in margin terms as vendors capture recurring revenue through cloud-hosted analytics and managed-service contracts.
By Application
| Sub-Segment | Key Trend |
| Cell Biology | Broad-spectrum use across mitosis, apoptosis, and intracellular trafficking studies |
| Drug Discovery | Phenotypic screening replacing biochemical assays in early-stage pipelines |
| Stem Cell Biology | iPSC differentiation monitoring for cell-therapy manufacturing |
| Developmental Biology | Embryonic and organoid time-lapse studies enabled by label-free modalities |
| Other Applications | Neuroscience calcium imaging and infectious-disease pathogen tracking |
Cell biology remains the broadest application vertical because virtually every cellular process benefits from real-time visualization. Drug discovery is the growth engine, propelled by pharmaceutical companies investing in image-based phenotypic screening platforms that generate richer mechanistic data than traditional target-based assays.
By End User
| Sub-Segment | Key Trend |
| Pharmaceutical & Biotechnology Companies | End-to-end platform consolidation with integrated analytics |
| Academic & Research Institutes | Government grant-funded core-facility modernization |
| Contract Research Organizations | Shared-access and per-experiment pricing models |
Pharmaceutical and biotech firms operate the largest installed base and drive product-specification requirements upstream to OEMs. Academic institutes are the fastest-growing user cohort as national funding agencies dedicate targeted budgets for imaging infrastructure. CROs represent a high-growth niche built on asset-light service models that democratize access to advanced live-cell imaging capabilities.