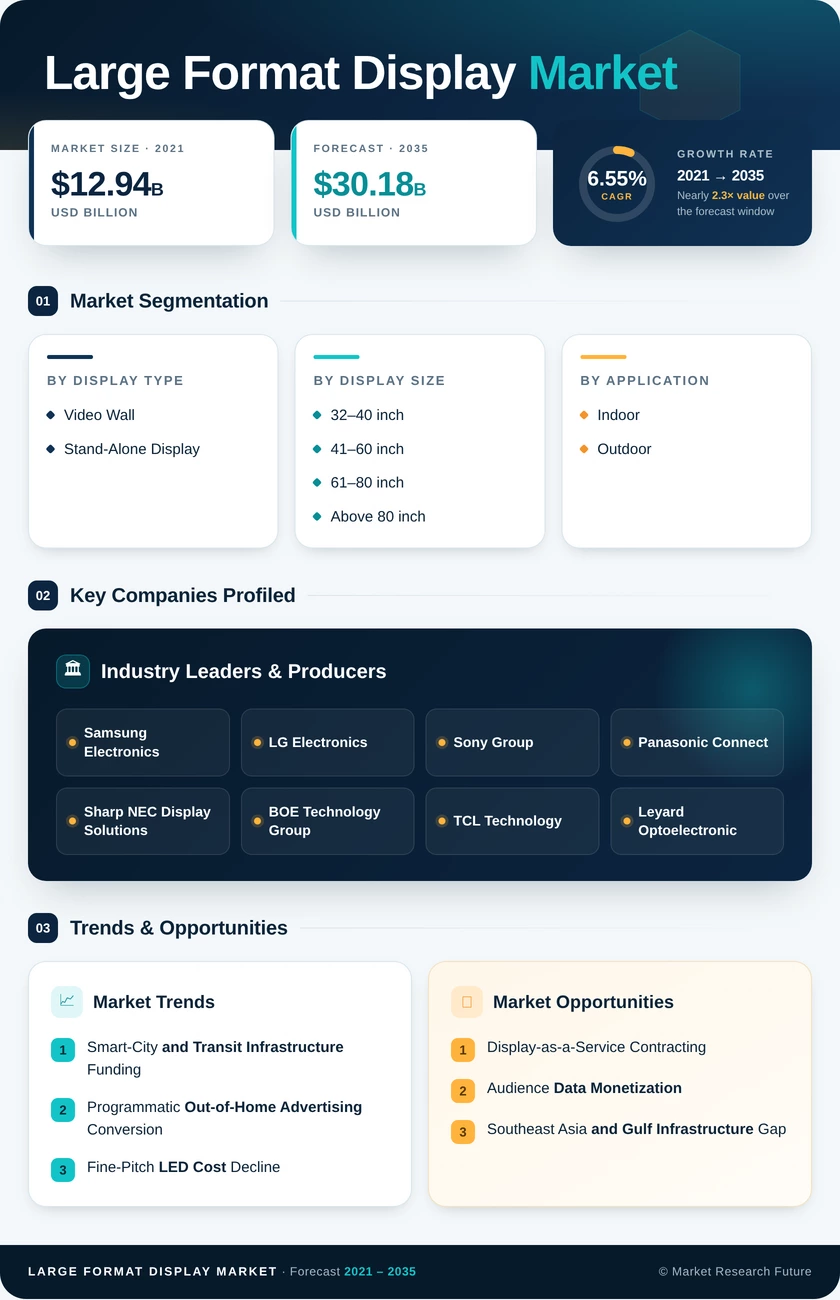
Large Format Display Market (2026 – 2035)

ID: MRFR/SEM/2293-HCR 200 Pages Ankit Gupta Last Updated: November 09, 2026
Large Format Display Market Size, Share and Research Report By Display Type (Video Wall and Stand-Alone Display), By Display Size (32–40 Inch, 41–60 Inch, 61–80 Inch, and Above 80 Inches), By Application (Indoor and Outdoor), By End-User (Commercial, Infrastructural, Institutional, and Industrial) – Industry Forecast Till 2035
Large Format Display Market
Market Size
Forecast Period2026-2035
CAGR (2026-2035)6.55%
2025 Market Size$16.42 Billion
2035 Market Size$30.18 Billion
Key Players
Samsung Electronics
LG Electronics
Sony Group
Panasonic Connect
Sharp NEC Display Solutions
BOE Technology Group
Opportunities
  • Display-as-a-Service Contracting
  • Audience Data Monetization
  • Southeast Asia and Gulf Infrastructure Gap
  1. 1 Market Summary | |
    1. 1.1 Study Assumptions & Market Definition | |
    2. 1.2 Scope of the Study | |
    3. 1.3 Research Methodology | |
  2. 2 Key Report Takeaways | |
    1. 2.1 By Display Type | |
    2. 2.2 By Display Size | |
    3. 2.3 By Application | |
    4. 2.4 By End-User | |
    5. 2.5 By Region | |
  3. 3 Market Size and Forecast (2021–2035) | |
    1. 3.1 Historical Market Size (2021–2024) | |
    2. 3.2 Base Year Estimate (2025) | |
    3. 3.3 Forecast Market Size (2026–2035) | |
    4. 3.4 Year-over-Year Growth Analysis | |
  4. 4 Driver Impact Analysis | |
    1. 4.1 Smart-City and Transit Infrastructure Funding | |
    2. 4.2 Programmatic Out-of-Home Advertising Conversion | |
    3. 4.3 Fine-Pitch LED Cost Decline | |
    4. 4.4 Hybrid-Work Collaboration Refresh | |
    5. 4.5 Retail Experience and In-Store Conversion Analytics | |
    6. 4.6 Sustainability-Linked Procurement Mandates | |
    7. 4.7 Virtual Production and Immersive Venue Build-Out | |
  5. 5 Constraints Impact Analysis | |
    1. 5.1 High Total Cost of Ownership and Installation Complexity | |
    2. 5.2 Energy Consumption and Efficiency Regulation | |
    3. 5.3 Panel Supply Concentration and Tariff Exposure | |
    4. 5.4 Content-Operations Skills Shortage | |
    5. 5.5 Municipal Permitting Limits on Outdoor Signage | |
  6. 6 Opportunities | |
    1. 6.1 Display-as-a-Service Contracting | |
    2. 6.2 Audience Data Monetization | |
    3. 6.3 Southeast Asia and Gulf Infrastructure Gap | |
    4. 6.4 Regulated Sustainability Compliance as Differentiation | |
    5. 6.5 Healthcare and Education Verticals | |
  7. 7 Regional Market Share and Country-Level Analysis | |
    1. 7.1 North America | | |
      1. 7.1.1 United States | |
    2. 7.2 Europe | | |
      1. 7.2.1 Germany | | |
      2. 7.2.2 United Kingdom | | |
      3. 7.2.3 France | | |
      4. 7.2.4 Rest of Europe | |
    3. 7.3 Asia-Pacific | | |
      1. 7.3.1 China | | |
      2. 7.3.2 Japan | | |
      3. 7.3.3 India | | |
      4. 7.3.4 South Korea | | |
      5. 7.3.5 Rest of Asia-Pacific | |
    4. 7.4 South America | | |
      1. 7.4.1 Brazil | | |
      2. 7.4.2 Rest of South America | |
    5. 7.5 Middle East & Africa | | |
      1. 7.5.1 Saudi Arabia | | |
      2. 7.5.2 United Arab Emirates | | |
      3. 7.5.3 South Africa | | |
      4. 7.5.4 Rest of Middle East & Africa | |
  8. 8 Future Outlook (2026–2035) | |
    1. 8.1 AI-Generated and Dynamically Optimized Content | |
    2. 8.2 Platform Economics and Recurring Revenue | |
    3. 8.3 Energy Intensity and Reporting Obligations | |
    4. 8.4 Micro LED Cost Crossover and Architecture Shift | |
  9. 9 Segmentation Analysis | |
    1. 9.1 By Display Type | | |
      1. 9.1.1 Video Wall | | |
      2. 9.1.2 Stand-Alone Display | |
    2. 9.2 By Display Size | | |
      1. 9.2.1 32–40 inch | | |
      2. 9.2.2 41–60 inch | | |
      3. 9.2.3 61–80 inch | | |
      4. 9.2.1 Above 80 inches | |
    3. 9.3 By Application | | |
      1. 9.3.1 Indoor | | |
      2. 9.3.2 Outdoor | |
    4. 9.4 By End-User | | |
      1. 9.4.1 Commercial | | |
      2. 9.4.2 Infrastructural | | |
      3. 9.4.3 Institutional | | |
      4. 9.4.4 Industrial | |
  10. 10 Competitive Landscape | |
    1. 10.1 Market Concentration Analysis | |
    2. 10.2 Competitive Benchmarking Matrix | |
    3. 10.3 Company Profiles | |
  11. 11 Recent News & Developments | |
  12. 12 Report Scope and Methodology | |
  13. 13 Detailed Sources and Citations | |
  14. 14 Frequently Asked Questions | | LIST OF TABLES | |
  15. TABLE 1 Global Large Format Display Market Size & Forecast, by Revenue (USD Billion), 2021–2035 | |
  16. TABLE 2 Global Large Format Display Market – Year-over-Year Growth Analysis, 2021–2035 | |
  17. TABLE 3 Driver Impact Analysis Matrix, 2026–2035 | |
  18. TABLE 4 Restraint Impact Analysis Matrix, 2026–2035 | |
  19. TABLE 5 Global Large Format Display Market Size, by Region, 2021–2035 (USD Billion) | |
  20. TABLE 6 North America Large Format Display Market Size, by Country, 2021–2035 (USD Billion) | |
  21. TABLE 7 Europe Large Format Display Market Size, by Country, 2021–2035 (USD Billion) | |
  22. TABLE 8 Asia-Pacific Large Format Display Market Size, by Country, 2021–2035 (USD Billion) | |
  23. TABLE 9 South America Large Format Display Market Size, by Country, 2021–2035 (USD Billion) | |
  24. TABLE 10 Middle East & Africa Large Format Display Market Size, by Country, 2021–2035 (USD Billion) | |
  25. TABLE 11 Global Large Format Display Market Size, by Display Type, 2021–2035 (USD Billion) | |
  26. TABLE 12 Global Large Format Display Market Size, by Display Size, 2021–2035 (USD Billion) | |
  27. TABLE 13 Global Large Format Display Market Size, by Application, 2021–2035 (USD Billion) | |
  28. TABLE 14 Global Large Format Display Market Size, by End-User, 2021–2035 (USD Billion) | |
  29. TABLE 15 Competitive Benchmarking Matrix, 2026 | |
  30. TABLE 16 Company Profiles – Key Players | |
  31. TABLE 17 Recent Developments & Strategic Announcements, 2023–2025 | |
  32. TABLE 18 Report Scope & Methodology Summary | |
  33. TABLE 19 Detailed Sources and Citations | |
  34. TABLE 20 Segmentation Quick Reference Summary | | LIST OF FIGURES | |
  35. FIGURE 1 Market Dynamics – Drivers, Restraints, and Opportunities | |
  36. FIGURE 2 Industry Value Chain Analysis | |
  37. FIGURE 3 Porter's Five Forces Analysis | |
  38. FIGURE 4 Global Market Size Trend, 2021–2035 (USD Billion) | |
  39. FIGURE 5 Year-over-Year Growth Curve, 2022–2035 | |
  40. FIGURE 6 Market Share by Display Type, 2025 | |
  41. FIGURE 7 Market Share by Display Size, 2025 | |
  42. FIGURE 8 Market Share by Application, 2025 | |
  43. FIGURE 9 Market Share by End-User, 2025 | |
  44. FIGURE 10 Regional Revenue Share, 2025 | |
  45. FIGURE 11 Regional CAGR Comparison, 2026–2035 | |
  46. FIGURE 12 Competitive Landscape – Estimated Revenue Share Bands, 2026 | |
  47. FIGURE 13 Strategic Positioning Matrix – Hardware vs Platform Capability

Segmentation Quick Reference

DimensionSub-SegmentsDominant SegmentFastest Growing Segment
By Display TypeVideo Wall; Stand-Alone DisplayVideo Wall — 55.4% share (2025)Stand-Alone Display — 7.11% CAGR
By Display Size32–40 inch; 41–60 inch; 61–80 inch; Above 80 inch41–60 inch — USD 6.06 Billion (2025)Above 80 inches — 6.99% CAGR
By ApplicationIndoor; OutdoorIndoor — 68.5% share (2025)Outdoor — 7.24% CAGR
By End-UserCommercial; Infrastructural; Institutional; IndustrialCommercial — 49.2% share (2025)Infrastructural — 7.19% CAGR
By RegionNorth America; Europe; Asia-Pacific; South America; Middle East & AfricaNorth America — 33.1% share (2025)Asia-Pacific — 7.18% CAGR (2026–2035)


Market Segmentation Overview

By Display Type

Sub-SegmentKey Trend
Video WallFine-pitch COB LED displacing tiled LCD in lobbies and control rooms
Stand-Alone DisplayFleet standardization on drop-in replaceable units with onboard players


Video Wall retains leadership because utility control rooms, traffic centres, and broadcast galleries specify continuous canvases that a single panel cannot deliver, and those buyers replace on engineering cycles rather than marketing budgets. Stand-Alone Display grows faster because franchise retail and quick-service restaurants purchase in high unit counts where standard mounting and field-serviceability outweigh seamlessness. Falling chip-on-board module costs are narrowing the price gap between the two, shifting differentiation toward the management software that runs mixed estates.

By Display Size

Sub-SegmentKey Trend
32–40 inchConcentrated at transaction points and wayfinding nodes
41–60 inchDefault specification for huddle rooms and drive-through menus
61–80 inchFront-of-room collaboration standard rising with room-system certification
Above 80 inchVirtual-production and experiential façade demand at premium margins


The 41–60 inch class leads on installed value because its sightline economics suit viewing distances under four metres, which describes most meeting rooms and drive-through lanes. Above 80 inch grows fastest as studio volumes and immersive retail require seamless canvases only advanced LED architectures deliver at scale. Efficiency rules targeting high-luminance products are the principal regulatory drag on that upper tier, while 32–40 inch units remain a stable but slow-growing transaction-point cohort.

By Application

Sub-SegmentKey Trend
IndoorHybrid-work collaboration and retail media driving refresh volume
OutdoorConversion of static roadside inventory to IP-rated high-nit modules


Indoor holds roughly two-thirds of revenue because controlled lighting permits thinner enclosures and lower ingress ratings, cutting bill-of-materials cost materially against weatherized equivalents. Outdoor grows faster as media owners replace static billboards with instrumented modules that support verified impression trading and proof-of-play reporting. Municipal permitting limits and dimming curfews in European cities are the main brake on outdoor conversion, which is why growth concentrates in Asia-Pacific and Gulf transit corridors.

By End-User

Sub-SegmentKey Trend
CommercialSeven-year retail and hospitality refresh cycles
InfrastructuralSmart-city command centres and transit passenger information
InstitutionalEducation and healthcare procurement insulated from ad cycles
IndustrialPlant-floor visualization tied to automation upgrades


Commercial buyers anchor the segment through retail, hospitality, and corporate real-estate refresh programs that renew on predictable multi-year cycles. Infrastructural users grow fastest because municipal command centres, transit agencies, and EV charging operators treat displays as operational assets and increasingly as revenue-generating inventory during idle cycles. Institutional demand is smaller but unusually resilient, governed by public budget calendars rather than discretionary marketing spend, while Industrial adoption tracks broader factory automation investment.




Download PDF ×

We do not share your information with anyone. However, we may send you emails based on your report interest from time to time. You may contact us at any time to opt-out.