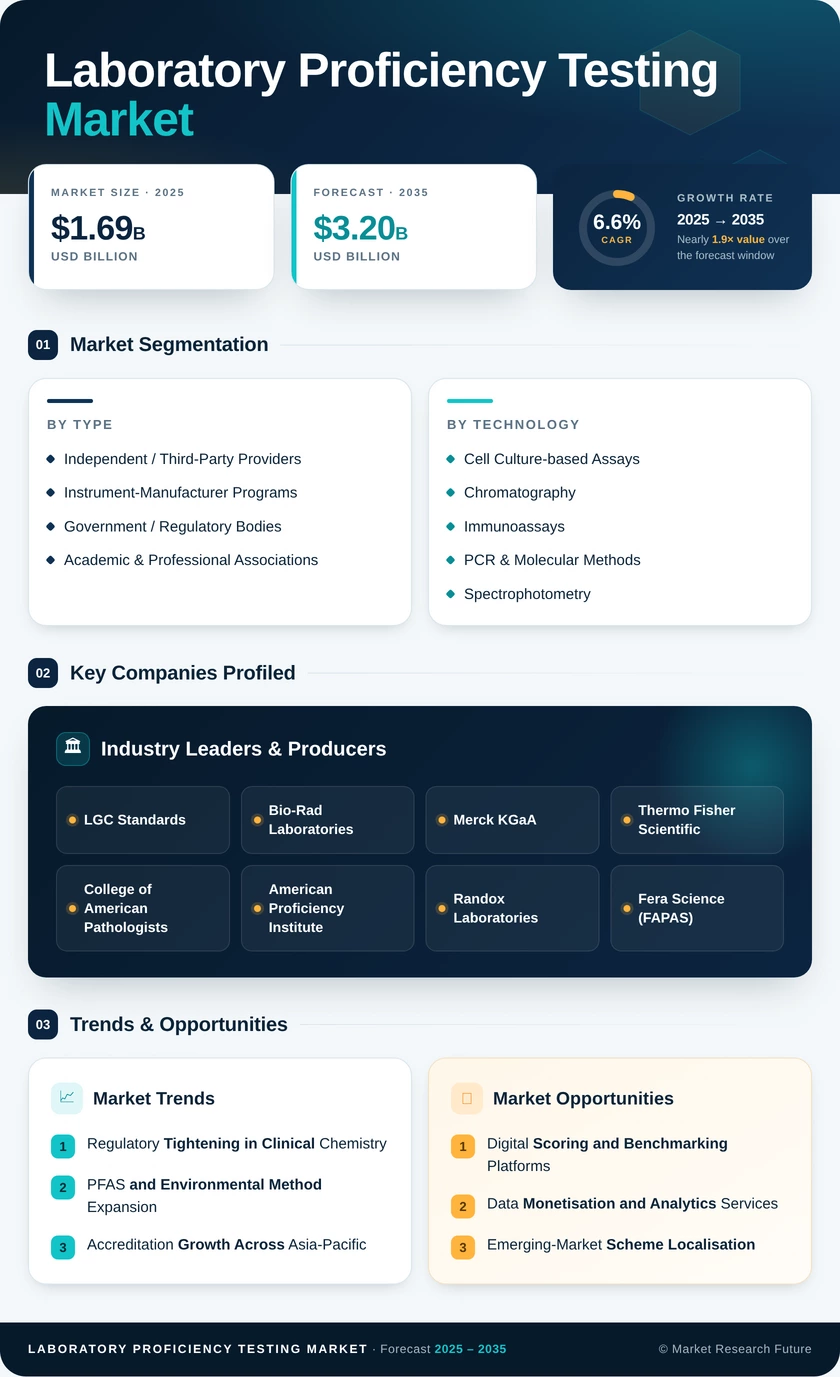
Laboratory Proficiency Testing Market (2026 - 2035)

Laboratory Proficiency Testing Market Research Report By Test Type (Biological, Chemical, Forensic, Microbiological, Other), By Lab Accreditations (CAP 15189, ISO 17025, CLIA, Other), By Lab Size (Small Laboratories (1-5 employees), Medium Laboratories (6-10 employees), Large Laboratories (11+ employees)), By Application (Clinical Diagnostics, Environmental Monitoring, Food Safety, Research and Development, Other) and By Regional (North America, Europe, South America, Asia Pacific, Middle East and Africa) - Growth & Industry Forecast 2025 To 2035

Forecast Period
2026-2035
CAGR
6.6%
2025 Market Size
USD 1.69 Billion
2035 Market Size
USD 3.20 Billion
Healthcare ● Updated August 2026 Report ID: MRFR/HC/24623-HCR | Pages: 128 | Author: Satyendra Maurya, Rahul Gotadki
  1. 1 Market Overview |
    1. 1.1 Study Assumptions & Market Definition |
    2. 1.2 Scope of the Study |
    3. 1.3 Research Methodology
  2. 2 Market Summary & Key Takeaways |
    1. 2.1 Key Findings by Technology |
    2. 2.2 Key Findings by Industry Type |
    3. 2.3 Key Findings by Geography
  3. 3 Global Market Size & Forecast (2021–2035) |
    1. 3.1 Historical Market Size (2021–2024) |
    2. 3.2 Base Year Assessment (2025) |
    3. 3.3 Forecast Market Size (2026–2035) |
    4. 3.4 Year-over-Year Growth Analysis
  4. 4 Market Drivers Analysis |
    1. 4.1 Regulatory Tightening in Clinical Chemistry |
    2. 4.2 PFAS and Environmental Method Expansion |
    3. 4.3 Accreditation Growth Across Asia-Pacific |
    4. 4.4 Assay Complexity and Method Migration |
    5. 4.5 Driver Impact Matrix
  5. 5 Market Restraints Analysis |
    1. 5.1 Budget Pressure on Public Laboratories |
    2. 5.2 Fragmented Scheme Landscape |
    3. 5.3 Reference Material Supply Constraints |
    4. 5.4 Restraint Impact Matrix
  6. 6 Market Opportunity Analysis |
    1. 6.1 Digital Scoring and Benchmarking Platforms |
    2. 6.2 Data Monetisation and Analytics Services |
    3. 6.3 Emerging-Market Scheme Localisation |
    4. 6.4 Cell and Gene Therapy Potency Verification |
    5. 6.5 Bundled Accreditation Support
  7. 7 Regional Analysis |
    1. 7.1 North America | |
      1. 7.1.1 US | |
      2. 7.1.2 Canada | |
      3. 7.1.3 Mexico |
    2. 7.2 Europe | |
      1. 7.2.1 Germany | |
      2. 7.2.2 UK | |
      3. 7.2.3 France | |
      4. 7.2.4 Italy | |
      5. 7.2.5 Spain | |
      6. 7.2.6 Nordic Countries | |
      7. 7.2.7 Russia | |
      8. 7.2.8 Rest of Europe |
    3. 7.3 Asia-Pacific | |
      1. 7.3.1 China | |
      2. 7.3.2 India | |
      3. 7.3.3 Japan | |
      4. 7.3.4 South Korea | |
      5. 7.3.5 ASEAN | |
      6. 7.3.6 Rest of Asia-Pacific |
    4. 7.4 South America | |
      1. 7.4.1 Brazil | |
      2. 7.4.2 Argentina | |
      3. 7.4.3 Rest of South America |
    5. 7.5 Middle East & Africa | |
      1. 7.5.1 Saudi Arabia | |
      2. 7.5.2 UAE | |
      3. 7.5.3 South Africa | |
      4. 7.5.4 Egypt | |
      5. 7.5.5 Rest of Middle East & Africa
  8. 8 Future Outlook (2026–2035) |
    1. 8.1 Autonomous Result Interpretation |
    2. 8.2 Platform Economics and Scheme Consolidation |
    3. 8.3 Decentralised and Point-of-Care Verification |
    4. 8.4 Traceability and Sustainability Reporting
  9. 9 Segmentation Analysis |
    1. 9.1 By Industry Type | |
      1. 9.1.1 Clinical Diagnostics | |
      2. 9.1.2 Microbiology | |
      3. 9.1.3 Pharmaceutical & Biologics | |
      4. 9.1.4 Food & Animal Feed
      5. 9.1.6 Commercial Beverages | |
      6. 9.1.7 Cosm4etics & Personal Care | |
      7. 9.1.8 Others |
    2. 9.1.5Water & Environmental | |
    3. 9.2 By Technology | |
      1. 9.2.1 Cell Culture-based Assays | |
      2. 9.2.2 Chromatography | |
      3. 9.2.3 Immunoassays | |
      4. 9.2.4 PCR & Molecular Methods | |
      5. 9.2.5 Spectrophotometry | |
      6. 9.2.6 Others |
    4. 9.3 By Provider Type | |
      1. 9.3.1 Independent / Third-Party Providers | |
      2. 9.3.2 Instrument-Manufacturer Programs | |
      3. 9.3.3 Government / Regulatory Bodies | |
      4. 9.3.4 Academic & Professional Associations
  10. 10 Competitive Landscape |
    1. 10.1 Market Concentration Analysis |
    2. 10.2 Competitive Benchmarking Matrix |
    3. 10.3 Company Profiles | |
      1. 10.3.1 LGC Standards | |
      2. 10.3.2 Bio-Rad Laboratories | |
      3. 10.3.3 Merck KGaA | |
      4. 10.3.4 Thermo Fisher Scientific | |
      5. 10.3.5 College of American Pathologists | |
      6. 10.3.6 American Proficiency Institute | |
      7. 10.3.7 Randox Laboratories | |
      8. 10.3.8 Fera Science (FAPAS) | |
      9. 10.3.9 Waters Corporation | |
      10. 10.3.10 Eurofins Scientific | |
      11. 10.3.11 NSI Lab Solutions | |
      12. 10.3.12 Phenova (Antylia Scientific)
  11. 11 Recent News & Developments
  12. 12 Report Scope & Methodology |
    1. 12.1 Study Period & Base Year |
    2. 12.2 Valuation Currency & Units |
    3. 12.3 Estimation Framework
  13. 13 Detailed Sources & Citations
  14. 14 Frequently Asked Questions
  15. 15 LIST OF TABLES
  16. 16 LIST OF FIGURES
Share::
Request Free Sample

Segmentation Quick Reference

DimensionSub-SegmentsDominant SegmentFastest Growing Segment
By Industry TypeClinical Diagnostics; Microbiology; Pharmaceutical & Biologics; Food & Beverage Testing; Environmental Testing; OthersClinical DiagnosticsPharmaceutical & Biologics
By TechnologyCell Culture-based Assays; Chromatography; Immunoassays; PCR & Molecular Methods; Spectrophotometry; OthersCell Culture-based AssaysPCR & Molecular Methods
By Provider TypeIndependent / Third-Party Providers; Instrument-Manufacturer Programs; Government / Regulatory Bodies; Academic & Professional AssociationsIndependent / Third-Party ProvidersGovernment / Regulatory Bodies
By GeographyNorth America; Europe; Asia-Pacific; South America; Middle East & AfricaNorth AmericaAsia-Pacific


Market Segmentation Overview

By Industry Type

Sub-SegmentKey Trend
Clinical DiagnosticsTighter analyte grading criteria expand mandatory challenge categories
MicrobiologyRapid identification platforms require organism-level verification.
Pharmaceutical & BiologicsPotency and comparability work drives multi-round enrolment.
Food & Beverage TestingAccreditation-linked export certification widens participant base.
Environmental TestingUltra-trace contaminant rules create premium-priced panels.
OthersForensic and materials disciplines adopt formal competence evidence.


Regulated clinical work remains the revenue anchor, but the incremental dollar increasingly comes from pharmaceutical and environmental disciplines where method complexity outpaces existing scheme coverage. Providers able to launch new analyte panels quickly capture a disproportionate share of that incremental spend.

By Technology

Sub-SegmentKey Trend
Cell Culture-based AssaysCommutable potency materials command premium pricing
ChromatographyResidue and impurity panels expand with contaminant regulation.
ImmunoassaysPlatform harmonisation reduces but does not remove inter-method bias.
PCR & Molecular MethodsMultiplex panels multiply verification obligations per laboratory.
SpectrophotometrySteady demand tied to metals and routine clinical chemistry
OthersMass spectrometry and sequencing schemes emerge from pilot stage.


Method migration is the defining technological force. As laboratories replace single-analyte assays with multiplexed platforms, the number of verifiable parameters per instrument rises sharply, lifting revenue per participant even where participant counts stay flat.

By Provider Type

Sub-SegmentKey Trend
Independent / Third-Party ProvidersVendor neutrality remains the preferred procurement default
Instrument-Manufacturer ProgramsBundling with service contracts sustains a captive base.
Government / Regulatory BodiesNational reference laboratories scale domestic scheme capacity.
Academic & Professional AssociationsSpecialty discipline schemes retain niche authority.


Independent operators hold the structural advantage because assessors scrutinise grading independence. Government-run schemes nonetheless grow quickest in accreditation-expanding economies, where public funding subsidises participation for laboratories that could not otherwise absorb the cost.

By Region

Sub-SegmentKey Trend
North AmericaStatutory participation delivers high-retention recurring revenue
EuropeISO 15189 transition concentrates purchasing into 2026–2028
Asia-PacificAccreditation base expansion converts directly into enrolment growth.
South AmericaAgricultural export certification anchors residue scheme demand
Middle East & AfricaCapacity building and regional material staging reduce delivery friction.


Geographic momentum favours regions where the accredited laboratory count is still climbing. Mature markets defend value through analytics and premium panels, while emerging regions add participants faster than they add spend per participant.




Share::
Request Free Sample
Download PDF ×

We do not share your information with anyone. However, we may send you emails based on your report interest from time to time. You may contact us at any time to opt-out.