Segmentation Quick Reference
| Dimension | Sub-Segments | Dominant Segment | Fastest Growing Segment |
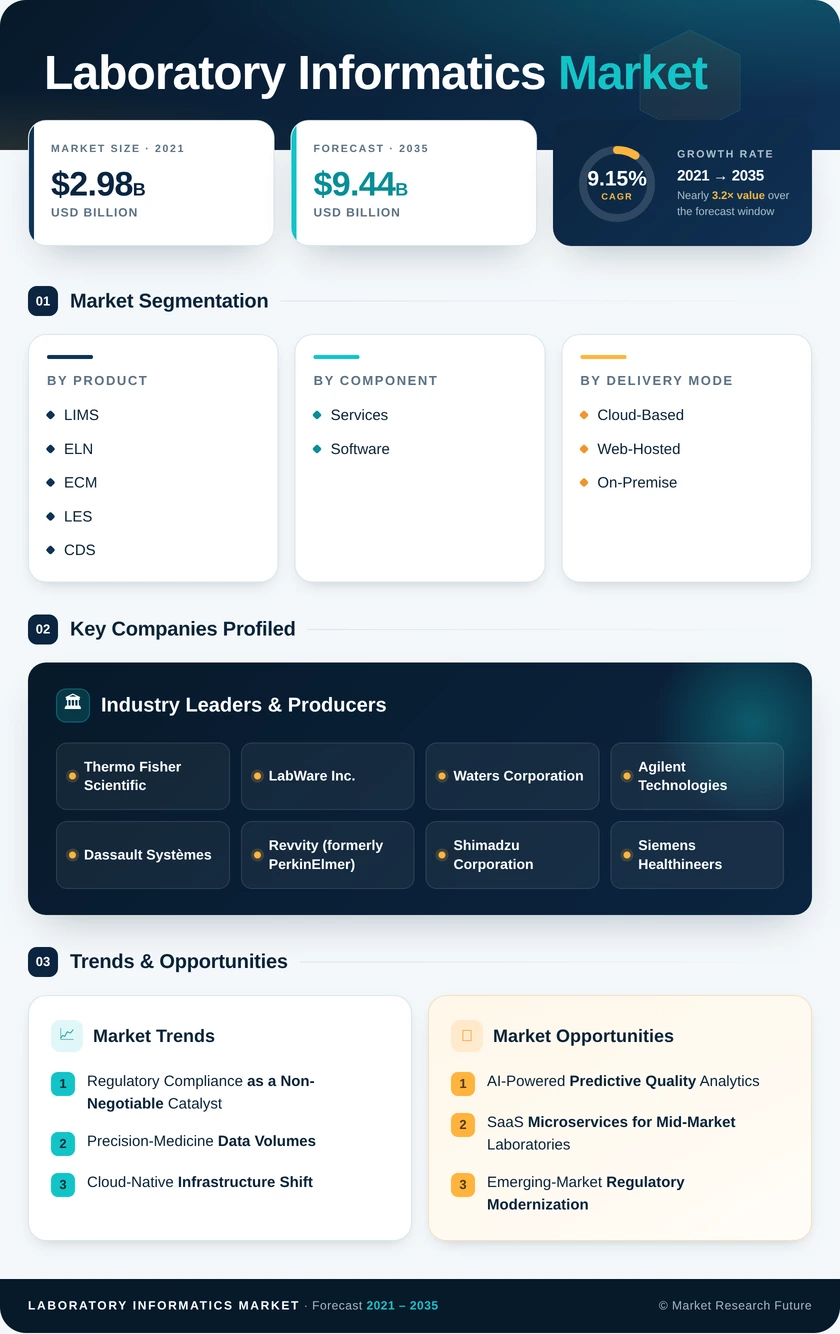
| By Product | LIMS, ELN, ECM, LES, CDS, Other Products | LIMS (47.3% share, 2025) | ELN (10.59% CAGR) |
| By Component | Services, Software | Services (54.1% share, 2025) | Software (9.48% CAGR) |
| By Delivery Mode | Cloud-Based, Web-Hosted, On-Premise | Cloud-Based (53.9% share, 2025) | Cloud-Based (highest CAGR) |
| By End User | Pharma & Biotech, CROs, Other End Users | Pharma & Biotech (48.9% share, 2025) | CROs (9.70% CAGR) |
| By Geography | North America, Europe, Asia-Pacific, South America, MEA | North America (44.8% share, 2025) | Asia-Pacific (10.18% CAGR) |
Market Segmentation Overview
By Product
| Sub-Segment | Key Trend |
| LIMS | Core compliance backbone; steady replacement-cycle demand across GMP/GLP environments |
| ELN | Fastest adoption in R&D-heavy organizations; IP protection and reproducibility driving uptake |
| ECM | Document-control requirements under Annex 11 and Part 11 sustain demand |
| LES | Integration with manufacturing execution systems creating convergence opportunities |
| CDS | Analytical-instrument data integrity mandates fueling upgrades from legacy versions |
| Other Products | SDMS and specialized modules serving niche environmental and food-safety testing segments |
LIMS remains the product category that most procurement teams evaluate first because regulatory auditors treat it as the primary system of record. ELN adoption is accelerating as biopharma companies recognize the legal and scientific value of machine-readable experimental records over paper notebooks.
By Component
| Sub-Segment | Key Trend |
| Services | Validation, implementation, and multi-year managed-service contracts dominate spend |
| Software | SaaS and subscription-model migration shifting revenue from perpetual licenses to recurring streams |
Services carry the larger share because the regulatory complexity of deploying informatics in validated environments demands specialized consulting, IQ/OQ/PQ execution, and ongoing support. Software growth outpaces services as subscription pricing lowers barriers for mid-market laboratories entering the digital ecosystem.
By Delivery Mode
| Sub-Segment | Key Trend |
| Cloud-Based | Default for new deployments; disaster-recovery and elastic-compute advantages |
| Web-Hosted | Transitional architecture for organizations migrating from on-premise |
| On-Premise | Retained for classified, defense, and sovereign-data environments |
Cloud-based platforms command the majority share and the highest growth rate simultaneously, a rare combination that reflects both greenfield adoption and active replacement of legacy on-premise installations. Web-hosted solutions serve as a stepping-stone for risk-averse organizations.
By End User
| Sub-Segment | Key Trend |
| Laboratory Informatics Market & Biotechnology Companies | Heaviest regulatory burden drives comprehensive multi-module deployments |
| Contract Research Organizations (CROs) | Outsourced R&D growth creating multi-tenant platform demand |
| Other End Users | Academic, government, and environmental laboratories with growing compliance obligations |
Laboratory Informatics Market and biotechnology companies anchor the market because their regulatory footprint spans preclinical research through commercial manufacturing — each stage requiring validated informatics. CROs register the fastest growth as global R&D outsourcing continues its structural expansion and sponsors demand informatics parity with in-house operations.